ÇANKAYA UNIVERSITY
GRADUATE SCHOOL OF NATURAL AND APPLIED SCIENCES
THE DEGREE OF MASTER OF SCIENCE IN FINANCIAL ECONOMICS
MASTER THESIS
EFFICIENCY AND PRODUCTIVITY IN TURKISH BANKING SECTOR
ERİNÇ BAYRİ
iv ABSTRACT
EFFICIENCY AND PROCDUCTIVITY IN TURKISH BANKING SECTOR
ERİNÇ BAYRİ
M.Sc. in Financial Economics Supervisor: Prof. Dr. Ergun DOĞAN
AUGUST 2014, 67 Pages
We study the efficiency and productivity growth in Turkish banking by using the non-parametric method, data envelopment analysis (DEA) and the Malmquist index in the period of 2003-2012. One aim of the study is to examine whether the banking reforms undertaken after the crisis in 2001 have had any effect on productivity. This is also a period of rapid development in the banking sector as it is evident from the substantial increases in numbers of branches, employees, and ATMs, which should affect productivity. We find that productivity growth in Turkish commercial banking sector is 0.1 percent per year over the period, which is rather low. We also present some evidence that privately-owned banks have done slightly better than foreign banks. We also look into the effect of the Global financial Crisis in 2008, and conclude that contrary to the popular impression banking sector might have suffered from it.
Key Words: Efficiency, Productivity, Malmquist Index, Data Envelopment Analysis (DEA)
v ÖZ
Bu çalışma 2003-2012 yılları arasındaki Türk Bankacılık sektörünün verimlilik ve etkinlik gelişimini veri zarflama analiz yöntemi (VZA), Malmquist endeksi ve parametrik olmayan yöntemler kullanarak incelemeyi amaçlamaktadır. Çalışmanın bir amacı da 2001 krizi sonrası Türk bankacılık sektörünün verimliliğinin etkilenip etkilenmediğini incelemektir. Verimliliği etkileyebilecek faktörler arasında yer alan şube, ATM ve çalışan sayısındaki artıştan da anlaşılabileceği gibi bu dönem bankacılık sektörünün hızlı gelişim dönemi kabul edilebilir. Bu dönemde Türk bankacılık sektörünün verimliliği yüzde 0.10/yıl olarak bulunmuştur, bu değer bankacılık açısından düşük bir değerdir. Çalışılan süre zarfı içerisinde özel bankaların yabancı bankalardan biraz daha yüksek performans sergilediği kanaatine ulaşılmıştır. Son olarak 2008 yılında meydana gelen küresel ekonomik krizin bankacılık sektörüne etkisi araştırılmış, bu araştırma ile yaygın kanaatinin aksine Türkiye bankalarının bu krizden önemli ölçüde etkilendiği sonucuna ulaşılmıştır. Anahtar Kelimeler: Etkinlik, Verimlilik, Malmquist Endeksi, Veri Zarflama Analizi (VZA)
vi TABLE OF CONTENTS STATEMENT OF NONPLAGIARISM………iii ABSTRACT………iv ÖZ………v TABLE OF CONTENTS………...………...vi LIST OF TABLES………..……...vii LIST OF FIGURES………..viii 1. INTRODUCTION ………..………... 1 2. LITERATURE REVIEW ……….. 6
3. DATA and METHODOLOGY ………... 23
3.1. Productivity Malmquist Index ……….. 23
3.2. Scale Efficiency ……… 26
3.3. Data Envelopment Analysis (DEA) and the Calculation of the Distance Function ………29
3.4. Data ………... 30
4. EMPRICAL RESULTS ………... 32
4.1. Efficiency ……….. 32
4.2. Productivity ……….. 38
4.3. Effects of the Global Financial Crisis ………... 43
5. CONCLUSION ………... 44
REFERENCES….………... 46
APPENDIX ………. 51
vii
LIST OF TABLES
Table 1.1. Banks by Function ………..………. 3 Table 1.2. Key Indicators (Commercial Banks) ………...…… 3 Table 3.1. Mean Values of Inputs and Outputs (in Millions of US Dollars)…….. 31 Table 4.1. Technical Efficiency Scores of Continuously Operating Banks (24
Banks)……….. 33 Table 4.2. Technical Efficiency Scores for Privately-owned Banks and Foreign Banks (21 Banks) ……… 34 Table 4.3. Technical Efficiency Scores for Privately-owned Banks (11 Banks) ……….. 36 Table 4.4. Technical Efficiency Scores of Foreign Banks (10 Banks) …………... 37 Table 4.5. CRS Efficiency by Ownership ……….. 38 Table 4.6. Malmquist Indexes for All Banks (24 Banks) ……….. 39 Table 4.7. Malmquist Indexes for Privately-Owned and Foreign Banks (21
Banks)……….. 40 Table 4.8.Malquist Indexes for Privately-owned Banks Only (11 Banks) ………. 40 Table 4.9. Malmquist Indexes for Foreign Banks Only (10 Banks) ……….. 41 Table 4.10. Productivity Change by Ownership ………. 42 Table 4.11. The Effect of the Global Crisis in 2008 (Malmquist index: Summary of Annual Means) ……… 43 Table A.1. Banks Included in the Study ………. 51 Table B.1. The Effect of the Global Crisis in 2008………. 52
viii
LIST OF FIGURES
Figure 3.1. Estimated Production Frontiers for Periods t and t+1 ………... 24 Figure 3.2. Variable Return to Scale (VRS) Constant Return to Scale (CRS)
Production Function ………... 27 Figure 4.1. Technical Efficiency Scores of Continuously Operating Banks ……... 33 Figure 4.2. Technical Efficiency Scores for Privately-Owned and Foreign
Banks………...35 Figure 4.3. Technical Efficiency Scores for Privately-Owned Banks ………. 36 Figure 4.4. Technical Efficiency Scores of Foreign Banks ………. 37
1
CHAPTER 1 INTRODUCTION
In the 1990’s, the economic and financial crisis had a negative effect on the Turkish banking sector. The core reason behind the problems occurring in the banking sector during the 1990’s was indicated by deregulation policies. Acceptance of deposits denominated in foreign currency being unlimited, commercial banks financing their budget deficits by borrowing and such applications have been the reasons behind the crisis in banking sector. (Çolak, 2001)
Due to rising inflation in the economy, in the beginning of the 2000’s the government implemented a new economic program in order to reduce inflation and boost the growth of the economy. This program’s aim was to execute a strong monetary policy which not only reduced the inflation but also achieved to reach its target point concerning the exchange rate. After the implementation of this program, oversight of the banking sector was given to a government agency which is the banking supervision and regulation agency (BRSA). Thus, the authority to supervise and regulate the banking sector is conducted by a single government agency. As a result, the implementation of the program has been successful and led to a decrease in the inflation and an increase in the demand of the economy. The Turkish Government made an agreement with International Monetary Fund (IMF) in order to prevent the crisis to escalate further.
After the February 2001 crisis the Government has put the program which is called “Transition to the Strong Economy”. Before the use of this new program, there was an increase in the exchange rates, significant reduction in lending rates, a deep decrease in consumption and investment rates, fluctuating prices and a cut down in the flow of foreign credits. This all had a negative impact on the economy in year 2001. Due to foreign exchange gap many banks were left struggling. (Tokatlıoğlu, 2012)
2
When entering the 2000’s, the solutions of the problems in the banking sector as to maintain economic stability and growth was the most critical point. In order to regulate the banking sector, Turkey had taken followed all the steps conducted previously in the world after the crisis. According to government regulations, banks which faced undercapitalization and had a weak structure, were ceded to Savings Deposits Insurance Fund (SDIF/TMSF) in order to solve the issues within the banks. The banks which were not ceded by SDIF were promised liquidity support by the government. Banks that were to strengthen their capital on their own and could not were encouraged to leave the sector. Finally, to dissolve the crisis and its effect experienced in the banking sector, arrangements were made by the government. (Tokatlıoğlu, 2012)
Banking Regulation and Supervision Agency (BRSA) had announced the program “Banking Sector Restructuring Program”; this program included increased efficiency of public and privately banks and aimed for a stronger structure in the sector. With the release of a banking law, the Turkish banking sector was in compliance with international standards. Ultimately, there have been many changes in the Turkish banking sector throughout the crisis and regulations have been put to place to prevent such an instance in the future.
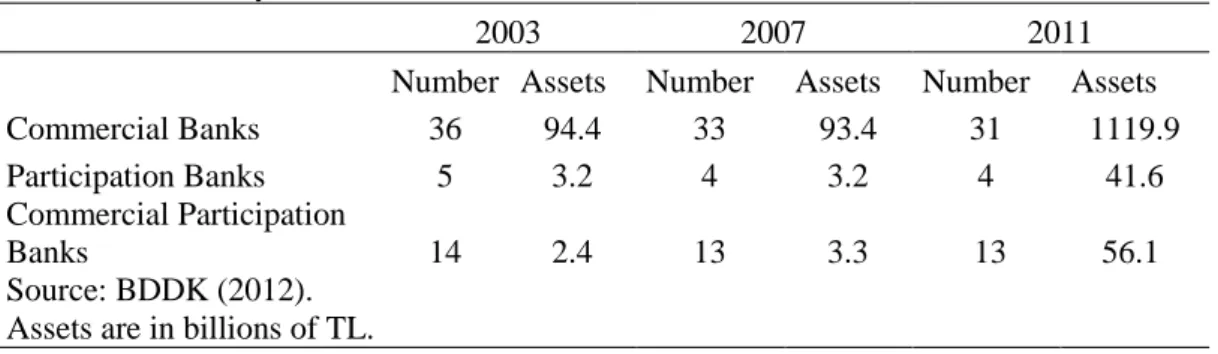
The banking sector can be divided by commercial, investment, and participation banking. Commercial banking includes following services; credit services, cash management, deposit services and foreign exchange. Investment banking differs from commercial banking as it covers the following services; asset securitization, mergers and acquisitions. (International Institute for Sustainable Development , 2013)
Participation banking is known as Islamic banking around the world. This type of banking has some special properties; the owners participate in the profits instead of earning interest. The operations of the participation banks are interest-free, and they include all kinds of activities, such as collecting funds on the basis of profit and loss sharing, trading, ownership and lease of such funds with a banking model.
3 Table 1.1: Banks by Function
2003 2007 2011
Number Assets Number Assets Number Assets
Commercial Banks 36 94.4 33 93.4 31 1119.9
Participation Banks 5 3.2 4 3.2 4 41.6
Commercial Participation
Banks 14 2.4 13 3.3 13 56.1
Source: BDDK (2012). Assets are in billions of TL.
Today’s banking sector plays a major role in Turkish economy. In general the banking sector has become very sophisticated. Both nationally and internationally, banks have grown to hold billion in assets. Furthermore, today’s banking sector is using newest technology, offered in their affiliates, ATM’s and online banking, providing customer satisfaction. Table 1.2 shows the developments in certain indicators that might have a serious impact on efficiency and productivity. By the end of period (as of 2011) there were large increases in number of branches and the employees (by 62 percent and 49 percent respectively). A similar trend is also observed in the number of ATM machines (a 140 percent increase) and the number of POS machines (a 207 percent increase).
Table 1.2 Key Indicators (Commercial Banks)
Year Number of Banks Number of Branches Number of employees ATM network (machines) Number of POS machines Assets (billions of TL) 2003 36 6045 118573 12726 94.4 2004 35 6186 122592 13556 892886 94.2 2005 34 6241 127851 14529 1103924 94.2 2006 33 6904 138599 16133 1223807 93.9 2007 33 7678 153568 18315 1355005 93.4 2008 32 8724 166326 21274 1509440 93.4 2009 32 8968 167063 23151 1602721 92.7 2010 32 9419 173133 26680 1689850 92.6 2011 31 9791 176579 30600 1847929 92.0 Source: BDDK (2012)
4
Deregulation has led to a series of outcome, one being a noticeable increase in convergence, as investment and commercial banks seem to integrate activities of one another. By all means, both types of banking institutions find themselves competing with one another. (International Institute for Sustainable Development , 2013). Overall, deregulation and the changes made throughout the years have made banks even more important than ever. Technologic improvements raised the awareness of banks, giving them a bigger role in the economy, affecting not only the government but also the community.
The purpose of this study is to investigate the productivity growth in Turkish banking industry for the period of 2003-2012. Moreover the productivity growth and efficiency differences between sub-periods of 2003 to 2008 and post crisis period of 2008 until 2012 are also investigated. In addition to the effects of crises (in the years of 2001 and 2008), the impact of improvement and adoption of information technology (such as the increase in the number of ATMs and POS machines) is studied to observe changes in total factor productivity (TFP) and efficiency of banks.
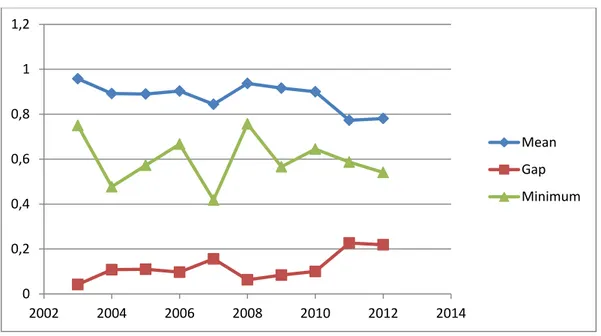
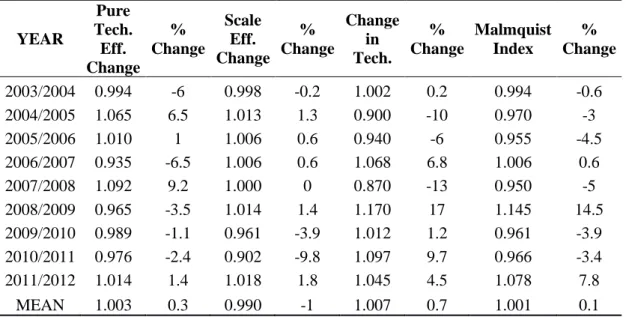
In this study, efficiency and productivity growth in Turkish banking is examined by using the non-parametric method, data envelopment analysis (DEA) and the Malmquist index, developed by Fare at all (1989). Within this framework, productivity growth may be measured by combination of technological change and change in technical efficiency at the level of operating unit. The Malmquist index measures these two components as technological change and change in technical efficiency. Moreover the component of efficiency can be divided into two components which are pure technical and scale efficiency. This paper also examines technical efficiency measures, minimum efficiency and gap levels, Malmquist indexes, mean values of inputs and outputs, productivity and technical changing in Turkish banking sector over the period of 2003 to 2012 which illustrate how closely a unit operates in relation to the production frontier. Technical efficiency shows the level to which operating bank produces maximum output for a given level of inputs, or utilizes the minimum amount of inputs to produces a given level of output. Higher efficiency does not absolutely indicate that the bank achieve highest productivity since the technology may have changed.
5
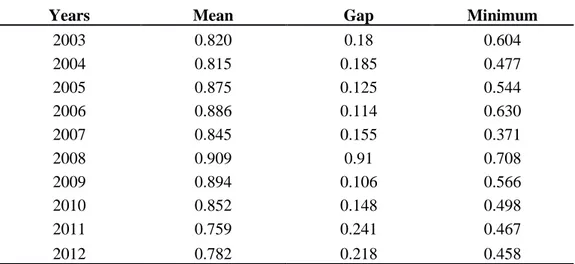
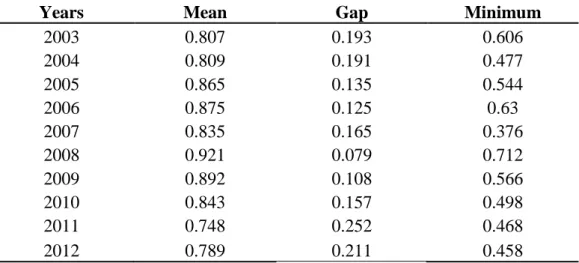
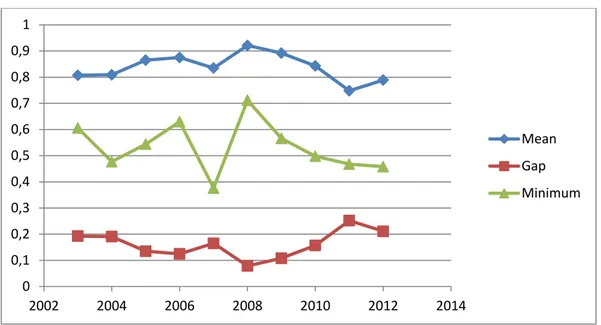
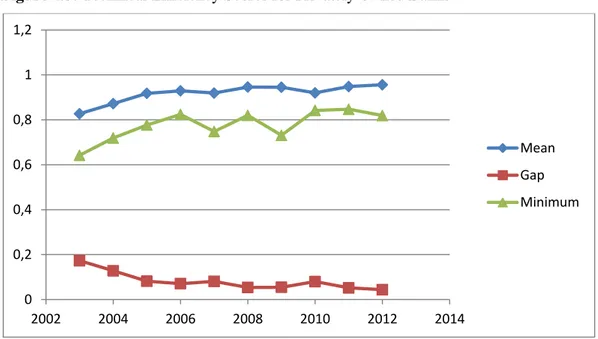
There are a huge number of non-parametric studies that investigate the banking sector in around of the world as well as in Turkey. These previous studies examined the efficiency and productivity of Turkish operating banks in overall manner but this paper includes all of four sections which are Continuously Operating Banks (COBs), privately-owned and foreign banks, privately-owned banks and foreign banks only. These four sections are examined completely as minimum efficiency levels, mean levels of inputs and outputs, gap scores to the frontier level, summary of annual means by various tables and graphs. The study examines all of the mean output levels during the whole period of 2003 to 2012 by way of non-parametric DEA based Malmquist index.
The structure of the thesis is as follows. The next chapter presents a review of the relevant literature on the efficiency and productivity of banking sectors of Turkey and other countries. Chapter 3 methodology and the data set used in the study are described. Chapter 4 presents the results and Chapter 5 concludes.
6
CHAPTER 2 LITERATURE REVIEW
In this chapter we revive some of the relevant literature. Even though we use the data envelopment analysis method in our study studies that use the alternative methodology, stochastic frontier approach, or both have also been covered. A summary of this review appears in Appendix D.
Dogan and Fausten (2003) investigated productivity and technical change in Malaysian banking sector for the period of 1989-1998. The aim of this study was to examine the impact of deregulation and technological change on the productivity of Malaysian banks for the given period by using non-parametric data envelopment analysis (DEA). In the study the inputs used were labor and borrowed funds as reflected in personnel costs and interest expense whereas the used three outputs were investment securities, loans & advances and deposits from customers. They concluded that productivity of Malaysian banks has deteriorated during the studied period. Also the Malmquist indices suggested that Malaysian larger banks have greater experience of productivity decline than smaller ones. Moreover the study indicated that Malaysian banks in the sample could not use the potential benefits of technological improvements for example ATM networks.
Jakson, Fethi and Inal (1998) investigated Turkish banking sector for 1992-1996 periods. They employed non-parametric methodologies, data envelopment analysis (DEA) based on Malmquist index. In this study ‘outputs’ consist from the number of employees and sum of non-labor operating expense, direct expenses on building, amortization expenses whereas ‘inputs’ consist from loans, demand deposits and time deposits. They reached an important thing; increasing productivity was changing according to technological advancement.
Drake (2001) observed efficiency and productivity change in United Kingdom (UK) banking sector at the beginning of 1984 until 1995. And he utilized data envelopment analysis (DEA) and envelopment of decision making units (DMUs) as his methodology. In this paper inputs and outputs have been divided to two categories. Model 1 inputs are; fixed assets, number of employees and deposits
7
and model 2 inputs are given as fixed assets and number of employees. Also there are two output categories as output 1 and output 2. Loans, liquid assets (+) investments and other incomes have been stayed as output 1 whereas loans, liquid assets (+) investments, other assets and investments stand for output 2. As a result, he decided that all the large United Kingdom clearing banks had run into decreasing returns at real assets belong the level of £ 60 billion.
Rezitis (2006) researched productivity growth and technical efficiency effects on the Greece banking sector from 1982 to 1992 periods which used Data Envelopment Analysis (DEA) based on Malmquist Index as the methodology. Indeed this literature also measures change in expansion of Greek Banking Industry by efficiency of productivity by using same methodology. In addition to this subject, there were some capital and loans (loan services and deposit accounts) , deposits and other liabilities as inputs also there were the outputs which consisted from interest expenses, production cost (number of account serviced and costs). As a result, the author found that productivity growth increased when there was positive effect on efficiency.
Harthman, Storbeck and Patricia (2001) investigated that allocative efficiency in branch banking by using some data from 50 saving bank branches in Sweden. While observing the efficiency of branch banking sector they used Data Envelopment Analysis (DEA), Constant Return to Scale (CRS) and Variable Return to Scale (VRS) as study method during the period from 1994 to 1995. However, in their paper outputs were consisted from; number of customers and branches and inputs were consisted from number of staff and computers. They concluded that small branch banks which generally have limited sources were the most efficient intermediaries in the Sweden banking sector.
Sufian and Habibullah (2012) investigated linkage between the level of globalization and performance ratio of Indonesia banking sector during the period from 1999 to 2007. This paper contains Data Envelopment Analysis (DEA), Decision Making Unit (DMU), Constant Return to Scale (CRS), Variable Return to Scale (VRS), Pure Technical Efficiency (PTE) and Ordinary Least Square (OLS) as the methodology. And also 1999-2007 periods were employing inputs as total deposits (deposits from customers and other banks), fixed Assets (plant and
8
equipments non-interest expenses, labor and physical capitals whereas outputs were loans (includes loans to customer and other banks), investment (dealing and investment securities) and borrowers. They concluded the banks which are having better capital organization would be performing higher level of efficiency and the study also showed that the banks which were having overhead operating cost and credit risk, have been represented lower efficiency banks in the sector of Indonesian. Fukuyama and Weber (2008) investigated inefficiency of Japanese banking sector and measured shadow prices of problem loans from 2002 to 2004. They employed non-performing loans methodology based on data envelopment analysis (DEA). Their inputs were inputs of labor, physical capital. They suggested that raised funds loans and other interest bearing assets as good outputs whereas further non-performing loans accepted as bad outputs. On the other hand they concluded that inefficiency could be taken under the control by using non-performing loans for Japanese banking sector.
Titkoa and Jureviciene (2013) measured the gross countries banking sector analysis and efficiency of Latvian and Lithuanian banking sector by performing non-parametric frontier technique based on data envelopment analysis methodology from the period of 1978 to 1995. Furthermore, deposits, labor, loan accounts and capital have been accepted as inputs whereas total loans and securities given as outputs. Finally, they concluded that powerful and large banks were more efficient than small banks and observed that bigger banks had more active role in the banking sector for Latvia and Lithuania during the given period.
Guille´n, Rengifo, and Ozsoz (2014) studied Latin American banks’ profitability and tried to understand why banks reduce their interest rate spread for 1989 to 2005. Their methodology measured balance sheet and income statement, it was Data Envelopment and Decision Making Unit (DMU) based on the data envelopment analysis (DEA). used inputs were fixed assets, deposits and money market funding + time deposit interest expense and personal expenses whereas outputs have been given as interest income and total earning assets. On the other hand, the aim of the paper is to understand change in efficiency of the Latin American banks’ profitability by power effect and reached answer was power had
9
direct effect on Latin American banking sector. Latin American banks have been earning from the oligopolistic position in the all economic periods.
Kilic (2011) investigated Turkish banking sector. She used a non-parametric approach- like methodology based on the data envelopment analysis (DEA). The inputs and outputs have been divided to two categories. First one was under production approach which was including number of employees, occupancy, furniture and equipment and other non-interest expenses and the other inputs have been determined as deposits, debentures, other liabilities, shareholder equity, number of employees, physical capital and non-interest expenses in the under-intermediation approach. Whereas number of demand deposits, time deposits, real estate loans and commercial loans have been determined as under-production approach for output. Meanwhile loans, securities, deposits with other banks, except central bank and non-interest income have been also determined as under-intermediation approach for output as well. On the other hand, the aim of this literature is that how Turkey has been affected by the 2001 Global Crises and demonstration of acquisitions effect on the banking sector. The result is that Turkish banking sector has been grown up very faster than the whole Turkish economics and during the economic crises some of banks have been closed and some of banks were merged with other domestic or international banks to cope with the crisis. We understood from this paper by increasing performance of acquisitions banks the performance of the non-acquisitions banks increased at the same time.
Bayyurt (2013) investigated ownerships effects on bank’s performance on foreign and domestic Turkish Banks during 2013 by multi making approach based on data envelopment analysis (DEA). There were several inputs and outputs have been provided for his paper. Some of inputs were given as labor which included: number of employees, capital and deposits of the banks and loanable funds which were including: sum of deposits and non-deposit funds. Whereas some of outputs were given as credits, other earnings assets like sum of loans to investment security, and off-balance sheet activities like guarantees, warranties, commitments, derivative financial instruments, and custodial and pledged securities. As a result of this research we have reached that Turkish Domestic banks have less efficient than the foreign banks. Also domestic banks are less efficient to find cheap fund. Because
10
foreign banks have an international linkage, in this way they may find the fund cheaper than the other banks. Indeed domestic banks have more personnel at their branches (it was 9117) than foreign banks (2661 in 2010.) Hence domestic banks’ prices are much more expensive than the domestic ones. These factors explain that why foreign banks are more efficient than the domestic banks in Turkey.
Denga, Wonga, Wooia, and Xiong (2011) investigated what happened to the productivity effect on Malaysia banking sector and how internet and technology affected banking sector during the period from 2001 to 2009. And they used data envelopment analysis (DEA) based Malmquist index. In their paper inputs were consisted from branches, staff and deposits whereas outputs were consisted from loans, advanced and profits. Finally they found that internet had extreme positive effect on the banking sector for grow up and it had good effect on the banking efficiency on Malaysia banking sector performance because it facilitates to find new and cheaper funds and to stay connected with other bank partners. Indeed total factor productivity is also increased via internet during the studied period.
Pastor, Perez and Quesada (1997) observed efficiency analysis on banks and they made comparison between European and American banking sector for 1997. This paper has been written down to understand efficiency and productivity for several European and American banks. Also they used non-parametric approach and data envelopment analysis based on Malmquist index. In this study inputs were non-interest expenses and personnel expenses meanwhile output ones consisted from loans, other productive assets (all existing deposits with banks, short-term investment, other investments and equity investments), deposits (deposit include short term funding = demand + saving + time + interbank + other). And they concluded that some of European banks as France, Belgium and Spain had most efficient banking system whereas Germany, Australia and United Kingdom had the lowest banking efficiency for the Europe. In addition, one of the European countries (Spain) had faced highest banking efficiency risk at the same time.
Andries and Capraru (2012) measured cost of efficiency for European Union countries during the period from 2003 to 2009 by data envelopment analysis (DEA) and stochastic frontier analysis (SFA). Inputs were consisted from personnel expenses, fixed assets and financial capital (sum of total deposits, total money
11
market funding, total other funding and equity) whereas outputs were given as loans, other earning assets and demand deposits. As a result of this paper, the authors concluded that in the year of 2009 all of the European Union countries exposed a decrease in the banking efficiencies.
Sufian (2011) studied cost efficiency of multinational banks operating for Malaysia banking sector during the period from 1995 to 2007 and employed variable return to scale (VRS) and data envelopment analysis (DEA). And also author accepted inputs as total deposits (deposits from customers and the other banks), capital (book value of property, plant, and equipment), and labor (personnel expenses): (total expenditures on employees such as salaries, employee benefits and reserve for retirement pay) whereas outputs as total loans (loans to costumer and other banks) , investments (dealing and investment securities) and non-interest income (free income and other non-interest income which are being consisted from commission, service charges and fees, guarantee fees, and foreign exchange profits.) Finally author concluded that inside of the foreign banks, American banks were the most efficient ones. But when you look at the Malaysia banking sector domestic banks acted more efficient role because of their culture and social economic status (suitable for the people and their home market) therefore foreign banks in the Malaysia they were not as successful as domestic ones because they cannot adapt the social and cultural conditions so foreign markets had faced much more problems in the Malaysia.
Jahanshahloo, Lotfi, Malkhalifeh, and Namin (2008) they found a new model which is called interval generalized data envelopment analysis (IGDEA) and they used data envelopment analysis (DEA). In their paper incomes were Payable interest, personnel and non-performing loans whereas their outputs come as total sum of four main deposits, other deposits, loans granted, received interest and fee. The aim of this paper is to observe relationship between data envelopment analysis (DEA) and interval generalized data envelopment analysis (IGDEA) during the year of 2008 in Iran.
Karas, Schoors and Weill (2008) investigated which banks were more efficient, private or public banks in Russia for 2002 to 2005 by employing non-parametric approach based on data envelopment analysis (DEA). In their paper
12
inputs were accepted as labor, physical capital and deposits whereas outputs were consisted from total deposits, total loans and treats earning asset. And then, they decided foreign banks showed more efficiency than the domestic banks in Russia but domestic private banks were not more efficient than the public banks during the studied period.
Afzaa and Asgharb (2014) estimated efficiencies of modaraba and leasing companies over the period from 2005 to 2010 for Pakistan. Also they employed parametric stochastic frontier based on data envelopment analysis (DEA). Incomes were labor and business service expenses (total operating expenses), equity capital and debt capital whereas the paper’s outputs were investments and lease finance income (only for leasing companies), total income from sharia compliance (only for modarabas) and investments. And finally they concluded that leasing companies were less efficient than the modaraba companies but they have determined that leasing companies had more technical efficiency than the modaraba ones.
Ali, Lerme and Seiford (1995) observed efficiency analysis of three essential models by using data envelopment analysis for 1995 in the United States. In their paper inputs were annual wages in millions of dollar, annual salaries in thousands of dollar, number of hours work in thousands of hours whereas only total loans called as output. Also they observed form of envelopment surface, orientation and relative trade-off implicit in multiplier lower bonds from their researches.
Brockett, Charnes, Cooper, Huang and Sun (1997) they chose 16 American largest banks to investigate their risk situation and efficiency by monitoring bank performance during the period from 1984 to 1985. And they also employed data envelopment analysis for their paper. incomes were consisted from interest expenses ( interest expenses on deposits and expenses for federal funds purchased and repurchased in domestic offices), non-interest expenses which were included salaries and employees benefits and occupancy expenses, furniture and equipment, provision for loan losses and total deposits like sum of interest bearing and non-interest bearing deposits. Whereas the outputs were consisted from interest income like as interest and fees on loans, income and federal funds sold and repurchases in domestic offices, total non-interest income, allowances for loan losses and total loans just as loans and net of unearned income. All these factors had come together and they observed
13
monitoring and early warning system in their Texas Banking and Insurance companies.
Ataullah, Cockerill and Le (2004) they enquired financial liberalization and commercial bank efficiency in both of Pakistan and India from 1988 to 1998. And they employed two components of pure technical efficiency and scale efficiency based on data envelopment analysis (DEA). Loans, investments and banks incur operating and interest expenses and non-interest expenses bank deposits and loan production were accepted as input where high value added deposits, integrated saving and checking accounts were accepted as output. Finally, when they have applied non-parametric approach based DEA and inserted all inputs and outputs they reached interesting result: the countries started to develop after the year of 1995.
Conhoto and Dermine (2003) they compared the new and old Portugal Banks according to their banking efficiencies over the period from 1990 to 1995. And they employed non-parametric programming technique and data envelopment analysis (DEA) based on malmquist productivity index. Studied inputs were number of employees and physical capital and value of fixed asset whereas their outputs were consisted from loans, deposits, securities, interbank assets and liabilities and the number of branches ( additional value for retail customers, the availability of banking services.) Finally they concluded that the score of the new banks were 77% whereas the score of the old banks were 62%. It means that new banks were dominating ones and they had more efficiency than the old Portugal banks.
Vivas (1997) observed Spanish Saving Banks according to their profit efficiency for 1986 to 1991. The author used the method of Data Envelopment Analysis (DEA), Stochastic Frontier Approach (SFA), Thick Frontier Approach (TFA), and Distribution-Free Approach (DFA). And also in her paper inputs were labor materials and deposits (capturing the interest cost of deposits), a fixed input and physical capital whereas outputs consisted from loans which were composing of the value of home loans and other loans, interbank loans, and produced deposits as the sum of demand, saving, and time deposits. Finally she concluded saving banks did not faced with significant changes and saving banks were preferred ones by their short term profits in the market share.
14
Soteriou and Stavrinides (2000) investigated an internal costumer quality for bank branches based on data envelopment analysis (DEA) for 2000 in Cyprus. In this paper inputs were accepted as clerical personnel (person hours), managerial personnel (person hours), computer terminals (terminal hours), working space (m2), number of personal accounts, number of savings accounts, number of business accounts, number of credit application accounts whereas outputs ones were internal customer perceptions for the branches. Data envelopment analysis was absolutely successful for improving of the costumer quality for the bank branches over the studied period.
Bhattacharyya, Lovell, and Sahay (1997) investigated efficiency of Indian commercial banks over the period from 1986 to 1991. They have used a specific method of Parametric and Stochastic Frontier Analysis (SFA) based on Data Envelopment Analysis (DEA) for their researches. Inputs called as capital, labor, and other non-financial inputs whereas advances, investments, and deposits called as outputs for this paper. Finally they reached the efficiency means of the studied banks: publicly bank’s efficiency mean was 6,09% whereas the efficiency mean for privately banks’ was 5, 95%. They concluded that publicly owned banks were more efficient than the privately owned banks in the India over the period.
Wu, Yang, and Liang (2006) observed efficiency analysis of cross region bank branches in China over 2006 year who were employing Fuzzy method based on data envelopment analysis (DEA). In their paper inputs have divided to two categories. First one was financial inputs consisting from personnel, equipment, occupancy and other general expenses and the second inputs have been created as environmental inputs which are consisted from income level, population density and economy. Whereas outputs were term deposits, SLOC, personal loans, small business loan non-term deposit, and mortgage. Finally when they used the method of Fuzzy they had a chance to compare cross region banks for China banking sector.
Dr. Avkiran (1996) measured efficiency gains by using method of data envelopment analysis (DEA) for his paper since 1986 until the year of 1995 for Australian Trading Banks. And he used two models while measuring inputs and outputs. When we look up the DEA for model A inputs were consisted from interest expenses and non-interest expenses and the other DEA model B they consisted from
15
deposits and staff numbers. In DEA model A outputs were net interest income and non-interest income and DEA model B outputs were consisted from net loans and non-interest income. Finally he tried to make Australian banks more adaptable by using these methods. He concluded that acquiring banks were more efficient in the Australian banking sector over the period which is studied.
Beccalli, Casu, and Girardone (2006) investigated stock prices and efficiency of European banking over the 1990s and they employed non-parametric frontier based data envelopment analysis (DEA). However, in their paper inputs are consisted from average cost of labor which includes personnel expenses /total assets, deposits (interest expenses / customer and short term funding) and capital (total capital expenses / total fixed asset) whereas the outputs are consisted from traditional lending activity of banks (total loans), and the growing non-lending activities (other earning assets). Finally they concluded that the level of the banks’ shares extremely influences the bank efficiency.
Pasiouras (2006) observed efficiency of Greek commercial banks during the period from 2000 to 2004 that used Data Envelopment Analysis (DEA), Stochastic Frontier Analysis (SFA), Thick Frontier Approach (TFA), Distribution Free Approach (DFA) and Decision Making Unit (DMU) for his paper as methodological process. In this study inputs were production loans and deposits account services, using labor and capital, employee expenses, non-interest expense and loan loss provision whereas number of type of accounts, net interest income, net commission income and other income are showed as outputs. However he concluded that size of the capitalization and numbers of branches affected efficiency of the Greek banks positively. He measured that number of ATM’s did not affect efficiency of Greek commercial banks extremely.
Shanmuhan and Das (2004) investigated banking efficiency of Indian commercial banks since 1992 until 1999. And they employed Stochastic Frontier Approach (SFA) based data envelopment analysis (DEA) for the panel data. Deposits (D), borrowings (B), labor (L) and fixed assets (A) accepted as inputs whereas investments, advances and deposits and also net interest margin, non-interest income, credit and investments are accepted as outputs for the paper. They suggested that
16
efficiency improvement has extremely affected for the Indian banks especially private banks locating in India.
Drake and Hall (2003) measured Japanese banking efficiency in 1990-1991. This paper has been employed by non-parametric frontier approach based data envelopment analysis and stochastic frontier approach (SFA). Inputs were consisted from general and administrative expenses, fixed assets (premises and equipment), retail and whole sale deposits whereas total loans and bills discounted, liquid assets and other investments in securities and other income were indicated as outputs. Aim of this paper is that to observe the behavior of Japanese banks while facing economic problems. The authors tried to solve these economic problems and increase the efficiency of Japanese banks during the period.
Sathye (2001) investigated efficiency of Australian banks for the year of 1996, employed non-parametric method of data envelopment analysis (DEA), distribution free approaches (DFA) and applied ANOVA Test for the methodology of this paper. In this paper inputs were labor, capital and loanable funds whereas some of outputs were loan and demand deposits. On the other hand the author who concluded that efficiency of the Australian banks was under the efficiency standards in the world’s banks, tried to increase the efficiency of banks locating in Australia.
Sathye (2003) studied efficiency of banks in developing countries like India during the period between 1997 and 1998 and employed non-parametric approach based data envelopment analysis (DEA). In this paper interest expenses and non-interest expenses, deposits and staff numbers have been chosen as inputs whereas interest income, non-interest income and net loans have been chosen as output. The author divided the method into two sections. According to model A it is indicated that Indian public banks were more efficient than the both of private and foreign banks whereas in model B it is indicated that Indian commercial banks have less efficient than the foreign banks but public banks still kept their efficiency at the greater level than the private banks.
Havrylchyk (2001) compared domestic and foreign Polish banking industry according to their efficiency level during the period of 1989 to 2001. In this paper the researcher utilized data envelopment analysis (DEA) as methodology and inputs
17
were consisted from labor which included (number of employees), and fixed assets and deposits whereas loans and treasury bonds were defined as outputs. The researcher concluded that foreign banks were more efficient than the domestic banks because foreign banks could cope with the bad loans and risky portfolio because of their international network. This is why foreign banks are successful than the domestic banks in the Polish banking industry.
Pastor, Perez and Quesada (1995) investigated international comparison of the United States and European banking sector according to their efficiency, productivity and the level of using technology efficiently for the year of 1992. They employed non-parametric approach and data envelopment analysis (DEA) based Malmquist analysis as the methodology. In their paper inputs were consisted from non-interest expenses and other personnel expenses whereas the outputs were accepted as demands, savings, time deposits and loan. They said that some of European countries banks were more productive for example Australia, Italy, Belgium and Germany. Whereas other countries’ banks like United States, United Kingdom, France and Spain were found as having less productivity. In addition to this subject, Spain and France were found as the best-users of efficiency banking system but using less technology whereas the other countries like Australia and Germany were found less efficient but they used the technology very actively.
Chen, Skully and Brown (2005) investigated banking efficiency which includes technical process and cost for the Chinese banking sector for 1993 to 2000. They employed the methodology as data envelopment analysis (DEA), decision making unit (DMU), constant return to scale (CRS), and variables return to scale (VRS) for their paper. Inputs were given as interest expenses, non-interest expenses (price of labor), and price of deposits (interest paid on deposits divided by deposits), and the price of capital (non-interest expenses divided by fixed assets) whereas outputs were accepted as loans, deposits and non-interest income. Finally they concluded that Chinese banks have increased their banking efficiency from 1990s until 1996 therefore from 1997 to 2000s Chinese banks have ceased to increase their efficiency because of the influences of the Asian Crises.
Sharkas, Hassan and Lawrence (2008) studied the banks locating in the United States according to their profit and cost efficiency and how mergers would be
18
affected for the given period from 1981 to 1989. They employed non-parametric approach based data envelopment analysis (DEA) for their paper. Studied inputs were physical and financial equity capitals whereas outputs were consumer loans, business loans, real estate loans and securities. They suggested that mergers were successful for the both small and large US Banks and the study indicated that US banks increased their profit efficiencies by the mergers over the period. The study made comparison between merged and non-merged United States banks. The answer indicated that the merged US banks had got more technical, technological and productivity advantages than the non-merged ones according the applied data envelopment analysis (DEA).
Kasman and Yildirim (2006) investigated cost and profit efficiencies of the eight central and Eastern European Union countries’ banks which joined to form EU as the new members over the period from 1995 to 2002. Also, in their research they used the methodology as Stochastic Frontier Approach (SFA) based Data Envelopment Analysis (DEA). Borrowed funds, labor, total deposits and capital have accepted as inputs whereas total loans, total deposits and other earning assets like investment securities were showed as inputs in their paper. To sum up, according to analysis they concluded that foreign banks were more successful than the domestic European banks therefore foreign banks’ cost were much more expensive than the domestic ones during the period.
Ozkan-Gunay and Tektas (2006) analyzed efficiency effect of non-public banks for the Turkish banking sector during the pre-crises and crises periods for 2000 and 2001 because of the big crisis in these years. On the other hand, they employed data envelopment analysis (DEA) as the methodology. Inputs were consisted from personnel expenses, administrative expenses and interest expenses whereas outputs were total deposits, total loans, total securities, total interest income, and total non-interest income. They concluded that foreign banks had better performance than the domestic banks before the crises therefore foreign banks were not as successful as domestic banks in loans and securities. They have preferred low risk and high transaction cost instead of domestic banks preferring high risk in Turkish banking sector in the studied period.
19
Saha and Ravisankar (2000) measured efficiencies of Indian commercial banks over the period from 1992 to 1995 by using data envelopment analysis (DEA) in their paper. Branch (number of branches), staff (number of employees), establishment expenditure and non-establishment expenditure (excluding interest expenditure) were chosen as inputs however deposits, advances, investments, spread, total income, interest income, non-interest income and working funds were chosen as the outputs by the authors. The results showed that Indian public banks have increased their efficiency but some of Indian banks stayed at the same efficiency level during the period.
Ausina, Tatje, Armero and Conesa (2002) observed efficiency and measured productivity of Spanish saving banks for 1992 – 1998, employed decision making unit (DMU) and data envelopment analysis (DEA) based malmquist analysis. In their paper inputs were consisted from labor and capital which included total labor expenses and physical capital and purchased funds, all deposits category whereas outputs were consisted from loans, transaction deposits and non-interest income. Lastly they concluded that production improvement depends on the capacity of the production and also the authors measured that efficiency was constant for Spanish saving banks for the studied period.
Yildirim and Philippatos (2002) measured cost and production efficiencies for the Central and Eastern Europe countries and their banks during the period started from 1993 until 2000 by using diverse methodologies like thick frontier approach (TFA), stochastic frontier approach (SFA) and distribution free approach (DFA) which all based on data envelopment analysis (DEA). They used the inputs as borrowed funds, labor and physical capital; the outputs as loans which included sum of loans, all accounts and investments including sum of total securities, equity investment, other investments and produced deposit like sum of demand, saving and time deposits. The results indicated that some of European countries as Poland and Slovenia were the most cost-efficient countries whereas Russia, Lithuania, Latvia and Estonia were found as least cost-efficient ones. Moreover they indicated that higher efficiency banks were belonging to large capitalized countries.
20
Mokhtar, Abdullah and Habshi (2006) investigated efficiency of Islamic banking sector in Malaysia over the period started from 1997 until 2003 who employed stochastic frontier approach (SFA) and data envelopment analysis (DEA). They used total deposits like deposits from customers and other banks, total overhead expenses like personnel and other operating expenses as inputs; total earning assets financing, dealing securities, investment securities and placements with other banks were determined as outputs. Besides the authors concluded that Malaysia Islamic banking industry grew faster and faster according to measured assets, deposits and financial transactions during the studied period. The authors believed that Malaysia banking sector would be competitive with the rest of the world banks’ in the future.
Guzmán and Reverte (2008) measured efficiency and productivity change of shareholders value for Spanish banking industry for 2000 until 2004. They utilized both parametric and non-parametric approaches and data envelopment analysis (DEA) based malmquist index. In their paper inputs were consisted from total deposits, interest expenses, commissions paid, personnel and administration expenses whereas total loans, interest incomes and commissions were accepted as outputs. The authors concluded that Spanish banks were very efficient and they had high shareholders’ value.
Haslema, Scheraga, and Bedingfield (1999) measured efficiencies for United States banking industry according to inputs and outputs since 1987 until 1992. They employed data envelopment analysis (DEA), decision making unit (DMU), constant return to scale (CRS) and variable return to scale (VRS). The authors investigated inputs/outputs for measuring the data where cash, labor expense, real capital, materials expense and total borrowed funds have been chosen as inputs whereas domestic loans, foreign loans, total investments and non-interest bearing deposits have been chosen as outputs in the paper. After the study researchers concluded that some of the United States banks were inefficient according to their inputs/outputs which analyzed.
21
Conceicao, Portela and Thanassoulis (2005) investigated efficiency of transactional cost and account sale transactions effects on the bank branches, observed the effects of alternative channels as ATMs and online banking sector on the banking industry. They used da envelopment analysis. The studied inputs were number of staff as resources of bank branches and rent like environmental conditions whereas number of clients, value current accounts, other resources, value title deposits, value credit by bank, value credit by associates, and number of transactions have been chosen as output in the paper. Besides the authors investigated Portugal banks three dimensionally as operational, cost and transactional and the aim of the paper is that to measure the comparative efficiency of the Portugal bank branches.
Kirkwood and Nahm (2003) investigated efficiency of Australian banking industry and also they measured stock return of the Australian banks over the period started from 1995 to 2002. They employed data envelopment analysis (DEA) based malmquist productivity indexes (MPI). In their paper inputs were consisted from labor which includes number of full-time equivalent employees, physical capital as book value of premises and fixed assets as net of depreciation and loanable funds as time deposits, savings deposits and other borrowed funds whereas in their paper outputs were consisted from loans and demand deposits. They suggested that major banks which were powerful in terms of economy, have improved their cost and profit efficiency but regional Australian banks kept the cost and profit efficiencies at the constant level.
Bauer, Berger,Ferrier and Humphrey (1998) estimated the United States bank efficiency by using data envelopment analysis (DEA), stochastic frontier approach (SFA), thick frontier approach (TFA), and distribution-free approach (DFA) over the period started from 1977 until 1988. In their paper inputs were given as labor, physical capital, small denomination time, and saving deposits, purchased funds and financial equity capital. Outputs were accepted as demand deposits, real estate loans, commercial and industrial loans, installment loans and off-balance sheet activities. However the authors who tried to measure the efficiency of the United States banks by using DEA, SFA, TFA and DFA, they found different answers after inserting data to all of these methodologies.
22
Das, Ray and Nag (2005) measured efficiency of labor for some of small Indian individual banks and bigger Indian public banks which had more branches over the period from 2002 until 2003. They used data envelopment analysis as the methodology. In the study inputs were numbers of different categories of employees which included officers, clerks, and support staff like security and janitorial employees whereas outputs were examined as values of deposits and credit. The result of the research was Indian banks are extremely inefficient and it’s better to merge with other bank branches if possible.
Sufian (2009) investigated Malaysian banking industry during the Asian financial crises in the year of 1997. The author employed non-parametric frontier based data envelopment analysis (DEA) as the methodological process. Inputs were consisted from number of employees, labor and physical capital whereas the outputs were number of accounts or related transactions, savers and borrowers, deposits, total loans and securities. The researcher suggested that foreign banks in Malaysia were more efficient and these banks had more advantages than the domestic ones during the Asian crises period.
Ertuğrul (2013) investigated credit effect on efficiency growth for Halk Bank by using parametric and non-parametric frontier based data envelopment analysis (DEA) from 2002 until 2012. In her paper inputs used were total deposits, personnel expenses and physical capitals whereas outputs were values of deposits and values of credits. The author concluded that growth of credit has been affected positively for Halk Bank during the studied period.
23
CHAPTER 3
DATA and METHODOLOGY
In this chapter we describe the methodology and the data we use in the study. We follow Dogan and Fausten (2003) closely to describe the methodology. We start by defining and explaining the Malmquist index, and then we move on to explaining how the efficiency indexes and the distance functions that are necessary for all the indexes are calculated.
3.1 Productivity Malmquist Index
The Malmquist index is the annual (geometric) mean of the parameters of two productivity indexes which use functions of output distances for the alternative base periods t and (t+1) as presented by the D-superscripts in the following formula : Formula 1:
The first parameter is related to the combinations of input-output parameters which are observed in two time intervals (t) and (t+1) to the period t shows technology frontier, and the second one is related to same input-output combinations to the same period as (t+1) technology frontier. The terms in the numerator calculated from inputs used and outputs gained by firmi in period t+1, whereas the ones in the denominator calculated from the corresponding quantities for period t. To avoid biasing the results, the geometric (annual) average of the two indexes are used. Malmquist index enables us to understand differences between efficiency changes and productivity changes :
Formula 2:
24
The first term indicates the change in technical efficiency and the equation in square brackets indicates technological change . For Malmquist index the values which are greater than 1 (M>1) represent an improvement in productivity and the ones less than one indicate decrease (M<1). It does not mean that the three indexes always follow the same direction. For example, and increase in productivity quality is absolutely appropriate for opposite movements in technical efficiency or technology, observed the decrease in one parameter is more than offset by an improvement in the other one to gain a value of M greater than 1. To illustrate, suppose that efficiency decreases by 30% such that =0.7 and technology improves by% 150 such that =2.5 then the result M is equal to 0.7*2.5=1.75 as a result the productivity increases by %75.
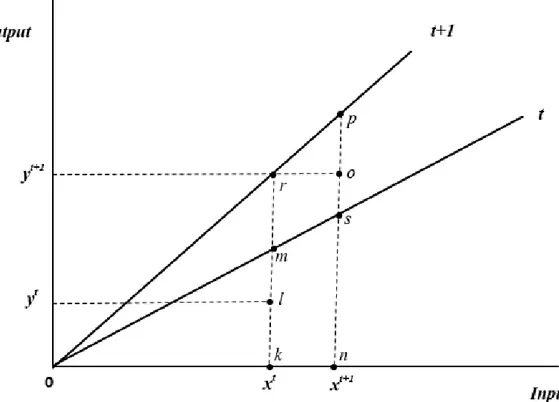
The rays from the origin in Figure 4.1 indicate estimated production frontiers for periodst and t+1 as could be understood from the illustration. Factor productivity determines the slopes of those rays which are constant in CRS case, in the graph.
25
Assume that in period t bank i works at point l, utilizing amount of inputs in order to gain amount of output and that it works at the point o in period t+1, utilizing inputs in order to gain amount of output.
Now let us describe the output distance functions that are present in Malmquist index by relevant presented in Figure 4.1
Distances Functions:
Technical efficiency in period t relative to frontier t: Technical efficiency in period t relative to frontier t + 1:
Technical efficiency in period t + 1 relative to frontier t + 1:
Technical efficiency in period t + 1 relative to frontier t:
Efficiency Indexes:
The change in technical efficiency could be described geometrically (annually) as indicated in following equation
Formula 3:
And the change in technology can be presented by the formula 4 as: Formula 4:
26
The change in productivity , as investigated by Malmquist index, is then formulated by: Formula 5: 3.2 Scale Efficiency
Given the implications that bank size is not of importance for productivity within the constant return to scale (CRS) scenario, the investigations of efficiency in banking should allow, in principle at the least the existence of VRS (variable returns to scale).
When computing the scale efficiency index it’s required to calculate two additional functions referring to the production frontier generated by variable return to scale (VRS) technology. and being the distance functions, identify the position of individual banks relative to the maximum optimal output obtained with VRS technology. The Malmquist index can be decomposed further by manipulating algebraic in order to explicitly capture the contribution of scale to productivity.
27
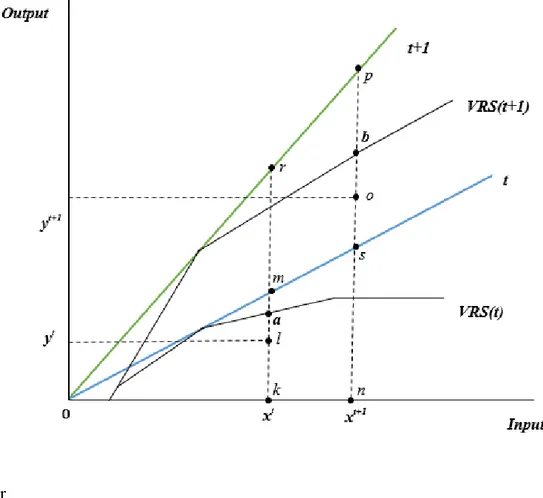
Figure 3.2. Variable return to scale (VRS) Constant return to scale (CRS) production
functions
Or
is the index measure of change in pure technical efficiency. captures the effect of scale economies in terms of the distance between the optimal outputs which can be obtained from actual factor use at times (t) and (t+1) under CRS and VRS. being the last term is the measure of the change in technology.
Figure 4.2 depicts both VRS and CRS production function. Production occurs at point l in time period t and at point o in time period (t+1). The corresponding efficiency indexes and distance functions with respect to either technology are represented as follows:
28
Distance Functions:
The output distance functions developed for constant return to scale (CRS) must be augmented by two distance functions in order to capture the scale affect, in the presence of variables return to scale (VRS).
Technical efficiency in period t relative to the variables return to scale (VRS) frontier in t:
Technical efficiency in period t+1 relative to the variables return to scale (VRS) frontier in t+1: Efficiency Indexes:
29
3.3 Data Envelopment Analysis (DEA) and the Calculation of the Distance Functions:
The output distance functions constituting the Malmquist Index can be derived by data envelopment analysis (DEA) or estimated econometrically. DEA is a non-parametric technique which does not require the use of any specific structure of the production technology Data Envelopment Analysis (DEA) is a non-parametric technique of linear programming.
Where banks producing outputs, at each time period These outputs are produced with the use of inputs.
Let and note input and output vectors, respectively, of bank
Constant return to scale (CRS) output distance functions for bank k can be examined as: Subject to:
t being the time index and λbeing the column vector of the intensity variables ).
By including as an additional constraint to the above problem, the output distance functions required for constructing the VRS frontier can be calculated. The distance functions for all banks in the sample have to be calculated separately for each period (t and t+1). The solving of mixed period linear
30
programming problems is required when computing the remaining distance functions. See (Coelli T., 1998) for more details.
3.4 Data
There were 24 commercial banks operating continuously over the period of 2003 to 2012 (see Appendix A for the list of banks included in the study). We include state-owned deposit, privately-owned banks, and foreign banks in the study, and exclude foreign banks that have only a branch in Turkey. The data were obtained from the annual reports of individual banks available on the Banks Association of Turkey web site.
We construct three additional samples to check for the sensitivity of our results to ownership differences. As mentioned above, our full sample have all (24) continuously operating commercial banks. We have 21 privately-owned banks and foreign banks in the second sample. Only 11 privately owned banks are included in the third sample. The last sample consists of 10 foreign banks only.
Sample size considered in some of the studies in literature are comparable to the one used here. For instance, Jakson, Fethi and Inal (1998) investigated 38 commercial banks over the period from 1992 to 1996. Rezitis (2006) observes 6 individual banks and 4 of banks were state banks and 2 of banks were privately-owned bank during the period 1982-1997 in Greece. Kilic (2011) was examined 23 banks between 2002 and 2009 in Turkey. Chen, Skully and Brown (2005) investigated 43 Chinese banks over the period from 1993 to 2000. Pastor, Perez and Quesada (1995) investigated non-consolidated banks for their study as 168 in the United States, 45 in Austria, 59 in Spain, 22 in Germany, 18 in United Kingdom, 31 in Italy, 17 in Belgium and 67 in France. And finally Hartman, Storbeck and Byners (2001) examine 50 saving bank branches in Sweden during the period from 1994 to 1995.
There are two main approaches to, and no agreement on the selection of inputs and outputs in the literature. In the production approach number of transactions as taken as outputs and labor and capital as inputs. In the intermediation approach banks are seen mainly as intermediaries between supplier of funds (savers) and users of funds. Hence, cost of funds (interest expense) and income from
31
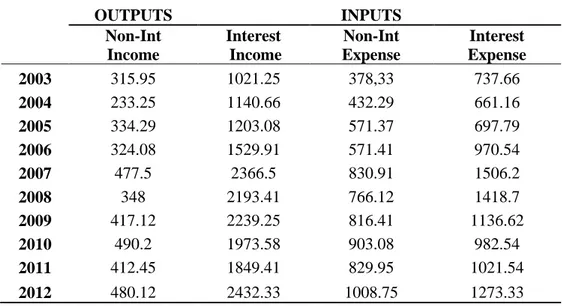
converting those funds into loans (interest income) are taken to be the main input and the output, respectively (Dogan&Fausten, 2003). We follow the intermediation approach both because of data limitations and also because its use is more common in the literature.
In addition to interest expense and interest income we use non-interest expense (input) non-interest income (output). Non-interest income equals the sum of net fees and commissions, dividend income, net trading income, profit / loss from held to maturity, other operating income. Non-interest expense is the sum of other operating expense and personnel expense. The mean values of outputs and inputs are shown in Table 4.1.
Table 3.1: Mean Values of Inputs and Outputs (in Millions of US Dollars)
OUTPUTS INPUTS Non-Int Income Interest Income Non-Int Expense Interest Expense 2003 315.95 1021.25 378,33 737.66 2004 233.25 1140.66 432.29 661.16 2005 334.29 1203.08 571.37 697.79 2006 324.08 1529.91 571.41 970.54 2007 477.5 2366.5 830.91 1506.2 2008 348 2193.41 766.12 1418.7 2009 417.12 2239.25 816.41 1136.62 2010 490.2 1973.58 903.08 982.54 2011 412.45 1849.41 829.95 1021.54 2012 480.12 2432.33 1008.75 1273.33