23
http://journals.tubitak.gov.tr/veterinary/ © TÜBİTAK
doi:10.3906/vet-1805-10
Phylogenetic relationships of native Turkish cattle breeds using microsatellite markers
Yusuf ÖZŞENSOY1, Ercan KURAR2,*, Müge DOĞAN3, Zafer BULUT3,
Mehmet NİZAMLIOĞLU3, Vahdettin ALTUNOK3, Ayşe IŞIK4, Aysun ÇAMLIDAĞ4
1Department of Veterinary Biometrics and Genetics, Faculty of Veterinary Medicine, Cumhuriyet University, Sivas, Turkey 2Department of Medical Biology, Meram Faculty of Medicine, Necmettin Erbakan University, Konya, Turkey
3Department of Biochemistry, Faculty of Veterinary Medicine, Selçuk University, Konya, Turkey 4Eastern Mediterranean Agricultural Research Institute, Ministry of Agriculture and Forestry, Adana, Turkey
* Correspondence: [email protected]
1. Introduction
In order to determine the origin of breed domestications, genetic characterization and archaeological studies have been carried out. The migration routes of European breeds were reported to be two different paths from North to Central Europe along the coast of the Danube and the Mediterranean coast. In addition, cattle, sheep, goats, pigs, and buffalo were first domesticated in two different regions, including Southwest Asia and East Asia (1). The oldest of these centers contains the eastern and southeastern Anatolian regions. Previous archeological and molecular findings indicate that most animal breeds originated and spread from these regions to the rest of the world, especially from Anatolia to Europe (2–6). In particular, the main routes of cattle coming into Europe were determined to stem from the eastern region (7). Because of their closeness to this domestication center and their being relatives of the first cattle domesticates, Anatolian native breeds should be given priority as a genetic resource stock (1).
Genetic diversity studies can be performed on native breeds of a country and breeds of different countries or,
more broadly, on international breeds (8). The objective of this study was phylogenetic analysis of Turkish cattle breeds by utilizing microsatellites as part of a national level project titled “In Vitro Conservation and Preliminary Molecular Identification of Some Turkish Domestic Animal Genetic Resources-1 (TÜRKHAYGEN-1).”
2. Materials and methods
A total of 271 blood samples were collected from Anatolian Black (AB, n = 51), Anatolian Grey (AG, n = 54), East Anatolian Red (EAR, n = 45), Native Southern Anatolian Yellow (SAY, n = 51), South Anatolian Red (SAR, n = 51), and Zavot (ZAV, n = 19) cattle. Genomic DNA was isolated using a standard organic method (9).
In the study, 20 microsatellite loci (Table 1) were selected from a list (10) recommended by the Food and Agriculture Organization’s Measurement of Domestic Animal Diversity (FAO–MoDAD) and the International Society of Animal Genetics (ISAG). Based on PCR product sizes and conditions, three different multiplex systems were developed. The PCR profiles and microsatellite genotyping procedures have been previously described
Abstract: A total of 20 microsatellite DNA markers were used for genetic characterization and determination of phylogenetic
relationships of native cattle breeds of Turkey, including the Anatolian Grey (AG), Anatolian Black (AB), South Anatolian Red (SAR), East Anatolian Red (EAR), Southern Anatolian Yellow (SAY), and Zavot (ZAV). DNA samples were isolated from 271 blood samples using an organic method. Amplified polymerase chain reaction products were separated by capillary electrophoresis and genotypes were determined for 20 microsatellites. A total of 269 different alleles were determined. The lowest (7.80) and highest (10.80) mean allele numbers were observed for the ZAV and SAY populations, respectively. TGLA122 was the most polymorphic locus; however, only 7 different alleles were observed for INRA005. A total of 40 different private alleles were determined. The general FIS values were between 0.034 and 0.123. Due to the close location to the domestication center, higher genetic diversities were observed. The observed genetic diversities and the results of the phylogenetic analyses were in agreement with evolutionary history and the geographical origins of Turkish native cattle breeds.
Key words: Cattle, Anatolia, genetic diversity, microsatellite, TÜRKHAYGEN-1
Received: 03.05.2018 Accepted/Published Online: 09.12.2018 Final Version: 12.02.2019
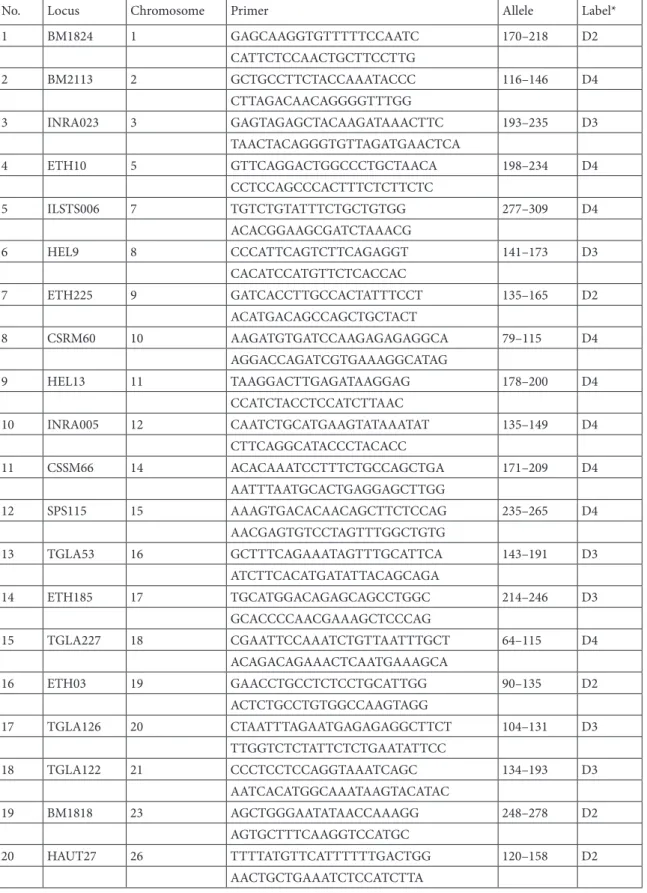
Table 1. Microsatellite loci used in the study.
No. Locus Chromosome Primer Allele Label*
1 BM1824 1 GAGCAAGGTGTTTTTCCAATC 170–218 D2 CATTCTCCAACTGCTTCCTTG 2 BM2113 2 GCTGCCTTCTACCAAATACCC 116–146 D4 CTTAGACAACAGGGGTTTGG 3 INRA023 3 GAGTAGAGCTACAAGATAAACTTC 193–235 D3 TAACTACAGGGTGTTAGATGAACTCA 4 ETH10 5 GTTCAGGACTGGCCCTGCTAACA 198–234 D4 CCTCCAGCCCACTTTCTCTTCTC 5 ILSTS006 7 TGTCTGTATTTCTGCTGTGG 277–309 D4 ACACGGAAGCGATCTAAACG 6 HEL9 8 CCCATTCAGTCTTCAGAGGT 141–173 D3 CACATCCATGTTCTCACCAC 7 ETH225 9 GATCACCTTGCCACTATTTCCT 135–165 D2 ACATGACAGCCAGCTGCTACT 8 CSRM60 10 AAGATGTGATCCAAGAGAGAGGCA 79–115 D4 AGGACCAGATCGTGAAAGGCATAG 9 HEL13 11 TAAGGACTTGAGATAAGGAG 178–200 D4 CCATCTACCTCCATCTTAAC 10 INRA005 12 CAATCTGCATGAAGTATAAATAT 135–149 D4 CTTCAGGCATACCCTACACC 11 CSSM66 14 ACACAAATCCTTTCTGCCAGCTGA 171–209 D4 AATTTAATGCACTGAGGAGCTTGG 12 SPS115 15 AAAGTGACACAACAGCTTCTCCAG 235–265 D4 AACGAGTGTCCTAGTTTGGCTGTG 13 TGLA53 16 GCTTTCAGAAATAGTTTGCATTCA 143–191 D3 ATCTTCACATGATATTACAGCAGA 14 ETH185 17 TGCATGGACAGAGCAGCCTGGC 214–246 D3 GCACCCCAACGAAAGCTCCCAG 15 TGLA227 18 CGAATTCCAAATCTGTTAATTTGCT 64–115 D4 ACAGACAGAAACTCAATGAAAGCA 16 ETH03 19 GAACCTGCCTCTCCTGCATTGG 90–135 D2 ACTCTGCCTGTGGCCAAGTAGG 17 TGLA126 20 CTAATTTAGAATGAGAGAGGCTTCT 104–131 D3 TTGGTCTCTATTCTCTGAATATTCC 18 TGLA122 21 CCCTCCTCCAGGTAAATCAGC 134–193 D3 AATCACATGGCAAATAAGTACATAC 19 BM1818 23 AGCTGGGAATATAACCAAAGG 248–278 D2 AGTGCTTTCAAGGTCCATGC 20 HAUT27 26 TTTTATGTTCATTTTTTGACTGG 120–158 D2 AACTGCTGAAATCTCCATCTTA *WellRED dye labels: D4 = blue; D3 = green; D2 = black.
(11). Capillary electrophoresis was conducted using the FragTest-3 protocol and Beckman Coulter CEQ-8000 genetic analysis system. The FragTest program was used to determine alleles.
General population parameters including allele numbers and Wright’s F-statistics were calculated using GenAlEx6 (12). The GENETIX 4.05 program (http://www. genetix.univ-montp2.fr/genetix/genetix.htm) was used for factorial correspondence analysis (FCA). Population matrices of genetic distances were calculated according to Nei (13), using the Population 1.2.32 program (http://www. bioinformatics.org/project/?group_id=84). TreeView (14) was used to draw a phylogenetic tree using the neighbor-joining (NJ) method and Nei’s DA genetic distances. For analysis of the population structure, 7 independent runs of K (K = 1–7) were conducted for the genotype dataset using an admixture model. All model runs were based on 100,000 Markov chain Monte Carlo (MCMC) iterations and on 50,000 after an initial burn-in period.
Five independent runs were performed for each K-value using the Structure 2.3.4 http://pritch.bsd.uchicago.edu/ structure_software/releas.
Ethical approval was issued by the Selçuk University Faculty of Veterinary Medicine Ethics Committee (19.11.2007, #2007/063).
3. Results
General population genetics analyses (Table 2) showed that 269 different alleles were determined, and the mean allele number was 13.45. The minimum (7 alleles) and maximum (26 alleles) numbers of total alleles were determined for INRA005 and TGLA122, respectively. A total of 40 private alleles were detected. The maximum numbers of private alleles (10 alleles) were observed in the SAY population.
General FIS values were calculated for the SAR (0.063), AB (0.063), AG (0.123), SAY (0.061), EAR (0.034), and
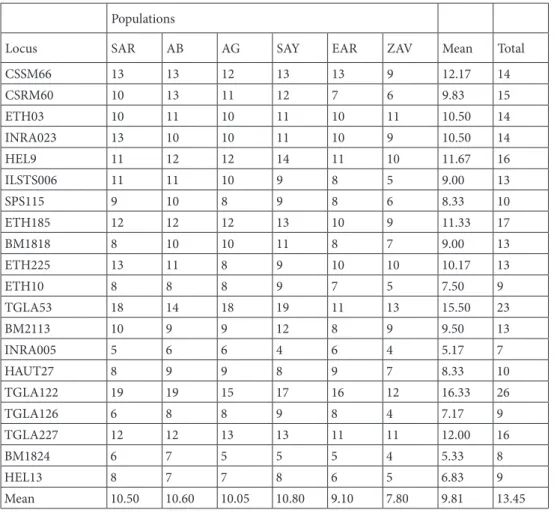
Table 2. Mean and total number of alleles of six Turkish cattle breeds.
Populations
Locus SAR AB AG SAY EAR ZAV Mean Total
CSSM66 13 13 12 13 13 9 12.17 14 CSRM60 10 13 11 12 7 6 9.83 15 ETH03 10 11 10 11 10 11 10.50 14 INRA023 13 10 10 11 10 9 10.50 14 HEL9 11 12 12 14 11 10 11.67 16 ILSTS006 11 11 10 9 8 5 9.00 13 SPS115 9 10 8 9 8 6 8.33 10 ETH185 12 12 12 13 10 9 11.33 17 BM1818 8 10 10 11 8 7 9.00 13 ETH225 13 11 8 9 10 10 10.17 13 ETH10 8 8 8 9 7 5 7.50 9 TGLA53 18 14 18 19 11 13 15.50 23 BM2113 10 9 9 12 8 9 9.50 13 INRA005 5 6 6 4 6 4 5.17 7 HAUT27 8 9 9 8 9 7 8.33 10 TGLA122 19 19 15 17 16 12 16.33 26 TGLA126 6 8 8 9 8 4 7.17 9 TGLA227 12 12 13 13 11 11 12.00 16 BM1824 6 7 5 5 5 4 5.33 8 HEL13 8 7 7 8 6 5 6.83 9 Mean 10.50 10.60 10.05 10.80 9.10 7.80 9.81 13.45
SAR: South Anatolian Red; SAY: Native Southern Anatolian Yellow; AB: Anatolian Black; AG: Anatolian Grey; EAR: East Anatolian Red; ZAV: Zavot.
ZAV (0.035) populations. The general FIS value was determined to be 0.068 for all populations. According to the assignment test results, of 271 animals, 147 (54.24%) were assigned to their own population in a 99% confidence interval.
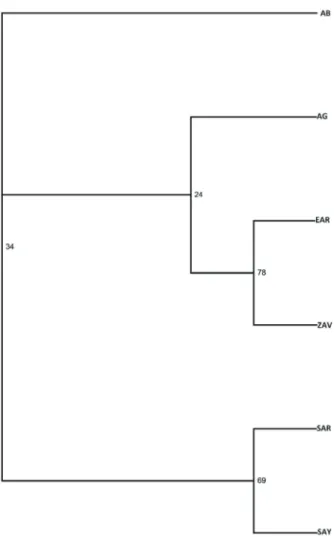
Table 3 shows the population matrix of Nei’s genetic distances. The highest genetic distance (0.210) was observed between ZAV and AG. However, the lowest genetic distance (0.070) was determined between SAR and SAY. The phylogenetic tree is given in Figure 1. Grouping possibilities for populations were found as ~70% for SAR and SAY and for ZAV and EAR; however, other populations had lower possibilities. Similar to the geographical locations of these populations, EAR to ZAV and SAY to SAR groupings were determined within the same cluster. Although the AG population was determined to be near the EAR to ZAV cluster, the AB population was determined to be in a completely different position from the other populations.
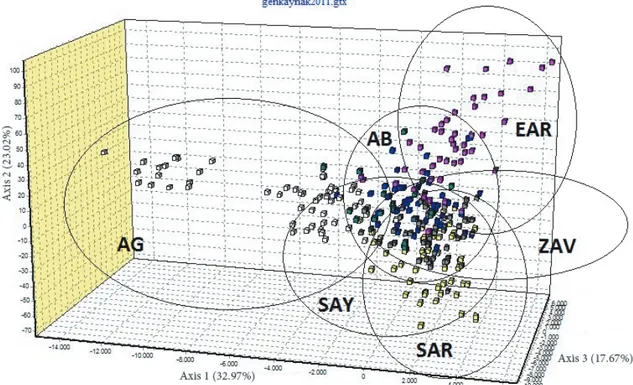
According to FCA analysis, the AB population was observed as having formed two different subgroups that were completely separate from all other populations. SAR and SAY populations were intermixed with each other, and AB was observed to be very close to these populations. ZAV and AG populations were separated from each other and from all other groups (Figure 2). Structure analysis is given in Figure 3, and the results were found to be compatible with FCA and NJ results.
4. Discussion
The observed average allele number was similar to other studies in which Turkish native cattle breeds were used (2,6,15,16). A total of 102 (16) and 1582 (15) different alleles were observed in previous studies using the same 4 cattle breeds, including SAR, EAR, AB, and AG. The higher allele numbers found in Altınalan’s study (15) can be explained by the number (26) of microsatellite loci used and the genotyping method. Relatively lower allele
Table 3. Population matrix of Nei’s genetic distance.
Populations SAR AB AG SAY EAR ZAV
SAR 0.000 0.100 0.177 0.070 0.115 0.141 AB 0.000 0.151 0.073 0.082 0.143 AG 0.000 0.163 0.187 0.210 SAY 0.000 0.107 0.158 EAR 0.000 0.163 ZAV 0.000
SAR: South Anatolian Red; SAY: Native Southern Anatolian Yellow; AB: Anatolian Black; AG: Anatolian Grey; EAR: East Anatolian Red; ZAV: Zavot.
Figure 1. Neighbor-joining tree summarizing the phylogenetic
relationships of Turkish cattle breeds. SAR: South Anatolian Red; SAY: Native Southern Anatolian Yellow; AB: Anatolian Black; AG: Anatolian Grey; EAR: East Anatolian Red; ZAV: Zavot.
numbers were reported by Özkan (16), and these findings might be due to a limited number (7) of microsatellite loci. In this study, total (269) and average allele numbers (13.45) were found to be higher than in Europe (17–24), the United States (25), Asia (26,27), Africa, and India (28,29) and in consortium (2,18,30) studies.
The observed highest allele number in the TGLA122 locus has also been reported in previous studies (16,17,19,24,26,27,31,32). In addition, the lowest allele number in the INRA005 locus was also determined in other research (21,26,29,31,32).
Breeds with lower genetic diversities were found to have lower heterozygosities (23,26,27). The expected and observed heterozygosity values of Turkish native cattle
breeds were previously reported elsewhere (11) and were found to be higher than values found in previous studies (2,17–22,27–30). Compared with several other previous studies (21,24), higher FIS values were also observed in this study.
Loftus et al. (2) used and reported the NJ method for the SAR, AB, EAR, and AG breeds. In this study, (2) the EAR and AB breeds were found to be focused toward each other, whereas SAR and AG were separated in a different radiation. According to another study conducted on the native cattle breeds of Turkey (16), AG and AB were found to be close to each other, while the SAR population was especially separated from AB and also other populations. However, the SAY and AB
Figure 2. Factorial correspondence analysis (FCA) of Turkish native cattle breeds. SAR: South Anatolian Red; SAY:
Native Southern Anatolian Yellow; AB: Anatolian Black; AG: Anatolian Grey; EAR: East Anatolian Red; ZAV: Zavot.
populations were expected to be close to each other in terms of their geographical localization. Özkan (16) reported that SAR–AB–AG were localized as separate locations, and EAR was reported to be mixed with these populations. These findings are similar to the NJ results of this study. In another study (15), AB and SAR populations were clustered into a single group, whereas AG and EAR populations were separated and found in another group. The findings related to the NJ results in this study were compatible with respective regions where these populations are reared.
FCA indicated that Turkish native cattle breeds were generally located close to each other with no differentiation. It is obvious that animals in the AG group were separated into 2 different subgroups. It was not surprising that the group close to the other breeds was sampled from the genetic conservation herd and the other subgroup was from village herds. A typical steppe cattle, AG is believed to have been brought from Thrace. AG is also a common cattle breed of the Balkans because similar animals are also raised in Bulgaria, Greece, and Romania (33). Bayesian assignment proportions for K = 4 clusters were determined in the structure analysis. In general, the cattle were unified in their own clusters.
Populations were observed to be separated from each other from the east towards the west of Turkey, which is similar to a study using Y-chromosome specific markers (34). Similarly, relations with other Asian (31) and European (17,20,23,35) cattle breeds were found to be compatible with the geographical and historical developments of these breeds. SNP analysis from an international consortium study (36) also included the 5 cattle breeds used in this study. These cattle breeds were reported to be intermixed with several different cattle breeds and cannot be considered as part of the Taurine cattle population. The ZAV population specifically was
reported to be close to the Holstein breed, and it has been stated that Anatolian cattle breeds were not close to the same domestication area. The lower sample number (8 samples only) may be the main reason for this conclusion. We believe that the sampling strategy in the present study, which includes genetically unrelated animals from different herds, reflects the natural genetic structure of these cattle breeds.
In conclusion, according to results from the phylogenetic tree and from the FCA graphics and structure test, EAR to ZAV and AB to AG populations were determined to have different genetic structures. However, the SAY population was found to be a distinct breed. Also, SAY had a similar genetic structure to and was intermixed with SAR in geographically close regions.
Genetic diversities of the wild ancestors of breeds located in the first domestication area were previously reported to be higher (8). In this study, the average number of alleles was found to be decreasing from east to west, and higher diversity levels were observed compared to cattle breeds of other countries. These results can be explained by the fact that Anatolia is close to the initial domestication center. The findings of genetic diversities and phylogenetic analyses indicate that the Turkish native cattle breeds analyzed here are consistent with their modern geographical locations.
Acknowledgments
This work and the research of Yusuf Özşensoy are supported by the Scientific and Technological Research Council of Turkey, (TÜBITAK-KAMAG, #106G114) and by the Selçuk University Scientific Research Projects Coordination Unit (SÜBAP, #08202009). This manuscript is part of the PhD dissertation of Yusuf Özşensoy. This paper was presented at the XXXII International Society of Animal Genetics Conference in Edinburgh, UK. References
1. Bruford MW, Bradley DG, Luikart G. DNA markers reveal the
complexity of livestock domestication. Nat Rev Genet 2003; 4: 900-910.
2. Loftus RT, Ertuğrul O, Harba MH, El-Barody AA, MacHugh
DE, Park SDE, Bradly DG. A microsatellite survey of cattle from a centre of origin: the Near East. Mol Ecol 1999; 8: 2015-2022.
3. Luikart G, Gielly L, Excoffier L, Vigne JD, Bouvet J, Taberlet P.
Multiple maternal origins and weak phylogeographic structure in domestic goats. P Natl Acad Sci USA 2001; 98: 5927-5932.
4. Troy CS, MacHugh DE, Bailey JF, Magee DA, Loftus RT,
Cunningham P, Chamberlain AT, Sykes BC, Bradley DG. Genetic evidence for Near-Eastern origins of European cattle. Nature 2001; 410: 1088-1091.
5. Hiendleder S, Kaupe B, Wassmuth R, Janke A. Molecular
analysis of wild and domestic sheep questions current nomenclature and provides evidence for domestication from two different subspecies. P Roy Soc B-Biol Sci 2002; 269: 893-904.
6. Cymbron T, Freeman AR, Isabel Malheiro M, Vigne JD,
Bradley DG. Microsatellite diversity suggests different histories for Mediterranean and Northern European cattle populations. P Roy Soc B-Biol Sci 2005; 272: 1837-1843.
7. Negrini R, Nijman IJ, Milanesi E, Moazami-Goudarzi K,
Williams JL, Erhardt G, Dunner S, Rodellar C, Valentini A, Bradley DG et al. European Cattle Genetic Diversity Consortium. Differentiation of European cattle by AFLP fingerprinting. Anim Genet 2007; 38: 60-66.
8. Felius M, Theunissen B, Lenstra JA. Conservation of cattle genetic resources: the role of breeds. J Agr Sci 2014; 153: 152-162.
9. Sambrook J, Fritsch EF, Maniatis T. Molecular Cloning: A
Laboratory Manual. 2nd ed. Cold Spring Harbor, NY, USA: Cold Spring Harbor Laboratory Press; 1989.
10. Hoffmann I, Marsan PA, Barker JSF, Cothran EG, Hanotte O, Lenstra JA, Milan D, Weigend S, Simianer H. New MoDAD marker sets to be used in diversity studies for the major farm animal species: recommendations of a joint ISAG/FAO working group. In: Proceedings of the 29th International Society of Animal Genetics Congress. Tokyo, Japan: ISAG; 2004.
11. Özşensoy Y, Kurar E, Doğan M, Bulut Z, Nizamlıoğlu M, Işık A, Çamlıdağ A, Altunok V. Genetic characterization of Turkish cattle breeds by microsatellite markers: usefulness for parentage testing. Kafkas Univ Vet Fak 2014; 20: 521-526.
12. Peakall R, Smouse PE. GENALEX 6: Genetic analysis in Excel. Population genetic software for teaching and research. Mol Ecol 2006; 6: 288-295.
13. Nei M. Genetic distance between populations. Am Nat 1972; 106: 283-292.
14. Page RDM. TreeView: An application to display phylogenetic trees on personal computers. Comput Appl Biosci 1996; 12: 357-358.
15. Altınalan A. Türkiye’deki yerli sığır ırklarının mikrosatellit DNA markırlarla genetik karakterizasyonu. PhD, Çukurova University, Adana, Turkey, 2005 (in Turkish).
16. Özkan E. Türkiye’de yetiştirilen yerli ve kültür sığır ırklarının genetik yapılarının mikrosatelitler ile incelenmesi. PhD. Trakya University, Tekirdağ, Turkey, 2005 (in Turkish).
17. Martin-Burriel I, García-Muro E, Zaragoza P. Genetic diversity analysis of six Spanish native cattle breeds using microsatellites. Anim Genet 1999; 30: 177-182.
18. Edwards CJ, Dolf G, Looft C, Loftus RT, Bradley DG. Relationships between the endangered Pustertaler–Sprinzen and three related European cattle breeds as analysed with 20 microsatellite loci. Anim Genet 2000; 31: 329-332.
19. Maudet C, Luikart G, Taberlet P. Genetic diversity and assignment tests among seven French cattle breeds based on microsatellite DNA analysis. J Anim Sci 2002; 80: 942-950.
20. Beja-Pereira A, Alexandrino P, Bessa I, Carretero Y, Dunner S, Ferrand N, Jordana J, Laloe D, Moazami-Goudarzi K, Sanchez A et al. Genetic characterization of Southwestern European bovine breeds: a historical and biogeographical reassessment with a set of 16 microsatellites. J Hered 2003; 94: 243-250.
21. Chikhi L, Goossens B. Treanor A, Bruford MW. Population genetic structure of and inbreeding in an insular cattle breed, the Jersey, and its implications for genetic resource management. Heredity 2004; 92: 396-401.
22. Tapio I, Värv S, Bennewitz J, Maleviciute J, Fimland E, Grislis Z, Meuwissen TH, Miceikiene I, Olsaker I, Viinalass H et al. Prioritization for conservation of Northern European cattle breeds based on analysis of microsatellite data. Conserv Biol 2006; 20: 1768-1779.
23. Martin-Burriel I, Rodellar C, Lenstra JA, Sanz A, Cons C, Osta R, Reta M, De Argüello S, Sanz A, Zaragoza P. Genetic diversity and relationships of endangered Spanish cattle breeds. J Hered 2007; 98: 687-691.
24. Dalvit C, De Marchi M, Dal Zotto R, Zanetti E, Meuwissen T, Cassandro M. Genetic characterization of the Burlina cattle breed using microsatellites markers. J Anim Breed Genet 2008; 125: 137-144.
25. Hansen C, Shrestha JNB, Parker RJ, Crow GH, McAlpine PJ, Derr JN. Genetic diversity among Canadienne, Brown Swiss, Holstein, and Jersey cattle of Canada based on 15 bovine microsatellite markers. Genome 2002; 45: 897-904.
26. Kim KS, Yeo JS, Choi CB. Genetic diversity of North-East Asian cattle based on microsatellite data. Anim Genet 2002; 33: 201-204.
27. Mao Y, Chang H, Yang Z, Zhang L, Xu M, Chang G, Sun W, Song G, Ji D. The analysis of genetic diversity and differentiation of six Chinese cattle populations using microsatellite markers. J Genet Genomics 2008; 35: 25-32.
28. Ibeagha-Awemu EM, Jann OC, Weimann C, Erhardt G. Genetic diversity, introgression and relationships among West/ Central African cattle breeds. Genet Sel Evol 2004; 36: 673-690. 29. Pandey AK, Sharma R, Singh Y, Prakash BB, Ahlawat SP.
Genetic diversity studies of Kherigarh cattle based on microsatellite markers. J Genet 2006; 85: 117-122.
30. MacHugh DE, Shriver MD, Loftus RT, Cunningham P, Bradley DG. Microsatellite DNA variation and the evolution, domestication and phylogeography of taurine and zebu cattle (Bos taurus and Bos indicus). Genetics 1997; 146: 1071-1086. 31. Zhou GL, Jin HG, Zhu Q, Guo SL, Wu YH. Genetic
diversity analysis of five cattle breeds native to China using microsatellites. J Genet 2005; 84: 77-80.
32. Zhang GX, Wang ZG, Chen WS, Wu CX, Han X, Chang H, Zan LS, Li RL, Wang JH, Song WT et al. Genetic diversity and population structure of indigenous yellow cattle breeds of China using 30 microsatellite markers. Anim Genet 2007; 38: 550-559.
33. Alpan O, Aksoy AR. Sığır Yetiştiriciliği ve Besiciliği. 6th ed. İstanbul, Turkey: Milsan Basın San A.Ş.; 2012 (in Turkish). 34. Özşensoy Y, Kurar E, Bulut Z, Nizamlıoğlu M. Y-chromosome
analysis of native Turkish cattle breeds by microsatellite markers. Turk J Biol 2014; 38: 388-395.
35. Kantanen J, Olsaker I, Holm LE, Lien S, Vilkki J, Brusgaard K, Eythorsdottir E, Danell B, Adalsteinsson S. Genetic diversity and population structure of 20 North European cattle breeds. J Hered 2000; 91: 446-457.
36. Decker JE, McKay SD, Rolf MM, Kim JW, Alcala AM, Sonstegard TS, Hanotte O, Götherström A, Seabury CM, Praharani L et al. Worldwide patterns of ancestry, divergence, and admixture in domesticated cattle. PLOS Genet 2014; 10: e1004254.