MONITORING THE LONG TERM URBAN EXPANSION OF ZANJAN CITY USING REMOTE SENSING AND GEOGRAPHIC INFORMATION SYSTEMS
1Mehri RAHIMI, 2Farhad HOSSEINALI
1,2ShahidRajaee Teacher Training University, Faculty of Civil Engineering, Department of Surveying Engineering, 16785- 163,Lavizan, Tehran, Iran
1[email protected], 2[email protected]
(Geliş/Received: 08.11.2018; Kabul/Accepted in Revised Form: 21.12.2018)
ABSTRACT: The growing phenomenon of urbanization, especially in developing countries, has led to the enlargement of urban areas. Due to the complex structure of cities, changes in the boundaries of a city, whether horizontally or vertically, affects the ecosystem and the quality of life of the corresponding communities. It is also important for the urban planners from the perspective of sustain able development to identify land use/cover changes. The purpose of this paper is to study and evaluate the spatiotemporal expansion of Zanjan city in five time periods. In this research, aerial photographs of 1973, 1982, 1998 as well as satellite images of 200 8 and 2016 of the Zanjan city were used. After data preparation in GIS environment, each produced map was classified into two classes of built and not built. Two spatial distribution indexes (PD and CONTAG) as well as land surface and class level measurements were used to determine the characteristics of urban physical development in Zanjan. The results revealed that during the assessed time period, the city has become more sprawled, discontinuous, and in terms of variety of land uses has become more diversified. These results warn that if the urban expansion continues with the existing trend, historical contiguity and compactness of Zanjan city will loss in the near future. This trend may cause several problems.
Key Words: GIS, Remote Sensing, Urban Expansion, Zanjan
Uzaktan Algılama ve Coğrafi Bilgi Sistemleri Kullanarak Zanjan Şehrinin Genişlemesinin Uzun Dönemli Takibi
ÖZ: Kuruluşundan bu yana, Coğrafi Bilgi Sistemi (CBS) sivil sektörün birçok alanında yaygın olarak kullanılmaktadır. Ancak, bu teknik, olağanüstü teknik yetenekleri ile askeri alanda hala yetersiz bir şekilde uygulanmaktadır. Bu nedenle, makale askeri amaçlar için bir CBS yaratmanın gerekliliği ve yararına işaret etmektedir.
Askeri amaçlar için bir CBS oluştururken, ana bloğunu, yani, özel haritalar, uzay gemilerinde evrensel olarak kullanılan uzay fotoğraf belgeleri gibi ek materyalleri içeren bir topografik veritabanı (TDB) zenginleştirmelidir. Askeri CBS'de "Özel Harita Tabanı" adı verilen ek bir fonksiyonel birim oluşturmayı önerir. Bu makalede, önerilen bloğun yapısı, içeriği ve işlevi ayrıntılı olarak açıklanmaktadır.
Anahtar Kelimeler: CBS, Uzaktan Algılama, Kentsel Genişleme, Zanjan
INTRODUCTION
The increasing urban population and the urbanization process, which are the most important aspects of global change, have played a major role in the history of human civilization in term of land-use change (Deka et al., 2010). The second half of the 21st century will be accompanied by a population density of developing countries, and according to studies, in 2020, are expected that cities be host two
thirds of the world's population, that a large share of these changes will occur in developing countries (Garau et al., 2005). Uncontrolled growth and development of the population and residential areas in the city will lead to uncontrolled horizontal growth. Urban(sprawl). The sprawl phenomenon (urban creep) causes serious problems such as scarcity of food, creating the illegal settlements, environmental pollutions, environmental degradation, occupation of fertile farmland, forest degradation, reduction of surface water, unsustainable expansion and a lot of changes in the spatial structure of cities, tendency towards the suburban landslide and irreversible changes in land cover (Alsharif and Pradhan, 2014). The importance of preventing and addressing the above problems of has been caused that geographers and urban planners studied seriously about urban expansion. Awareness of the form of space and the shape of the city is one of the factors influencing in the success rate of city planners and executives and helps to improve urban environments (HojatSheikhi et al., 2012).
For example, Deng et al. (2008), Ebrahimzadeh (2009) and Bagheri and NedaeeTousi (2017) have investigated the urban sprawl phenomenon. They concluded that Urban Sprawl, as an unplanned, unrestricted and scattered unplanned physical expansion to suburban areas, is one of the global challenges in spatial development planning in recent years. It is easy to defined urban sprawl as a quantity the urbanized area and the extent of the dispersion of that area; therefore, in the horizontal expansion are increased the urban areas, the, which are usually non-interchangeable and shows the dispersion of these levels of horizontal dispersion (Jaeger et al., 2010). Due to the large number of measures, the existence of a correlation between some of them based on a large review of scientific resources (Zhang, 2000) and bachelor's knowledge, and according to the appropriateness of the measurements with the aim of studying and paying attention to the correlation between their concept were selected two samples of spill density and continuity of aggregation metrics and distribution of landforms were selected for this study. The purpose of this research is to investigate the spatial distribution of horizontal dispersion in Zanjan by using aerial photos, geographic information system and two examples of landmark form composition and distribution. In this study were used from aerial photographs of three periods of 1973, 1982, and 1998, and satellite images of two periods of 2008 and 2016 to determine the areas constructed in the study area. Finally, we introduced the land use map as input in the software of the fragmentation, and are obtained the results.
BASICS THEORETICAL
In a general view, urban form is a combination of characters associated with land use patterns, urban transportation systems, and urban design. Kevin Andrew Lynch considers the urban form as a widespread, permanent, and sustainable spatial pattern of physical elements in the city, form is the result of a relatively slow recruitment of urban elements (Lynch, 1984); therefore, urban form is the result of the convergence of the formation of many urban concepts and elements. The dominant shapes of urban form in Iranian cities are radial, checkered, linear, organic, and hybrid (Azimi et al., 2013). In another classification, urban forms are divided into four dispersed, Scattered, Compressed, Border and Edge groups based on Persman's views in 1985 and Monirie in 1992 (Burton et al., 2013), which are presented as follows:
Scattered City
Continuous development of suburbs with low population density, housing construction and job creation and further infrastructure investments in road transport. This kind of development more has been seen in Australian cities.
Increased population and concentration in internal groups of urban suburban along with investment in public transportation.
Border City
Population growth, condominium construction and job creation in selected city areas; increased investment in orbital highways with the goal of linking between marginalized cities.
The city of Corridor: concentrated growth along the lines of the reinforced line from the central business district and supported
by the public transport infrastructure.
Edge City: Extra Growth Mainly on the Edge of the City
In another classification, the city forms divide into two main groups, which are: (1) dense and urban compression; and (2) urban distribution and expansion (Burton et al., 2003). Issues related to sustainable urban development will enhance the consistency of views on the transformation and modernization of the modern city, and resulted to the sustainability of new ideas in urban planning, among which ideas that emphasize on urban densification and its use in urban regeneration is the intensive city idea and it try to provide more sustainability with the evolution of the elements of the city's physical form. In the form of a compact city has been emphasized on the growth of existing urban centers and redeveloped land and in the same time on away from marginalization. The second form of the city pattern, which is completely opposite to the shape of the compact, is the widespread form. This pattern, which in the past few decades was first created in developed countries due to the high use of private and suburban cars, especially in Australia, the United States and Canada, is now seen in many urban cores in developing countries. Urban horizontal distribution is a term that entered to the Urban Research Literature in the last half century and in “sprawl “format, now, is the focus of most urban seminars in developing countries. The history of the use of this term dates back to the middle of the twentieth century when the expansion of urban spaces flourished in the United States as a result of the excessive use of personal vehicles and the development of highway systems (Hess, et al., 2001). A spiral or horizontal distribution is a term that means the rapid and scattered growth of the metropolitan areas, and even small towns, which in some cases are drawn up to rural areas. Urban sprawl in most developing countries illustrates the perspectives of poverty, deformity and illicit patterns of land use, along with the lack of a structure and foundation for public facilities and basic services. This pattern has a clear difference with the United States pattern (Lungo, 2001); therefore, it can be said that the horizontal growth of the city is in total a kind of urban dispersion and an excessive increase in urban land, which reduces population density, increases the share of open and unused spaces, and as a result of urban segregation and separation spatial and ecological selection.
AREA OF STUDY
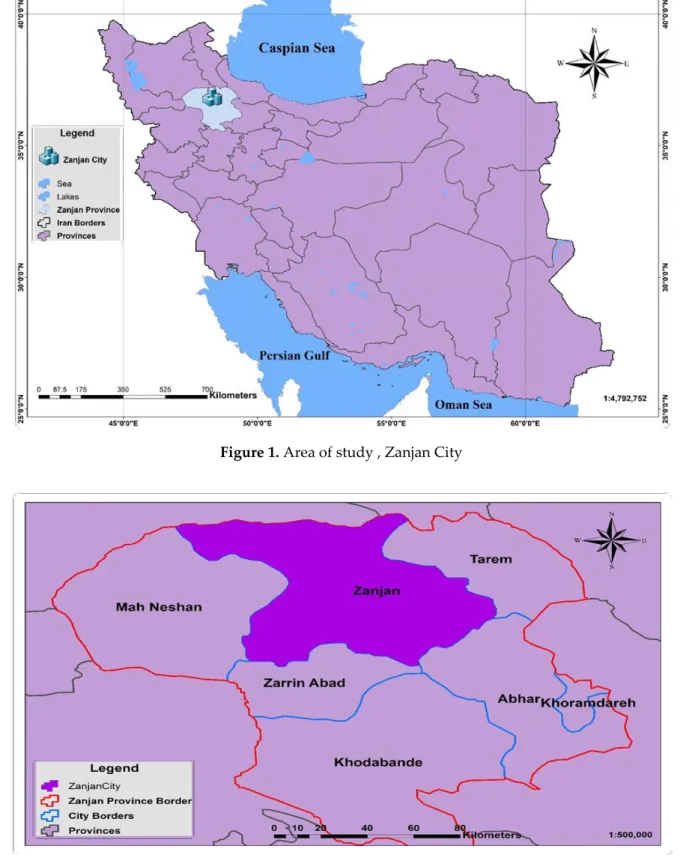
Zanjan city is the capital of Zanjan province, located in the northwest of the country. The geographical location of the city is 48 degrees and 29 minutes’ east longitude and 36 degrees and 40 minutes’ north latitude. The relative positions of Zanjan city in terms of influencing growth and development are: placing on the route of one of the privileged axes of the country according to the route of Tehran-Tabriz-Bazargan, and hence enjoying excellent communication facilities; adjacent with two developed and developed poles of Iran (Tabriz-Tehran) with approximate distance of 300 km.
Figure 1. Area of study , Zanjan City
Figure 2. Zanjan Location in Zanjan Province RESEARCH METHOD
After selecting the realm were prepared the aerial photographs with a resolution of 28 microns with 1: 10000 and 1: 8000 scales belonging to three periods 73, 82 and 98, as well as satellite imagery of 2008 and 2016 IRS single- band satellite with accuracy of 2.5 meters. Initially, data were evaluated in
order to control the quality of the data and to be aware of the atmospheric, geometric and radiometric errors, then were performed the integration process and reference ground for aerial photos based on WGS 84 and the UTM coordinate system. Then the Orto photo was taken on air photos. In the next step, with the help of ArcGIS 10 software, aerial imagery was converted to binary maps that contain two values of zero and one, representing the constructed and unconstructed areas and after providing a land use map and determining the type of usage, the measurements have been calculated by using Software FRAGSTATS 4.2. After adjusting the software parameters for each of the maps separately were calculated, the boundary gauge at the surface of the land and the spatial density measurements at the class level and their results were transmitted to Excel 2016 software. Finally, the plot of the spatial temporal variations of the measurements was mapped and the process of land surface changes was evaluated.
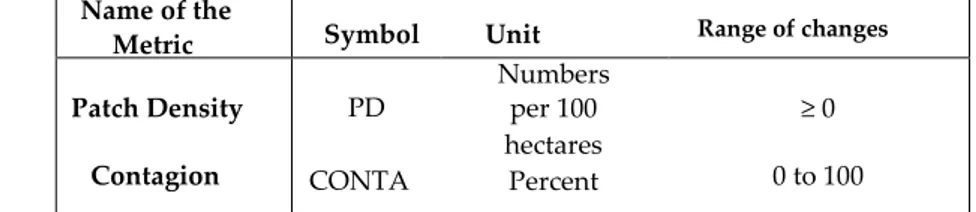
Table 1. Characteristics of the measures used in evaluating land use changes in the studied area
Name of the
Metric Symbol Unit Range of changes
Patch Density Contagion PD CONTA G Numbers per 100 hectares Percent ≥ 0 0 to 100
Patch density: This measurement shows the number of spots in level unit and allows comparison between different areas. This measure is used as an indicator of habitat fragmentation. This measure is equal to the total number of spots per class, divided by the total area of the land plot multiplied by 10,000 100 to 100 hectares (Karami and Feghhi, 2012).
PD = (10000) (100)
(1)
Where ni is the number of spots of the type (class) A. i, the total area of the land.
Continuity: This measure is expressed as a percentage, and is one measure of degree of integration of the spots of the land, as well as the degree of fragmentation of the terrain. When all sorts of spots and patches are completely dispersed on land, this measure will be zero, and when the surface of the land consists of only one type of spell, the conjugation is at its highest. (Yeh and Li, 2001).
(2)
Where eik isThe total length of the margin of class I spots on the land view
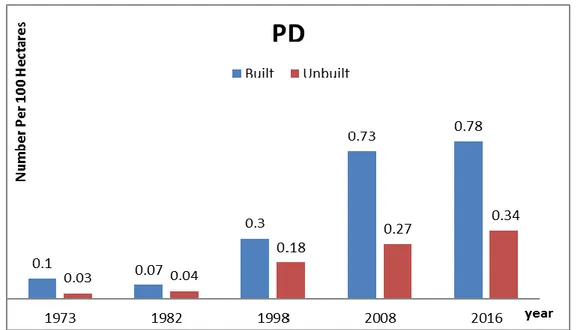
Table 2. The results of calculating terrestrial landmarks at the level of the class for built land and unbuilt land Metric Year PD(unbuil t) PD(built) 1973 1982 1998 2008 2016 0.03 0.04 0.18 0.27 0.34 0.1 0.07 0.3 0.73 0.78
RESEARCH ANALYSE
The results showed that the density of patches in the made land class was increased from 0.1 to 0.7 for this period. This increase reflects the fragmentation of the class of lands and the creation of new human areas during this time period. Also, in the class of non- made lands, the density of patch from 0.03 to 34.0 has increased in the given time frame. This is due to the change in land use not made during this period, and it is confirmed that this is indicative of the fragmentation, the reduction of continuity, the complexity and the more unevenness of the region during the time of the study due to human user competitiveness with these uses. The bulk density analysis in level in Table 2 shows that the expansion of urbanization and the increase in built-in use, the development of activities and user-driven changes caused the non-made land degradation in the same years to decline, and since 1998 there are more differences than in previous years which has caused more fragmentation than other years, which should provide less damage through proper management changes and the proper use of land-view in this area. . Figure 3. Pattern of patch density at the class level during the studied period.
Figure 3. The results of calculation of continuity gauge at land surface level in the study period Table 3. The results of calculating
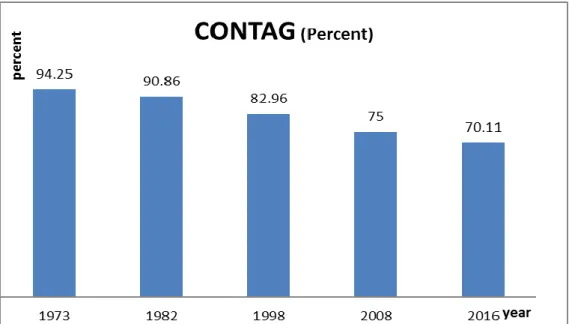
Metric Year CONTAG 1973 1982 1998 2008 2016 94.25 90.86 82.96 75 70.11
The measurement contagion of landform is expressed as percentage. This index is a general criterion of the heterogeneity of terrain and shows the disruption of terrain and in fact represents the extent of destruction in the landform. The results of this study in Figure 4 indicate a decrease of 24% from 94.25 to 70.11 in this area during these years, which in during period from 1982 to 1998 was around 16%, indicating a widespread decline in integration and increased fragmentation in land view.
Figure 4. Land plot continuity chart on the surface of the land plot during the studied period
Figure 5. Disturbance of user continuty in Zanjan between 82 and 98 years RESULTS
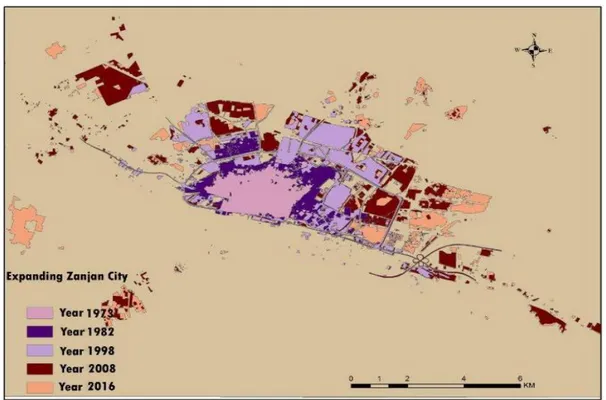
The determination of the use showed that since the 1980s, different uses have been made in the region, and since the 1990s till now it has grown to a large extent inappropriately so that, in line with the increasing population, the built levels have also been expanded to in a way that the shape of the city in the 1970s and 1980s, from the central to linear state of the 90s and the more severe in the 2000s and 2010s, was extended to the eastern and western directions of biodiversity degradation. For example, human use has been expanding, including residential settlements, in a very heterogeneous and inappropriate way in the northern, eastern, and north-eastern parts of Zanjan. Also, by using the land surface and class level measurements, it is stated that, in general, the shape of a fragmented land is
more complex and irregular in terms of the degree of integrity of the structural elements, the more discontinuous, and has become more diversified in terms of the type of coverage available in the level unit.
Figure 6. Extension of the city of Zanjan during the study period REFERENCES
Alsharif, A. A., B. Pradhan, 2014, "Urban Sprawl Analysis of Tripoli Metropolitan City (Libya) using Remote Sensing Data and Multivariate Logistic Regression Model", Journal of the Indian Society of Remote Sensing, Vol. 42(1), pp. 149-163.
Azimi, N., Azadeh S., Roodbzani M. Z., 2013, "Geographic Analysis of Urban Patterns in Iran", Urban Studies (7). [In Persian]
Bagheri, B., NedaeeTousi, S., 2017, An Explanation of Urban Sprawl Phenomenon in Shiraz Metropolitan Area (SMA), Cities,[In persian]
Burton, E., Jenks M., Williams K., 2003, The Compact City: A Sustainable Urban Form, Routledge. Burton, E., Jenks, M., Williams K., 2013, Achieving Sustainable Urban Form, Routledge.
Deka, J., Tripathi O. P., Khan M. L., 2010, "Urban Growth Trend Analysis using Shannon Entropy Approach–A Case Study in North-East India", International Journal of Geomatics and Geosciences, Vol. 2(4), pp. 1072-1078.
Deng, X., Huang, J., Rozelle, S., Uchida, E., 2008, “Growth, Population and Industrialization, and Urban Land Expansion of China”, Journal of Urban Economics, Vol. 63(1), pp. 96-115.
Ebrahimzadeh, R., (2009). "An analysis of Marvdasht's spatial spatial expansion pattern using Shannon and Hellendan entropy models and presenting its desirable future development pattern." Human Geography Research 42 (69):123-138.
Garau, P., Sclar, E., Carolini, G. Y., 2005, A Home in theCity, Earthscan.
Hess, G., Daley, S. S., Dennison, B. K., Lubkin, S. R., McGuinn, R. P., Morin, V. Z., Potter, K. M., Savage, R. E., Shelton W. G., Snow C. M., 2001, "Just What is Sprawl, Anyway", Carolina Planning, Vol. 26(2), pp. 11-26.
HojatSheikhi, T. P., Rezaei, M.R., Sajadi, M., 2012, "Analyzing and Determining the Physical Form of Isfahan City by using the Gary and Moran Model." [InPersian].
Jaeger, J. A., Bertiller, R., Schwick C., Kienast F., 2010, "Suitability Criteria for Measures of Urban Sprawl", Ecological Indicators, Vol. 10(2), pp. 397-406.
Karami A., Feghhi, J., 2012, “Comparison and Comparison of Land use of North and South Zagros Lands with the Land Surface Ecology Approach (Case study: Provinces and KohgiluyehBavar Ahmad), Land Application, Vol. 4 (6), pp. 34-5[In Persian].
Lungo, M. 2001, “Urban Sprawl and Land Regulation inLatin America", Land Lines, Vol. 13(2), pp. 91-113.
Lynch, K., 1984, Good City Form, MIT press.
Yeh, A. G.-O., Li., X. 2001, "Measurement and Monitoring of Urban Sprawl in a Rapidly Growing Region Using Entropy", Photogrammetric Engineering and Remote Sensing, Vol. 67, pp. 83-90.
Zhang, T. 2000, "Land Market Forces and Government's Role in Sprawl: The Case of China." Cities, Vol. 17(2), pp. 123-135.