DETERMINANTS
OF
TURKISH
STUDENT
ACHIEVEMENT
IN
TURKEY
BETAM
WORKING
PAPER
SERIES
#002
MARCH
2009
Determinants of Student Achievement in Turkey
∗
Mehmet Alper Dincer
†and Gokce Uysal
‡March 24, 2009
Abstract
Recent achievement test results show that Turkish students have been performing poorly compared to students from other countries. Using data from the PISA 2006 survey, we aim to measure the determinants of student achievement in Turkey. We find that the program type the student is enrolled in affects student achievement significantly. However, this effect may partially be biased by past academic achievement. In line with the previous literature, our results also indicate that school resources have limited, if any, effect on student achievement. On the other hand, we find that socioeconomic background variables such as parental edu-cation, parental employment, household items, etc. of the student are major determinants of student achievement. Students coming from similar socioeconomic backgrounds enroll in similar schools. To measure possible effects, we use an index of socioeconomic background to calculate an average socioeconomic status within a given school. We find that this has an effect over and above the effects of the individual socioeconomic background factors and program types. Therefore, we conclude that any policy design has to take into account the large role of socioeconomic background in determining student outcomes.
1
Introduction
The relationship between human capital and growth has been extensively studied in the liter-ature. A recent strand of literature concentrates on the effects of education quality on growth
∗This study has been partially funded by ERI of Sabancı University. The views expressed herein are those of the
authors and do not necessarily reflect the views of ERI. We would like to thank M¨ufide C¸ alı¸skan, Ebru Erberber, Seyfettin G¨ursel and Kevin MacDonald for their help. We have also benefited from seminar presentations at ERI. All errors are our own.
†Bahcesehir University, betam ‡Bahcesehir University, betam
Variable Mean Std Dev
Reading 446 92
Mathematics 422 91
Science 423 82
Table 1: Test Scores of Turkish Students
(Hanushek and Kimko (2000), Jamison et al. (2007)). They establish a causal relationship be-tween educational quality and the GDP growth rate. As a measure of educational quality, these papers use international assessments of student achievement.
Programme for International Student Assessment (PISA) is one of the tests that measure student achievement. It is conducted by the OECD every three years. In 2006, there were 57 participating countries. Turkey has been participating since 2003.
PISA aims to measure the achievement of 15 year olds across different countries. It consists of tests on different subjects, namely, reading, mathematical and scientific literacy. Results from PISA 2006 show that the average achievement of 15-year-old students in Turkey is significantly lower than the OECD mean. Table 1 presents the average scores of Turkish students. The population weighted OECD mean is normalized to 500 and the standard deviation is normalized to 100 points in all fields. In all the fields, Turkey is ranked 29th among 30 OECD countries (OECD (2007)). Given the PISA results, the growth path of Turkey seems dismal. Turkey is in dire need for an improvement in its educational quality.
In order to design efficient policies, the determinants of student achievement have to be established. The objective of this paper is to analyze the determinants of student achievement using data from the PISA 2006 survey.
There is a vast literature on the determinants of student achievement. Cameron and Heckman (2001) stress parental education and family income as determinants of academic success and propose to design policies targeting these variables. Additionally, Carneiro and Heckman (2003) suggest that instead of investing in traditional policies such as fellowships and school resources, policies that aim to improve parental background and family income prove to be more successful in reducing inequality.
Recent research by Hanushek and W˝ossman (2006) and Balazsi et al. (2006) highlight that tracking students into differing ability schools increases inequality in achievement and decreases the overall achievement, though less pronounced.
Literature surveys prepared by Hanushek (1986) and Hanushek (1997) point out that, using United States data, they cannot establish a significant relationship between school resources (e.g. student teacher ratio, school facilities, educational level of teachers) and student achievement. W˝ossman (2001), Hanushek (1995) and Hanushek (2006) study this relationship in developing
countries and find similar results. In developing countries, there exists only a weak relationship between school resources and student achievement. W˝ossman (2001) concludes that resources may effect achievement positively at very low resource levels, but their effect is weak to non-existent at higher resource levels.
Previous research using similar data sets in Turkey is mainly descriptive: Berberoˇglu and Kalender (2005) present a descriptive examination of the PISA 2003 results. Using discriminant function analyses, Aypay et al. (2007) concentrate on another international student assessment project, TIMSS (Trends in Mathematics and Science Study), and conclude that socioeconomic status has significant effects on science achievement in Turkey. Lastly, Tansel (2002) also finds that socioeconomic status is one of the major determinants in school enrollment.
This paper provides econometric analyses of the determinants of student achievement in all fields, i.e. reading, mathematical and scientific literacy, using the PISA 2006 data set. Our results are similar. The socioeconomic status of the family has large effects on test scores. Moreover, using an index to measure socioeconomic status, the average socioeconomic status of the school has positive effects on student achievement. This might imply peer effects or better learning environments. These two results imply a strong intergenerational dependency.
We also find that the program type the student is enrolled in has a considerable effect on test scores even though this effect somewhat diminishes when we control for previous academic record, though imperfectly. We conclude that there is a significant positive relationship between tracking and inequality. On the other hand, no link can be established between school resources and student performance. The type of funding the school receives, i.e. public, fees, private, etc. does not have an impact on achievement. Student teacher ratio is the only school resource variable with a significant effect, though very small. Taking all the other variables into account, the regional differences do not seem to affect test scores significantly.
The paper is organized as follows. Section 2 presents a brief summary of the Turkish secondary education system. Section 3 discusses the methodology used, and Section 4 describes the data set. Estimation results are in Section 5. Section 6 concludes.
2
Turkish Secondary Education System
The transition from primary to secondary education is managed by the Ministry of National Education (MONE). Even though the tracking system is modified frequently, there has been a system in effect for more than 50 years. In 2006, when the PISA data was collected, there was a national exam taken at the end of the 8th grade, the Secondary School Selection and Placement Examination (OKS). Students’ OKS performances were the only official measure determining the allocation of students between schools. All students can take the national exam, however,
it is not compulsory. Students can proceed to secondary education without taking the national exam, however, they can only attend schools where the national exam is not a prerequisite for admission.
Most of the secondary education institutions in Turkey are public schools. Private schools form only a very small part of secondary education system in Turkey. According to MONE statistics, only 2.36 percent of students attend private secondary schooling.1 Private schools have independent admission procedures. They may or may not impose academic criteria in student admissions.
In public schools, there are numerous types of secondary education programs: General high schools, vocational high schools, multi-program high schools, Anatolian and vocational Anatolian high schools, super high schools and science high schools. The first three accept all students who apply, the rest requires that the students get a threshold score on the OKS exam.
General high schools are required by law to accept all applicants, unless they have fulfilled their capacities. However, students can only apply to general high schools that are in their neighborhoods. The medium of instruction is Turkish even though English is in the curriculum. Vocational schools operate in the same way as general high schools. There are also multi-program high schools, where there is a general high school as well as a vocational high school on school grounds.
The other types of public owned schools are as follows: In Anatolian high schools, admission is based on OKS exam scores. There is a central allocation system run by MONE. MONE announces a cut-off score for each Anatolian high school for the previous year and students apply accordingly. Once all the students apply, they are allocated across schools centrally by MONE. The medium of instruction is a foreign language (mostly English, but there are also schools where French or German is the medium of instruction). Anatolian vocational schools operate similarly. A hybrid type of program, super high schools, are similar to Anatolian high schools in the sense that they also admit students based on the OKS exam scores. On the other hand, in super high schools, the medium of instruction is Turkish, with more emphasis on foreign languages compared to the general high schools. Science high schools have a curriculum heavily based on natural sciences. The cut-off scores for these schools are usually higher than those of most Anatolian high schools.2
1Our calculations are based on the data at http://www.meb.gov.tr/english/indexeng.htm. Unfortunately PISA
2006 data set does not have a sufficient number of private schools to establish a representative set for Turkey. Hence this study does not include being enrolled in a private school as a determinant of student achievement.
3
Methodology
The target of population of PISA 2006 survey is 15 year-old girls and boys who are currently enrolled. PISA and other international education surveys do not select their samples by simple random sampling since it is a very costly way of executing education surveys. In addition, simple random sampling does not allow establishing a relation between student variables and school variables because a sufficient number of students may not be selected from each class or even school.
In Turkey, MONE focused on building a data set which contains representative samples of different program types and of different regions. Therefore, stratified sampling was conducted when schools were being sampled.3,44942 students from 160 schools and 51 provinces participated in the PISA 2006 application in Turkey.
In education surveys, sampling has two stages. First, schools are drawn from a list which covers the target population. Schools are not drawn by simple random sampling but by being assigned probabilities of selection directly proportional to their sizes. In other words, school size and the probability of that school being chosen are directly proportional. The probabilities also allow the computation of sampling weights that render the schools representative of all the schools in a given country. After the schools are determined, students are drawn by simple random sampling within each school. Therefore, the students that have been randomly chosen within each school, do not constitute a random sample of all the students in that age group. Hence, each student also gets assigned a sampling weight to correct for this bias.
Given the two-stage sampling method used, students in the sample are not a simple random sample, but form clusters in schools. Hence, note that students in one particular school may share some potentially unobservable common factors. If so, there exists a common error term shared by all the students enrolled at a given school. If this common error term is ignored, standard estimators of population parameters will be biased and inconsistent.
PISA recommends the application of the method of balanced repeated replication (BRR) to correct the variance structure of the statistics.5 PISA provides 80 subsamples via providing 80 different sampling weights. Using these weights, estimations are repeated 80 times, providing 80 estimates of each parameter, enabling the construction of a sampling distribution for each estimator.
PISA data set contains five plausible test scores instead of a single test score. This stems from an application of the Item Response Theory, which assumes that each student may answer a different set of questions. Imputing a distribution of test results the student might have got if
3Nevertheless, there are not enough private schools, nor science high schools in the data set to allow for a study
of these types.
4EARGED (2007)
she were to have answered all the questions, PISA provides 5 draws from this distribution. In this study, we use the STATA module developed by Kevin MacDonald which allows us to treat the BRR weights and plausible values correctly. 6
The underlying estimation is a basic OLS regression that handles 5 plausible values as a dependent variable instead of a single one and takes into account the different variance structure. The independent variables are summarized below.
3.1
Student and Family Variables
Given the gender gap in enrollment rates in Turkey, gender may be an important determinant of student achievement. In this age group, 61% of males and only 51% of females are enrolled. One might argue that less successful students are more likely to drop out of the educational system, causing the remaining group to achieve higher test scores. Given that females are more likely to drop out due to socioeconomic and cultural reasons, we would expect a more pronounced self-selection for females. In its turn, this selection bias might overestimate the effects of being female on test results.
PISA provides an index, escs that summarizes the socioeconomic status of the family. It consists of home possessions, parents’ highest occupational and educational status. We choose to incorporate these variables separately in our analysis.7
Instead of using years of schooling for the parents, a dummy variable was created that assigns a value 1 to high school graduates.8 Another dummy variable has been constructed over parent’s employment status. It takes on the value 1 if the parent is employed.
As for the household possessions, the data set contains a group: cell phone, car, dishwasher, computer, books etc. 97 percent of families have at least one cell phone, therefore it is not very informative. Cars and dishwashers are owned by 48 and 47 percent of families, respectively. Keeping in mind that a dishwasher is cheaper than a car, owning a dishwasher may reflect the relative position of women. Therefore, we include a gender-neutral item, a computer as a proxy of socioeconomic status. Additionally, a computer, has the highest correlation with socioeconomic status index developed by PISA.
6This module can be accessed at http://ideas.repec.org/c/boc/bocode/s456951.html and this module is
pub-lished by Boston College in Statistical Software Component Series (http://ideas.repec.org/s/boc/bocode.html).
7It should be noted that in Turkey, father’s education is greater than mother’s education in almost all families,
therefore the correlation between father’s education and highest parental education is very high, i.e. 0,91. A similar argument would hold for parental occupational status as well.
8There are questions regarding parental education both in the student survey and in the parent survey. Since
there are too many missing observations in the parent survey, we use the student survey. Given that a large group of parents are not high school graduates, we create a high school graduate dummy.
3.2
School Variables
We create dummies for different program types, namely, primary schools, general high schools, Anatolian high schools, vocational high schools and multi-program high schools.9
The school administrators reported the number of schools in their school’s proximity excluding their schools. A dummy variable was generated for presence of at least one other school in close proximity. Given that some, but not all, of the students get assigned to high schools via a OKS exam, the physical presence of a school does not necessarily imply access to that school. Therefore, this dummy can only be a proxy.
The school administrators were asked questions regarding conditions for admission. Some administrators claim that past academic achievement or talent is a prerequisite to admission. We assign a value of 1 if it is, zero otherwise. We refer to this variable as “academic selectivity”. A student attending a school that imposes academic achievement as a prerequisite, is more likely to have a stronger academic background than a student in a school that does not.
As for school resources, we use the ratio of computers for instructive purposes to school size as a proxy for school resources. The possibility of a non-linear relationship between student achievement and school resources is also considered. Grade, class size, student teacher ratio, the ratio of female students to school size and whether the school receives public funding or not are other explanatory variables used in the analyses.
3.3
Regional Variables
We categorize geographical units with more than 15,000 population as urban and the rest as rural. We also include regional dummies: Marmara, Aegean, Mediterranean, Black Sea, Central Anatolia, Eastern Anatolia, Southeastern Anatolia.10
We include some provincial variables that may affect student achievement. We use the female labor force participation rate. We also use the ratio of students who took the OKS exam in that year to all students in 8th grade, as well as the average OKS score of each province.
4
Data
The data set comes from the PISA 2006 survey of the OECD. 4942 students in 160 schools have taken tests and completed surveys. The PISA 2006 data set includes test results from all
9Given that there is only one science high school in the data set, we exclude the 35 students who are enrolled
there. The Anatolian vocational schools are treated as Anatolian high schools, so are the super high schools. Remember that the students who want to enroll in these two types of schools have to take the OKS exam as well.
10The data provided by the OECD does not include regional variables for some students. The PISA team in
Subject Mean Std Dev Min Max Gender 0.46 0.5 0 1 Father’s age 43.88 5.04 33 53 Mother’s age 40.71 4.95 33 53 Father’s education 0.38 0.49 0 1 Mother’s education 0.21 0.41 0 1
Father’s employment status 0.86 0.35 0 1
Mother’s employment status 0.15 0.35 0 1
Computer at home 0.39 0.49 0 1
Dishwasher at home 0.46 0.5 0 1
School escs -1.25 0.59 -2.81 0.75
Access to school 0.69 0.46 0 1
Ability grouping 0.39 0.49 0 1
Computers for instructive purposes/school size 0.05 0.04 0 0.28
Class size 34.39 8.88 18 53 Student-teacher ratio 18.78 8.14 1.89 48.33 Percentage of girls 0.43 0.22 0 1 Academic selectivity 0.2 0.4 0 1 Grade 9.57 0.61 7 11 Public funding 0.89 0.31 0 1 OKS ratio 0.76 0.1 0.42 0.94
Provincial mean of OKS scores 252.23 7.97 221.18 263.46 Provincial female labor force participation 0.25 0.09 0.05 0.5
Table 2: Table of Variables
three subjects, information regarding parental background and school resources. Table 2 lists the variables used in the regression analyses. 11
5
Estimation Results
Even though PISA surveys have three subjects, they focus on a specific topic every three years. The 2006 survey concentrates on science literacy. Hence, more precise measurement is expected in this area. The analyses are carried out in all subjects, however, we focus on the results of the
11We augmented the PISA 2006 data with the following variables. For OKS ratio, provincial mean of OKS
scores data has been provided from MONE MONE (a). For provincial female labor force participation data can be reached online via TURKSTAT TURKSTAT (TURKSTAT).
science literacy test given that the results are very similar across different fields.12 Regression coefficients and t-stats are presented in Table 3 below.
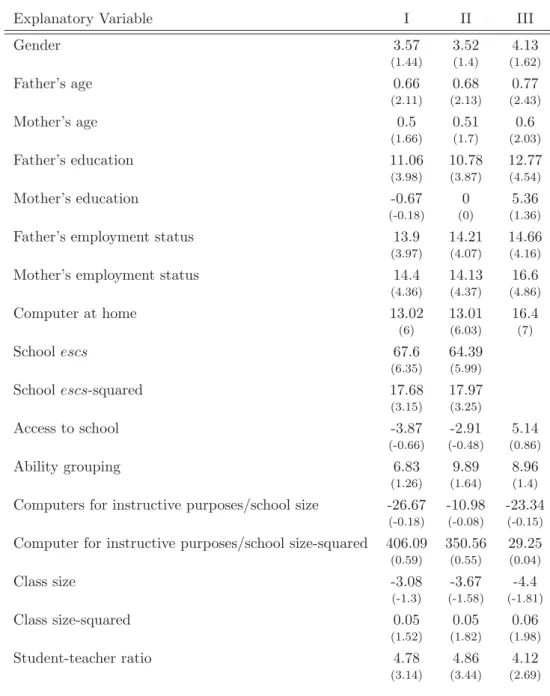
Table 3: Science Literacy Results
Explanatory Variable I II III
Gender 3.57 3.52 4.13 (1.44) (1.4) (1.62) Father’s age 0.66 0.68 0.77 (2.11) (2.13) (2.43) Mother’s age 0.5 0.51 0.6 (1.66) (1.7) (2.03) Father’s education 11.06 10.78 12.77 (3.98) (3.87) (4.54) Mother’s education -0.67 0 5.36 (-0.18) (0) (1.36)
Father’s employment status 13.9 14.21 14.66
(3.97) (4.07) (4.16)
Mother’s employment status 14.4 14.13 16.6
(4.36) (4.37) (4.86) Computer at home 13.02 13.01 16.4 (6) (6.03) (7) School escs 67.6 64.39 (6.35) (5.99) School escs-squared 17.68 17.97 (3.15) (3.25) Access to school -3.87 -2.91 5.14 (-0.66) (-0.48) (0.86) Ability grouping 6.83 9.89 8.96 (1.26) (1.64) (1.4) Computers for instructive purposes/school size -26.67 -10.98 -23.34
(-0.18) (-0.08) (-0.15) Computer for instructive purposes/school size-squared 406.09 350.56 29.25 (0.59) (0.55) (0.04) Class size -3.08 -3.67 -4.4 (-1.3) (-1.58) (-1.81) Class size-squared 0.05 0.05 0.06 (1.52) (1.82) (1.98) Student-teacher ratio 4.78 4.86 4.12 (3.14) (3.44) (2.69)
Table 3: Continued
Explanatory Variable I II III
Student-teacher ratio-squared -0.09 -0.09 -0.08 (-2.83) (-3.23) (-2.58) Percentage of girls 11.25 10.67 8.7 (0.74) (0.73) (0.65) Academic selectivity 32.92 35.06 45.95 (3.7) (3.78) (4.02) Grade -4.1 -3.71 -6.75 (-1.07) (-0.98) (-1.67) Public funding 7.9 8.7 (1.16) (1.16) OKS ratio 39.48 117.22 (0.72) (2.22)
Provincial mean of OKS scores -0.27 -0.25
(-0.41) (-0.35) Provincial female labor force participation 70.3 39.03 (1.12) (0.66)
Primary schools -55.57 -52.79 -52.09
(-2.73) (-2.53) (-3.4)
Anatolian high schools 34.83 33.3 34.76
(2.93) (2.75) (2.36)
Vocational high schools -21.45 -27.08 -40.04
(-2.63) (-3.27) (-4.91) Multi-program high schools -5.53 -11.54 -16.46 (-0.45) (-0.85) (-1.21) Rural -26.89 -33.56 -36.96 (-1.98) (-2.61) (-2.94) Central Anatolia 10.19 12.6 8.85 (1.37) (1.58) (0.97) Aegean 8.79 7.49 11.71 (1.23) (1.02) (1.14) Mediterranean 6.04 4.67 4.57 (0.65) (0.5) (0.45) Black Sea 25.84 11.54 6.5 (3.13) (0.93) (0.55) Eastern Anatolia -16.94 -18.59 -17.29 (-1.2) (-1.06) (-0.87) Southeastern Anatolia -27.86 -11.63 6.07 (-2.3) (-0.62) (0.32)
Table 3: Continued
Explanatory Variable I II III
Constant 425.94 441.33 382.45
(8.41) (2.91) (2.23)
Average R-squared 0.44 0.45 0.42
We consider three different specifications. In Model 1, we include school escs and its square to account for non-linear effects. In Model 2, we include all variables. In Model 3, we exclude schoolescs. Model specification has minor effects on the regression results, i.e. the coefficients seem robust to different specifications.
We find that gender does not significantly affect science literacy results. On the other hand, females perform better in reading and males in math. This is in line with the general results for other participating countries.
The parental background variables have sizeable effects on the test scores. The students whose fathers are at least high school graduates score 12 to 13 points higher, but mother’s education does not have a significant impact on performance. We expect father’s education and parental income to be highly correlated. Families in which the father is more educated will enjoy higher income levels, allocating more resources to children’s education. It could also be that more educated fathers spend more time with their children studying at home. However, in most Turkish families, fathers work (86%) and mothers are housewives (78%) and thus have more time to spend with children. Given that the mother’s education does not have a significant effect on test scores, the first explanation seems to be the more likely one.
Students whose parents are employed, are more successful in science literacy. Mother’s em-ployment increases science literacy score by 14 to 17 points and father’s emem-ployment’s effect is of a similar size. The differences between the effects of mother’s and father’s employment are not statistically significant. Controlling for parental education and employment status, the com-bined effect of mother’s and father’s employment is greater than that of the father’s education. Parents in the labor force might be able to observe the returns of education in the labor market more closely, and hence put more emphasis on education. On the other hand, employment has a direct effect on family income, especially in families where both parents work. Higher income implies that more resources can be allocated to children’s education. Additionally, the number of children tends to be fewer in families where the mother is employed. According to Household Labor Survey 2006, mothers who are in the labor force have 2,04 children and mothers who are out of the labor force have 2,14 children on average. In sum, holding everything else constant, if the mother is working, not only is the family income higher, but also the number of children
Source SS df MS F Prob - F Between school variance of escs 1733 158 10.97 13.26 0.000 Within school variance ofescs 3926 4748 0.83
Total 5658 4906 1.15
Table 4: Within school and between school variances of escs across which the resources are allocated, is fewer.
Students who have a computer at home, perform 14 to 17 points higher. The presence of computer at home is an important measure of both the socioeconomic status of family and the impact of computer technology on education. Note that the effect of having at least one computer at home is as sizeable as the effect of mother’s and father’s employment status.
The regression results imply that academic selectivity is an important factor determining stu-dent achievement. Stustu-dents enrolled in schools which consider academic record as a prerequisite have significantly higher test scores. Clearly, students coming from better academic backgrounds do better in tests.
The fact that the socioeconomic background plays a major role in achievement and that there is a tracking system in place, might mean that students coming from similar backgrounds might enroll in similar schools. We see evidence of this in the data. The calculations of within school and between school variances of parentalescs show that between school variation is considerably larger (Table 4).
To explore the effects, we include school escs in the regressions. We find a strong and significant effect. The square term being positive, we conclude that student achievement is convex in schoolescs. As the school-wide average of the socioeconomic background index increases, so does the student achievement, and this effect is more pronounced at higher levels.
We think that it is a measure of socioeconomic grouping and thus previous academic accumu-lation or unobservable school related factors. In support of this claim, we observe that the effect of academic selectivity is mitigated with the introduction of schoolescs. It could very well be that students from similar socioeconomic backgrounds have similar academic backgrounds and end up in similar schools given the tracking system in place. However, we cannot rule out the possibility that this result may be driven by peer effects or some other unobservable school-related factors such as teacher quality.
Note that schoolescs has an effect over and above the effects of parental background factors and program types. Balazsi et al. (2006) observed that after the introduction of school escs into the regression analyses, the effect of program types has lost its significance. Therefore they conclude that program type does not affect student achievement per se, but can only be taken as a proxy of socioeconomic status. However, this is not the case for Turkey since the effect of
program types do not disappear when we include schoolescs.
We find that the school resources do not have significant effects. The absence of a significant relationship between school resources and student achievement is a common finding (Hanushek, 2006). The only exception is the student teacher ratio, which has a concave effect albeit small.
Note that among school related variables considered, program types have the largest effect on test scores. Remember that the reference group in this category is the general high school. Not surprisingly, those students who are still enrolled in the primary education institutions do much worse than the reference group (52 to 55 points). The students from Anatolian high schools perform better (33 to 35 points), and those from vocational high schools perform worse (21 to 40 points). Nevertheless, previous academic record affects both program types and test scores, hence we would expect our coefficients on program types to be biased upward to the extent that our academic selectivity variable is imperfect.
The ratio of students in this age group who have taken the national entrance exam (OKS) and the average grade on this exam have been included to account for provincial differences that might exist in the educational institutions. We find that they do not significantly affect students’ achievement with one exception.
When school escs and its square is excluded, we find that the higher the ratio of students who take the OKS in a province, the higher the students’ achievement in PISA. More generally, the effects of academic selectivity and program types becomes more pronounced. These findings imply that socioeconomic background is the main driving force behind student achievement. Students from similar backgrounds have similar OKS scores (as much as academic selectivity can proxy for this), hence enroll in similar schools, and do similarly on the PISA tests.
As for other regional variables, students from rural areas have significantly lower test scores (27 to 37 points). The coefficients on other regional variables, such as the region itself and the female labor force participation rate of the province are not significant.
6
Conclusion
Using data from the 2006 PISA surveys, we study the determinants of student achievement, taking into account the presence of five plausible values as outcome variables and the clustered variance structure of the data set. We focus on the science literacy test given that it is the core subject of the 2006 cycle. The exogenous variables considered include socioeconomic variables, such as parents’ education and employment status, household items, school related variables and regional variables.
We find that among all explanatory variables, socioeconomic background of the student’s family and the school-wide average socioeconomic status have large effects on the PISA 2006 test
scores.
Whether the school imposes academic achievement as a prerequisite to admissions and the program type are two other determinants of student achievement. Academic selectivity practiced by schools is a proxy for past academic achievement. We observe that even when we control for it, the effects of program types do not disappear. This implies that the program types have an effect over and above previous academic record. On the other hand, we see that the effects of these variables diminish when we include the school-wide average socioeconomic status of students.
Keeping this in mind, our results suggest that inequality in education reflects inequality in socioeconomic and academic background rather than differences in school resources and across regions. It looks like academic tracking and program types mask the vast effect of socioeco-nomic background on student achievement. The current secondary education system does not seem to counteract a disadvantaged socioeconomic background. Therefore effacing socioeconomic shortcomings is imperative for educational equality and thus social mobility.
We also find that the effects of school resources, regional and provincial differences are very limited, if significant at all. However, we do not have a measure of teacher quality, which may prove to be complementary with school resources or just an important determinant on its own. Moreover, we expect more qualified teachers to work in certain program types such as Anatolian high schools, hence when excluded, teacher quality might cause the effects of program types to be overestimated. In addition, we should also take into account the fact that these students have spent about a year in their current institution, and hence may not have reaped the benefits.
As always, the results are subject to the limitations of data set. Lacking a good measure of inherent ability and precise past academic achievement, we cannot fully control for the effects of these on test scores. Inherent ability and past academic achievement cause an upward bias on the estimated effects. Family structure, especially the number of siblings, can be informative about socioeconomic status and resource devoted to student’s education from household budget. PISA 2006 data set does not contain any variables related to family size or structure. 13 It is important to measure the effect and the direction of such variables on student achievement.
At the date the PISA survey was undertaken, the enrollment rate of the target population was 47 percent in Turkey OECD (2007). The remaining 57 percent is not represented in the PISA sample. In other words, we observe a sample of young people who have chosen to stay in school, thus who do not consist of a random sample of the population. This implies that we overestimate educational outcome in Turkey, and that the situation of the Turkish 15-year old young people are worse than depicted by the PISA 2006 tests.
A
Variables that are not used
i. Language spoken at home: 2.57% of students reported that they speak another language at home. This seems to be too small, since according to the latest estimates the Kurdish minority on its own makes up approximately 13.40% of the population Aˇgırdır (2008). ii. Self-expected occupation at 30: 19% of students did not answer this question.
iii. Income and expenditure for education: 4.25% of parents did not report any income and 4.1% did not report any educational expenditure. Given that the two sets of parents who do not answer each question do not coincide, dropping observations with missing observations significantly contracts the sample size.
iv. Immigration status: 98.43% of students reported that they are not immigrants. Given that 38% of the population do not live in their birthplaces, we conclude that the students who claim to be immigrants come from foreign countries Aˇgırdır (2006).
v. School ownership: There are only three private schools in the sample and OECD (2007) reports that the private schools that are sampled are not representative.
vi. Teacher quality: School questionnaire contains questions to measure the educational level teachers; however none of the schools answered this question. We think that there was a mistake in the Turkish translation of the questionnaire.
vii. Ability grouping: According to the PISA data, 39% of schools apply ability grouping in Turkey and 61% do not. Given that almost all of the schools are public, it can be concluded that this question does not measure what it aims to measure. In Turkey, students are subject to segregation according to their interests during secondary education. Hence school administrators may wrongly assess this segregation as a form of ability grouping.
B
Regression results
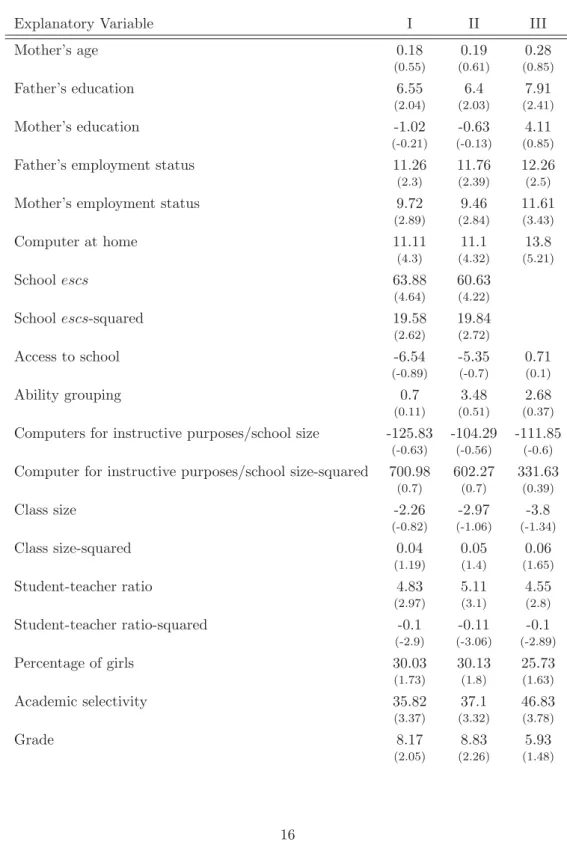
Table 5: Reading Results
Explanatory Variable I II III
Gender 31.53 31.09 31.54
(10.43) (10.34) (10.34)
Father’s age 1.15 1.16 1.23
Table 5: Continued
Explanatory Variable I II III
Mother’s age 0.18 0.19 0.28 (0.55) (0.61) (0.85) Father’s education 6.55 6.4 7.91 (2.04) (2.03) (2.41) Mother’s education -1.02 -0.63 4.11 (-0.21) (-0.13) (0.85)
Father’s employment status 11.26 11.76 12.26
(2.3) (2.39) (2.5)
Mother’s employment status 9.72 9.46 11.61
(2.89) (2.84) (3.43) Computer at home 11.11 11.1 13.8 (4.3) (4.32) (5.21) Schoolescs 63.88 60.63 (4.64) (4.22) Schoolescs-squared 19.58 19.84 (2.62) (2.72) Access to school -6.54 -5.35 0.71 (-0.89) (-0.7) (0.1) Ability grouping 0.7 3.48 2.68 (0.11) (0.51) (0.37) Computers for instructive purposes/school size -125.83 -104.29 -111.85
(-0.63) (-0.56) (-0.6) Computer for instructive purposes/school size-squared 700.98 602.27 331.63
(0.7) (0.7) (0.39) Class size -2.26 -2.97 -3.8 (-0.82) (-1.06) (-1.34) Class size-squared 0.04 0.05 0.06 (1.19) (1.4) (1.65) Student-teacher ratio 4.83 5.11 4.55 (2.97) (3.1) (2.8) Student-teacher ratio-squared -0.1 -0.11 -0.1 (-2.9) (-3.06) (-2.89) Percentage of girls 30.03 30.13 25.73 (1.73) (1.8) (1.63) Academic selectivity 35.82 37.1 46.83 (3.37) (3.32) (3.78) Grade 8.17 8.83 5.93 (2.05) (2.26) (1.48)
Table 5: Continued
Explanatory Variable I II III
Public funding 6.11 7.28
(0.69) (0.8)
OKS ratio 67.99 125.02
(1.06) (2.17)
Provincial mean of OKS scores -0.89 -0.89
(-1.12) (-1.06) Provincial female labor force participation 47.03 24.42 (0.74) (0.37)
Primary schools -92.95 -89.69 -79.37
(-3.93) (-3.76) (-4.42)
Anatolian high schools 34.08 34.37 35.41
(2.86) (2.88) (2.62)
Vocational high schools -25.14 -29.9 -38.93
(-2.67) (-3.02) (-4.42) Multi-program high schools -16.57 -21.82 -22.03 (-1.11) (-1.35) (-1.36) Rural -29.39 -35.93 -37.43 (-1.83) (-2.35) (-2.59) Central Anatolia 8.54 12.73 10.07 (0.98) (1.4) (1) Aegean 17.56 17.43 21.76 (2.17) (2.06) (2.05) Mediterranean -3.47 -3.59 -3.87 (-0.31) (-0.31) (-0.32) Black Sea 17.39 3.97 -0.21 (1.73) (0.25) (-0.01) Eastern Anatolia -19.76 -24.7 -21.91 (-1.08) (-1.1) (-0.92) Southeastern Anatolia -33.38 -23.88 -6.98 (-1.96) (-0.98) (-0.29) Constant 292.9 448.48 414.73 (4.9) (2.32) (2.01) Average R-squared 0.41 0.42 0.40
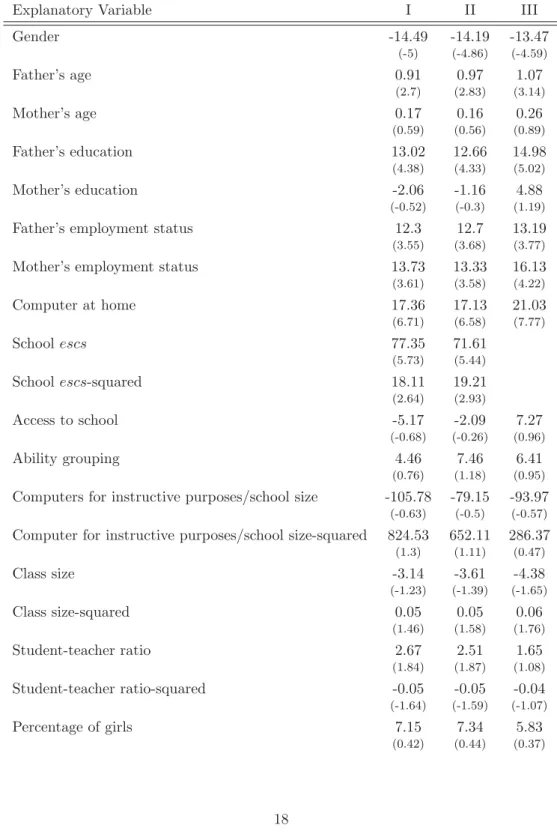
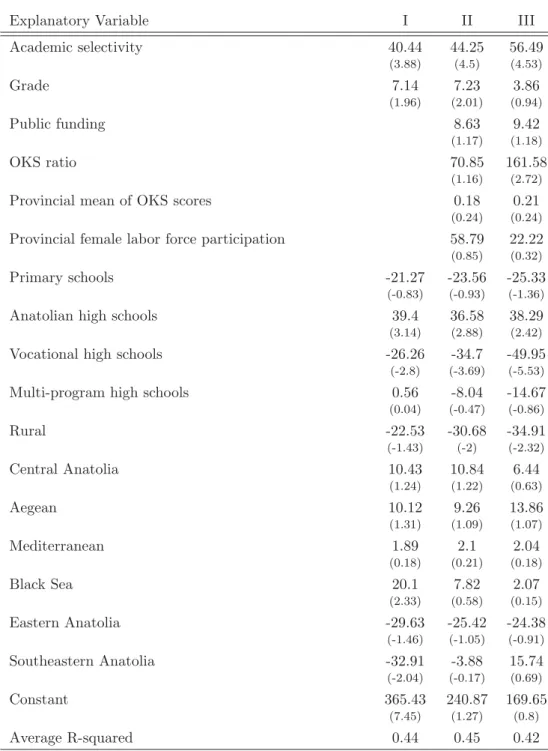
Table 6: Mathematic Literacy Results
Explanatory Variable I II III
Gender -14.49 -14.19 -13.47 (-5) (-4.86) (-4.59) Father’s age 0.91 0.97 1.07 (2.7) (2.83) (3.14) Mother’s age 0.17 0.16 0.26 (0.59) (0.56) (0.89) Father’s education 13.02 12.66 14.98 (4.38) (4.33) (5.02) Mother’s education -2.06 -1.16 4.88 (-0.52) (-0.3) (1.19)
Father’s employment status 12.3 12.7 13.19
(3.55) (3.68) (3.77)
Mother’s employment status 13.73 13.33 16.13
(3.61) (3.58) (4.22) Computer at home 17.36 17.13 21.03 (6.71) (6.58) (7.77) Schoolescs 77.35 71.61 (5.73) (5.44) Schoolescs-squared 18.11 19.21 (2.64) (2.93) Access to school -5.17 -2.09 7.27 (-0.68) (-0.26) (0.96) Ability grouping 4.46 7.46 6.41 (0.76) (1.18) (0.95) Computers for instructive purposes/school size -105.78 -79.15 -93.97
(-0.63) (-0.5) (-0.57) Computer for instructive purposes/school size-squared 824.53 652.11 286.37 (1.3) (1.11) (0.47) Class size -3.14 -3.61 -4.38 (-1.23) (-1.39) (-1.65) Class size-squared 0.05 0.05 0.06 (1.46) (1.58) (1.76) Student-teacher ratio 2.67 2.51 1.65 (1.84) (1.87) (1.08) Student-teacher ratio-squared -0.05 -0.05 -0.04 (-1.64) (-1.59) (-1.07) Percentage of girls 7.15 7.34 5.83 (0.42) (0.44) (0.37)
Table 6: Continued
Explanatory Variable I II III
Academic selectivity 40.44 44.25 56.49 (3.88) (4.5) (4.53) Grade 7.14 7.23 3.86 (1.96) (2.01) (0.94) Public funding 8.63 9.42 (1.17) (1.18) OKS ratio 70.85 161.58 (1.16) (2.72)
Provincial mean of OKS scores 0.18 0.21
(0.24) (0.24) Provincial female labor force participation 58.79 22.22 (0.85) (0.32)
Primary schools -21.27 -23.56 -25.33
(-0.83) (-0.93) (-1.36)
Anatolian high schools 39.4 36.58 38.29
(3.14) (2.88) (2.42)
Vocational high schools -26.26 -34.7 -49.95
(-2.8) (-3.69) (-5.53)
Multi-program high schools 0.56 -8.04 -14.67
(0.04) (-0.47) (-0.86) Rural -22.53 -30.68 -34.91 (-1.43) (-2) (-2.32) Central Anatolia 10.43 10.84 6.44 (1.24) (1.22) (0.63) Aegean 10.12 9.26 13.86 (1.31) (1.09) (1.07) Mediterranean 1.89 2.1 2.04 (0.18) (0.21) (0.18) Black Sea 20.1 7.82 2.07 (2.33) (0.58) (0.15) Eastern Anatolia -29.63 -25.42 -24.38 (-1.46) (-1.05) (-0.91) Southeastern Anatolia -32.91 -3.88 15.74 (-2.04) (-0.17) (0.69) Constant 365.43 240.87 169.65 (7.45) (1.27) (0.8) Average R-squared 0.44 0.45 0.42
References
Al-Samarri, S. (2006). Achieving education for all: How much does money matter? Journal of
International Development 18 (2), 179–206.
Aˇgırdır, B. (2006). Toplumsal Yapı Ara¸stırması. KONDA. http://www.konda.com.tr. Aˇgırdır, B. (2008). Kurtler ve Kurt Sorunu. KONDA. http://www.konda.com.tr.
Aypay, A., M. Erdoˇgan, and M. A. S˝ozer (2007). Variation Among Schools on Classroom Prac-tices in Science Based on TIMSS-1999 in Turkey. Journal of Research in Science
Teach-ing 44 (10), 1417–1435.
Balazsi, I., D. Horn, S. Takacs, and Y. Zhang (2006). Tracking and Inequality of Learning Outcomes in Hungarian Secondary Schools. Perspectives 36 (4), 433–446.
Berberoˇglu, G. and I. Kalender (2005). Oˇgrenci Ba¸sarısının Yıllara, Okul Turlerine, Bolgelere Gore Incelenmesi: OSS ve PISA Analizi. E˜gitim Bilimleri ve Uygulama 22 (4), 21–35.
Borland, M. V., R. M. Howsen, and M. W. Trawick (2005). An Investigation of the Effect of Class Size on Student Academic Achievement. Education Economics 13 (1), 73–83.
Cameron, S. V. and J. J. Heckman (2001). The Dynamics of Educational Attainment for Black, Hispanic, and White Males. Journal of Political Economy 109 (3), 455–499.
Carneiro, P. and J. Heckman (2003). Human Capital Policy. In Inequality in America: What
Role for Human Capital Policies. MIT Press.
EARGED (2005). PISA 2003 Projesi Ulusal Nihai Rapor. Ankara: Milli Egitim Bakanligi. EARGED (2007). PISA 2006 Uluslararası ˝Oˇgrenci De˘gerlendirme Programı - Ulusal ˝On Rapor.
Ankara: Milli Eˇgitim Bakanlıˇgı.
Fertig, M. (2003). Who’s to Blame? The Determinants of German Students’ Achievement in the PISA 2000 Study. IZA Discussion Paper (739).
Glewwe, P. and K. Michael (2006). Schools, Teachers, and Educational Outcomes in Developing Countries. In E. A. Hanushek and F. Welch (Eds.), Handbook of the Economics of Education, pp. 943–1017. North Holland.
Hansen, K. T., J. J. Heckman, and K. K. J. Mullen (2004). The Effect of Schooling and Ability on Achievement Test Scores. Journal of Econometrics 121 (1-2), 39–98.
Hanushek, E. A. (1986). The Economics of Schooling: Production and Efficiency in Public Schools. Journal of Economic Literature 24 (3), 1141–1177.
Hanushek, E. A. (1995). Interpreting Recent Research on Schooling in Developing Countries.
World Bank Research Observer 10 (2), 227–246.
Hanushek, E. A. (1997). Assessing the Effects of School Resources on Student Performance: An Update. Educational Evaluation and Policy Analysis 19 (2), 141–164.
Hanushek, E. A. (2006). School Resources. In E. A. Hanushek and F. Welch (Eds.), Handbook
of the Economics of Education, pp. 865–909. North Holland.
Hanushek, E. A. and D. D. Kimko (2000). Labor-force Quality, and the Growth of Nations. The
American Economic Review 90 (5), 1184–1208.
Hanushek, E. A. and M. E. Raymond (2005). Does School Accountability Lead to Improved Student Performance? Journal of Policy Analysis and Management 24 (2), 297–327.
Hanushek, E. A. and L. W˝ossman (2006). Does Early Tracking Affect Educational Inequal-ity and Performance? Differences-in-Differences Evidence across Countries. Economic
Jour-nal 116 (510), C63–C76.
Jamison, E. A., D. T. Jamison, and E. A. Hanushek (2007). The Effects of Education Quality on Income Growth and Mortality Decline. Economics of Education Review 26, 772–789. Krueger, A. B. and M. Lindhal (2001). Education for Growth: Why and for Whom? Journal of
Economic Literature 34, 1101–1136.
MacDonald, K. (2009, February). Pv: Stata Module to Perform Estimation with Plausible Values. http://ideas.repec.org/c/boc/bocode/s456951.html.
MONE. 2006 OKS Il Puan Sıralamaları. Ministry of National Education. http://oges.meb.gov.tr/arsiv/.
MONE. Education Statistics of Turkey 2005-2006. Ministry of National Education. http://www.meb.gov.tr/english/indexeng.htm.
OECD (2002). PISA 2000. Technical report, France. OECD (2005a). PISA 2003. Technical report, France.
OECD (2007). Science Competiences for Tomorrow’s World: Volume 1: Analysis. France: OECD Publications.
Rivkin, S. G., E. A. Hanushek, and J. F. Kain. (2005). Teachers, Schools, and Academic Achieve-ment. Econometrica 73 (2).
Smits, J. and A. G. Ho¸sg˝or (2006). Effects of Family Background Characteristics on Educational Participation in Turkey. International Journal of Educational Development 26 (5), 545–560. Tansel, A. (2002). Determinants of School Attainment of Boys and Girls in Turkey: Individual,
Household and Community Factors. Economics of Education Review 21, 455–470.
TURKSTAT. Regional Statistics. http://tuikapp.tuik.gov.tr/Bolgesel/sorguGiris.do. W˝ossman, L. (2001). New Evidence on the Missing Resource-Performance Link in Education.