Comparison of Five Survival Models:
Breast Cancer Registry Data from
Ege University Cancer Research Center
AABBSS TTRRAACCTT OObbjjeeccttiivvee:: In this study, we aimed to compare the results of the survival analysis of the patients with breast cancer using Weibull, Gamma, Gompertz, Log-Logistic and Log-Normal para-metric models. MMaatteerriiaall aanndd MMeetthhooddss:: The data obtained from 5457 patients with breast cancer from Ege University Cancer Research Centre between 1992 and 2007 was used in this study. The patients were divided into two groups with respect to their ages, they were divided into two groups as 49 and below and 50 and above. The Log rank test was applied to compare the survival curves of the two age groups obtained by Kaplan Meier method. A survival analysis was conducted by using Weibull, Gamma, Gompertz, Loglogistic and Lognormal distribution of parametric models. RReessuullttss:: Survival curves of two groups were compared by using a log-rank test and no statistical significant difference was found between the two groups. In the analysis of the survival periods using metric models, the age variable is taken as the covariate. To determine the best model among para-metric models, Akaike Information Criteria (AIC) was exploited. The results of the study revealed that the survival model found by the Gompertz distribution was the most appropriate one. CCoonn--cclluussiioonn:: By using AIC, the models obtained via Weibull, Loglogistic, Lognormal, Gamma and Gom-pertz were compared and the most suitable model for the obtained data distribution was determined. Although the AIC values for the five distributions in question were very close to each other, the Gompertz distribution, which had the lowest AIC value, was determined as the most suitable model. KKeeyy WWoorrddss:: Survival analysis, breast neoplasms, Weibull distribution, Loglogistic distribution,
Lognormal distribution, Gamma distribution, Gompertz distribution Ö
ÖZZEETT AAmmaaçç:: Bu ça lış ma da me me kan ser li has ta la ra ait sağ ka lım ana liz le ri nin so nuç la rı nı We i bull, Gam ma, Gom pertz, Log-Lo gis tic ve Log-Nor mal pa ra met rik mo del le ri kul la na rak kar şı laş tır ma yı amaç la dık. GGee rreeçç vvee YYöönn tteemm lleerr:: Ça lış ma da Ege Üni ver si te si Kan ser Araş tır ma Mer ke zi’ nde ka yıt -lı 1992 ile 2007 yıl la rı ara sın da ki 5457 me me kan ser li has ta dan el de edi len ve ri ler kul la nıl mış tır. Has ta lar 50 yaş ve üs tün de ki ler ile 50 yaş al tın da ki ler ol mak üze re iki gru ba ay rıl dı lar. Kap lan Me i er me to du ile el de edi len iki gru ba ait sağ ka lım eğ ri le ri kar şı laş tı rı lır ken Log rank tes ti uy gu lan mış -tır. Me me kan ser li has ta ve ri le ri ile bir lik te We i bull, Gam ma, Gom pertz, Log lo gis tic and Log nor mal pa ra met rik mo del le ri kul la nı la rak bir sağ ka lım ana li zi ya pıl mış tır. BBuull gguu llaarr:: İki gru bun sağ ka lım eğ -ri le -ri long-rank tes ti kul la nı la rak kar şı laş tı rıl mış, is ta tis tik sel ola rak an lam lı fark bu lun ma mış tır. Pa ra met rik test ler kul la nı la rak ya pı lan sağ ka lım sü re le ri nin ana li zin de, yaş or tak de ğiş ken ola rak ele alın mış tır. Pa ra met rik mo del ler içe ri sin de en iyi ola nı be lir le mek üze re Aka i ke Bil gi Kri te ri (ABK)’nden fay da la nıl mış tır. Ça lış ma so nuç la rı Gom pertz da ğı lı mı ile bu lu nan sağ ka lım mo de li nin en uy gu nu ol du ğu nu or ta ya koy muş tur. SSoo nnuuçç:: ABK kul la nı la rak We i bull, Log lo gis tic, Log nor mal, Gam ma ve Gom pertz ile el de edi len mo del ler kar şı laş tı rıl mış ve el de edi len ve ri da ğı lı mı için en uy -gun mo del ele alın mış tır. Söz ko nu su beş da ğı lım hak kın da ki ABK de ğer le ri bir bi ri ne çok ya kın bu lun muş ve ABK de ğe ri en dü şük olan Gom pertz da ğı lı mı, en uy gun mo del ola rak de ğer len di ril -miş tir.
AAnnaahh ttaarr KKee llii mmee lleerr:: Sağkalım analizi, meme tümörleri, Weibull dağılımı, Loglojistik dağılım, Lognormal dağılım, Gamma dağılımı, Gompertz dağılımı
TTuurrkkiiyyee KKlliinniikklleerrii JJ MMeedd SSccii 22001100;;3300((55))::11666655--7744
Elvan AKTÜRK HAYAT,a Aslı SUNER,b Burak UYAR,a Ömer DURSUN,b Mehmet N. ORMAN,c Gül KİTAPÇIOĞLU, MDd aDepartment of Statistics,
Ege University Faculty of Science,
bDepartment of Statistics,
Dokuz Eylül University Faculty of Arts and Sciences,
cDepartment of Biostatistics,
Ege University Faculty of Medicine,
dEge University Cancer Research Center,
İzmir
Ge liş Ta ri hi/Re ce i ved: 26.11.2009 Ka bul Ta ri hi/Ac cep ted: 05.08.2010
Summary of this article was presented as a oral presentation by the title of “Comparison of Five Survival Models on Breast Cancer Registry Data from Ege University Cancer Research Center (EUCRC)” at the 5th Conference of the Eastern Mediterranean Region of the International Biometric Society (EMR-IBS), 10-14 May, 2009, İstanbul, Turkey.
Ya zış ma Ad re si/Cor res pon den ce: Elvan AKTÜRK HAYAT Ege University Faculty of Science, Department of Statistics, İzmir, TÜRKİYE/TURKEY [email protected]
re ast can cer is the most fre qu ent can cer in wo men whi le it is the se cond one in all hu-mans. Alt ho ugh its pre va len ce chan ges in dif fe rent so ci e ti es, it is known that one out of 8-10 wo men in Wes tern so ci ety wo uld ha ve bre ast cancer du ring her li fes pan. The mor ta lity ra te of bre -ast can cer was cal cu la ted as 3%. The pre va len ce of the di se a se is es pe ci ally hig her in North Ame ri can and Eu ro pe an co un tri es than the rest of the world.1 Alt ho ugh 796 000 bre ast can cer ca ses and 314 000 de aths du e to the di se a se are de tec ted in a study con duc ted by the World He alth Or ga ni sa ti on (WHO) in 1990, 1 152 000 new ca ses and 411 000 de aths are de tec ted in a study, con duc ted by the In ter na ti o nal Agency on Can cer for Re se arch (IARC) un der WHO ad mi nis tra ti on in 2002. In this pe ri od of ti me, the in ci den ce and mor ta lity ra tes of bre ast can cer increased by 25%. The mor ta lity ra -te of bre ast can cer is aro und 9.7%. Of all bre ast can cer ca ses, only 1% are men. Ac cor ding to all pha ses of the di se a se, the fi ve-ye ar sur vi val ra te has been reported as %73 in de ve lo ped co un tri es and %53 in de ve lo ping co un tri es. The sig ni fi cant dif fe -ren ce bet we en these two va lu es can be exp la i ned by early di ag no sis vi a mam mog raphy scans and bet ter tre at ment in de ve lo ped co un tri es. Bre ast can cer mor ta lity ra te is 30% (190 000 de aths/636 000 ca ses) in de ve lo ped co un tri es; and 43% (221 000 / 514 000 ca ses) in un derde ve lo ped co un tri -es.2Ac cor ding to the pre sent da ta in our co untry, a pre va len ce of 20/100 000 for Eas tern re gi ons and 4050/100 000 for Wes tern re gi ons may be de ter -mi ned.3The re a son for this dif fe ren ce in the pre va-len ce is the re semb lan ce of the Wes tern re gi on’s li fest yle to the Eu ro pe ans. One of the fo ur can cer types nests in bre asts, and bre ast can cer is the ma -in ca u se of de ath du e to can cer.4
The fac tors that in cre a se the risk of bre ast cancer are age over 50 years, presence of a clo se re la -ti ve ha ving bre ast can cer (if mot her or sis ter has bre ast can cer the risk is mul tip li ed by 2 or 3), anot -her can cer be ing as cer ta i ned in the ot -her bre ast, beginning of mens tru a ti on be fo re age 12, absence of any preg nancies, and con ti nu ing to mens tru a te af ter age 50. In bre ast can cer whe re age is an
im-por tant fac tor, 70% of the wo men di ag no sed are over 50.5
This study aimed to com pa re the re sults of the sur vi val analy sis of the bre ast can cer pa ti ents by using We i bull, Gam ma, Gom pertz, Log-lo gis tic and Log-Nor mal pa ra met ric mo dels. Be fo re con duc ting the pa ra met ric mo del ling, the pa ti ents were di vi -ded in to two gro ups as 49-and-lo wer and 50-and-over, ba sed on the cri ti cal age 50 for the bre ast can cer pa ti ents, and the ir sur vi val ra tes were cal cu-la ted using the Kap cu-lan Me i er Met hod.
MATERIAL AND METHODS
The da ta used in this study are ob ta i ned from Ege Uni ver sity Can cer Re se arch Cen tre (EUCRC). The da ta used in the analy ses be long to 5457 bre ast can-cer pa ti ents who were diagnosed bet we en 1992 and 2007. The patients were di vi ded in to two with re-spect to their ages as 49-and-lo wer and 50-and-over. The Log rank test was app li ed to compare the sur vi val cur ves of the two age gro ups ob ta i ned by Kap lan Me i er met hod. The sur vi val analy sis was con duc ted by using We i bull, Gam ma, Gom pertz, Log lo gis tic and Log nor mal dis tri bu ti on of pa ra -met ric mo dels.
In or der to de ter mi ne the most su i tab le dis tri -bu ti on to the sur vi val pe ri ods, the accelerated fail-ure time form of the We i bull, Log nor mal, Log lo gis tic and Gam ma dis tri bu ti ons and the proportional bazard form of the Gom pertz dis tri bu ti -on we re used. The mo dels ob ta i ned vi a the se fi ve dis tri bu ti ons were com pa red using the Aka i ke Infor ma ti on Cri te ri a (AIC) and the most su i tab le mo -del to the dis tri bu ti on of the da ta was de ter mi ned.
LOG NOR MAL DIS TRI BU TI ON
The ske wed dis tri bu ti ons, whe re the ave ra ge va lu -es are low, va ri an c-es are high and the va lu -es are not ne ga ti ve such as the di ver sity of spe ci es, the dis tri bu ti on of the mi ne rals in the crust of the earth, ge ne rally ac cord with Log nor mal dis tri bu ti -on. The log nor mal dis tri bu ti on, re la ted to the nor-mal dis tri bu ti on but ha ving the hypot he sis that the ran dom va ri ab le may only get po si ti ve va lu es is usually used for eco no mic da ta, the res pon se da ta of the sti mu lant bi o lo gic ma te ri als, most types of
sur-vival da ta, dis tri bu ti on of the re pa ir ti me of hardwa re, fi nan ci al re se arc hes and stu di es on stock pri -ces. When the examp les of use of the log nor mal dis tri bu ti on are exa mi ned, it is se en that among the se examp les the re are ge o logy, me tal lurgy, he alth, en vi ron ment, at mosp he ric sci en ces, ae ro bi o -logy, mic ro bi o -logy, plant physi o -logy, eco -logy, fo od tech no logy, lin gu is tics, so ci al sci en ces and eco no -mics.6
The the ory of the log nor mal dis tri bu ti on was cha rac te ri sed by McA lis ter in 1897. The re is ac cor-dan ce to the log nor mal dis tri bu ti on in many ex-amp les in the are a of me di ci ne. The stu di es on de ter mi ning the sur vi val in can cer, the stu di es of Sart well on the length of the in cu ba ti on ti me of the in fec ti o us di se a ses and the stu di es by Hor ner to deter mi ne the be gin ning age of the Alz he i mer’s di se -a se m-ay be -among the ex-amp les of the me di c-al stu di es.6,7Gad dum, with app li ca ti ons in bi o logy, and Bo ag, with his stu di es on can cer ha ve ta ken the ir pla ce in li te ra tu re.8,9In 1957, the his tory of the log nor mal dis tri bu ti on, its fe a tu res, es ti ma ti on prob lems and its use in eco no mics were exa mi ned in de ta il. By ot her re se arc hers, the sur vi val pe ri od dis tri bu ti ons of Hodg kin’s di se a se and many ot her di se a ses, li ke chro nic le u ke mi a, wereanaly zed vi a log nor mal dis tri bu ti on, which is po si ti vely ske wed and with sur vi val pe ri od lo ga rithms dis tri bu ted nor mally.10
Ta i et al. analy zed the li mi ted-sta ge small-cell lung can cer pa ti ents with Kap lan-Me i er cur ves, Cox pro por ti o nal ha zard mo del, Bo ag log-nor mal (cu re-ra te mo del) mo del and log-nor mal sur vi val analy sis met hods.11 Fe in le ib and Mac Ma hon, in a study con duc ted on chro nic lymphocy tic and myeo lmyeocy thic le u ka e mi a pa ti ents, app li ed the lmyeog nmyeor -mal dis tri bu ti on on chro nic lymphocy tic and mye o locy thic le u ka e mi a di ag no sed in Ca u ca si an pa ti ents li ved in Bro oklyn bet we en 1943 and 1952.12
LOG LO GIS TIC DIS TRI BU TI ON
If the mor ta lity ra ti o in a li fe analy sis slowly dec -re a ses af ter it -re ac hes to a ma xi mum po int over a fi-ni te pe ri od, it is su i tab le to use a non-mo no to fi-nic fa i lu re ra te dis tri bu ti on mo del on the li fe and lost
ti me. For ins tan ce, in a study con duc ted on the cur-ability of bre ast can cer, Lans gland fo und that the ma xi mum po int is re ac hed in three ye ars.13
In so me of the da ta sets, it ap pe a red that it is im por tant to do analy sis using su i tab le mo dels such as log nor mal, re ver se ga uss, log lo gis tic and Burr Type XI I. However in ca ses whe re one co mes ac -ross to cen so red da ta, using log lo gis tic dis tri bu ti on is mat he ma ti cally mo re ad van ta ge o us than ot her dis tri bu ti ons. According to the study of Gupta et al, the loglogistic distribution is proved to be suit-able in analysing survival data conducted by Cox, Cox and Oakes, Bennet, O’Quinley and Struthers. Gupta et al. used loglogistic distribution in survival analysis on lung cancer data in their studies. In the -ir re se arch, they es ti ma ted the po int whe re the mor ta lity ra ti o re ac hed ma xi mum le vel. They es ti -ma ted the pa ra me ters of the dis tri bu ti on using the ma xi mum li ke li ho od es ti ma te and bo ots trap met h-ods and they ob ser ved the pro xi mity of the re-sults.14
A study con duc ted by Byers in 1988 on the spre a ding ra ti o of HIV vi rus in San Fran sis co bet -we en 1978 and 1986 in di ca ted that log lo gis tic was the most su i tab le mo del among many dis tri bu ti on mo dels to use with half cen so red da ta.15 A study Zhou et al. conducted in 2007 emp ha si zed that the ma xi mum li ke li ho od es ti ma ti on was the most su i -tab le met hod in es ti ma ting the pa ra me ters when performing analy ses using log lo gis tic dis tri bu ti on on gro u ped da ta such as half-cen so red da ta.16
Log lo gis tic dis tri bu ti on is a con ti nu o us dis tri bu ti on for the ran dom va ri ab le which is not ne ga -ti ve in pro ba bi lity and sta -tis -tics. Log lo gis -tic analy sis is used as a pa ra met ric mo del survival analy sis whe re the ra ti o in cre a ses at the very be gin ning and la -ter dec re a ses.10
WEI BULL DIS TRI BU TI ON
We i bull dis tri bu ti on which is a ge ne ra li sed ver si on of the ex po nen ti al dis tri bu ti on is wi dely used in mo del ling we at her fo re casts in me te o ro logy, and de fi ning the dis tri bu ti on of wind spe ed in ra dar mo del ling. We i bull dis tri bu ti on is pre fer red for performing survival da ta analy sis in in dus tri al en-gi ne e ring is su es.17When the imp le men ta ti ons in
the dis cip li ne of me di ci ne are exa mi ned, one may se e that We i bull dis tri bu ti on is an im por tant distri bu ti on mo del used in me di ci ne since it is an fle -xib le dis tri bu ti on that allows a mo no to no us in cre a sing and dec re a sing of mor ta lity ra ti o in pa-ti ent gro ups. In a study car ri ed out by Vis co mi et al., the dis tri bu ti on of the sur vi val pe ri od of child-ho od le u k e mi a pa ti ents was analy sed using the We i bull dis tri bu ti on.18
The correlation bet we en the da ta and so me distri bu ti ons, inc lu ding the We i bull dis distri bu ti on, is tes -ted by An der son-Dar ling test.19In a study con duc ted in Italy on the na ti on wi de es ti ma ti on of the can cer pa ti ents, so me es ti ma ti ons were ma de for de fi ning the pa ra me ters of the We i bull dis tri bu ti on.20
GAM MA DIS TRI BU TI ON
Gam ma dis tri bu ti on, for its comp li an ce with the pa ti ent da ta, is a su i tab le dis tri bu ti on to use in sur-vival dis tri bu ti on mo dels. Additionally, it is used in qu e u e systems, in raw ma te ri al flow bet we en ma nu fac tu ring and dep loy ment li nes, in mo del ling the lo ads of the web ser vi ce pro vi ders and risk ma na ge ment. When its use in the dis cip li ne of me di -ci ne is con si de red, it is se en that this dis tri bu ti on mo del is used in cirr ho sis and chro nic he pa ti tis pa-ti ents. In a stu dy con duc ted in 1983 on images ob-ta i ned vi a he pa tog raphy in he althy adults by Gal li et al., and in a throm bocy te sur vi val study by Bo -lin et al. in 1986 this method was used.21,22Po on et al., used non pa ra met ric met hods to assess the re la-ti ons hip bet we en sur vi val pe ri od (months) of the pa ti ents with na sop hary nge al tu mo r and dif fe rent cli ni cal cha rac te ris tics in the ir study.23
The ex po nen ti al dis tri bu ti on, which is a spe ci -al ver si on of the Gam ma dis tri bu ti on, is used in can cer sur vi val mo dels.24In 1966 Ze len used the ex po nen ti al dis tri bu ti on to mo del the sur vi val pe-ri ods in a study whe re he tpe-ri ed to de ve lop a cu re for can cer on a L1210 ani mal le u k e mi a system.25In most of the cli ni cal stu di es, the ex po nen ti al mo del is used in de fi ning the tu mo r de ve lop ment.26The ex po nen ti al mo del is used in a study by De wals and Bo uc ka ert in 1985 on car ri er bac te ri a and in a study by San krit hi et al. in 1991 on na ti on wi de in fant de -aths.27,28
GOM PERTZ DIS TRI BU TI ON
Gom pertz mo del, used fre qu ently by me di cal re se -arc hers and bi o lo gists in mo del ling the mor ta lity ra ti o da ta, was for mu la ted by Ben ja min Gom pertz in 1825. Gom pertz is a growth mo del and has be en used in re la ti on with tu mor de ve lop ment. Ahu ja and Nash sho wed that Gom pertz dis tri bu ti on was, with a simp le con ver si on, re la ted to so me dis tri bu -ti ons in the Pe ar son dis tri bu -ti ons fa mily.29
According to Jaheen, Garg et al. ob ta i ned the ma xi mum li ke li ho od es ti ma ti ons of the Gom pertz dis tri bu ti on pa ra me ters and Os man, in or der to de-ri ve the com po si te Gom pertz dis tde-ri bu ti on which is as su med to ac cord with the Gam ma dis tri bu ti on with one of the two pa ra me ters be ing ran dom, used a Gom pertz dis tri bu ti on with two pa ra me ters, wor -ked on the fe a tu res of the dis tri bu ti on and of fe red that it sho uld be used in mo del ling the li fes pan da ta analy sing the sur vi val ra ti o in he te ro ge nic mas -ses. Re cently, so me re se arch and stu di es have been car ri ed out on Gom pertz dis tri bu ti on by AlHus sa -i n-i et al.30
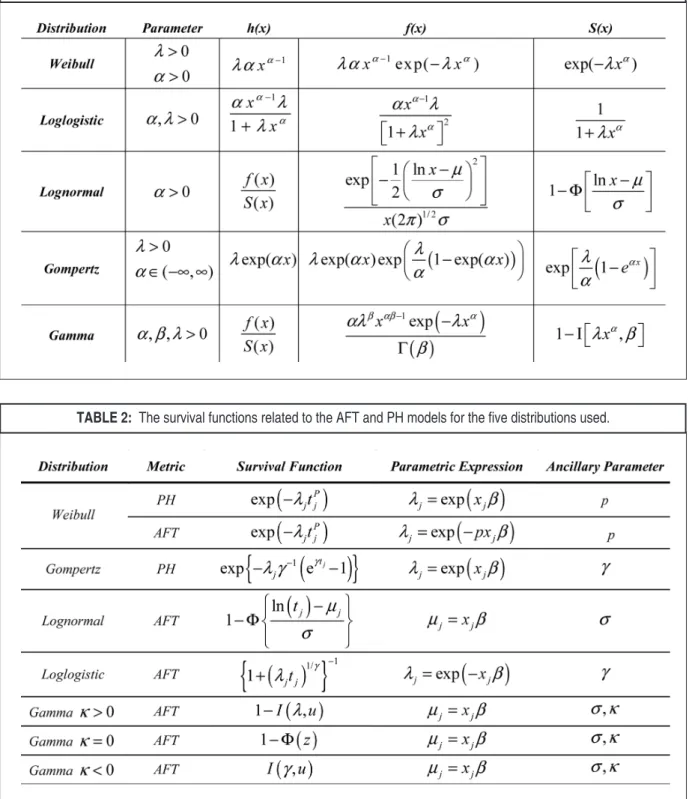
The ha zard func ti ons [h(x)], pro ba bi lity den-sity func ti ons [f(x)] and sur vi val func ti ons [S(x)] of the most fre qu ently used pa ra met ric mo dels, na -mely the We i bull, Gam ma, Gom pertz, Log lo gis tic and Log nor mal dis tri bu ti ons are gi ven in Tab le 1.31 Pa ra met ric sur vi val mo dels are sta tis ti cally mo re po wer ful than nonpa ra met ric or se mipa ra -met ric mo dels. Two mo dels used for cor rec ti on of the co va ri a te’s ef fect on the sur vi val func ti on are ac ce le ra ted fa i lu re ti me (AFT) and pro por ti o nal ha -zard (PH) mo dels.32
In AFT mo del, the na tu ral lo ga rithm of the sur vi val pe ri od ln(t) is exp la i ned by a li ne ar func-ti on of the co va ri a tes as He re, X is a vec tor of the co va ri a tes, βis the reg res si on co-ef fi ci ent and z jis the er ror which has the den sity
of f( ). The dis tri bu ti on of the er ror term de fi nes the reg res si on mo del. For ins tan ce, if f( ) is a nor mal den sity func ti on, the log nor mal reg res si on mo del, if f( ) is a log lo gis tic den sity, the log lo gis tic reg res -si on mo del is ob ta i ned. The ef fect of the AFT mo del is the chan ge in the ti me sca le by the
or smal ler than 1, the ti me be co mes ac ce le ra ted or de ce le ra ted.
In PH mo del, the co va ri a tes ha ve a pro por ti o -nal ef fect on the ha zard func ti on. In the func ti on,
is the ba sic ha zard
func ti on, is a non-ne ga ti ve func ti on of the
co va ri a tes and ex pres sed as The
sur vi val func ti ons re la ted to the AFT and PH mo -dels for the fi ve dis tri bu ti ons used in the analy ses are sum ma ri sed (Tab le 2).33
TABLE 1: The hazard functions, probability density functions and survival functions for the parametric distributions.
When com pa ring the mo dels re la ted to the bre ast can cer pa ti ent da ta and de ter mi ning the most su -i tab le mo del to the d-is tr-i bu t-i on of the da ta, the Akaike information criteria (AIC) is used.33AIC sugges ted by Aka i ke in 1974, is an in for ma ti on as sess -ment cri te ri a for com pa ring the mo dels.34The AIC va lu e is cal cu la ted as In this for mu la, c is the num ber of the co va ri a tes in the mo del and p is the pa ra me ter num ber.
The analy ses we re con duc ted using the STA -TA (ver si on 10.0) sta tis ti cal soft wa re.
RESULTS
Analysis of gen der dis tri bu ti on of the 5698 bre ast can cer pa ti ents revealed that 95 (1.7%) of them were men and 5568 (98.3%) of them were wo men. When the sur vi val pe ri ods were exa mi ned, it was se en that the re were 146 mis sing ob ser va ti ons. Mis sing ob ser va ti ons and the da ta of the ma le pa-ti ents were excluded from the analy sis. Data re-vealed that 149 of the pa ti ents (2.7%) had di ed. The ave ra ge age of the 5457 fe ma le pa ti ents di ag -no sed as bre ast can cer was cal cu la ted as 51.70 ± 12.48 ye ars. When the di ag no sis met hods of the pa ti ents were exa mi ned, it was seen that 5279 of them (96.7%) diagnosed by biopsy of pri mary, 68 of them (1.2%) by me tas ta sis, three of them (0.1%) were diagnosed at au topsy, 46 of them (0.8%) were diagnosed by cyto logy/ha e ma to logy, and 45 of them (0.8%) were diagnosed in a cli ni cal re se arch before 2006. The di ag no sis met hod of 16 pa ti ents was re gis te red as unk nown. The tu mo r was lo ca -lized in ma mi li a/are o la re gi on in 117 of them (2.1%), 128 of them (2.3%) had tumor in the mid-d le part of the bre ast, 381 of them (7%) hamid-d tumor in the up per in ner bre ast qu ad rant, 212 of them (3.9%) had tumor in the lo wer in ner bre ast qu ad -rant, 1814 of them (33.2%) had tumor in the up per ou ter bre ast qu ad rant, 291 of them (5.3%) had tumor in the lo wer ou ter bre ast qu ad rant, 14 of them (0.3%) had tumor in the bre ast’s axil lary no -de, 718 of them (13.2%) had an extensive le si on in the bre ast, 1767 of them (32.4%) had tumor in an unk nown po si ti on in the bre ast, 13 of them (0.2%) had tumor in la bi um ma jus, one of them had tumor in en do cer vix and one of them in en do met
-ri um. Five thousand forty seven of the pa ti ents (96.1%) re ce i ved tre at ment, 96 of them (1.8%) did not re ce i ve any tre at ment, and one of them re ce i ved sympto ma tic tre at ment. The tre at ment con di -ti ons of 114 pa -ti ent (2.1%) were unk nown. In the stu di es con duc ted, it is set forth that bre ast can cer in cre a ses du ring the ac ti ve pro duc ti ve pha se un til me no pa u se and shows a pro por ti o nal dec re a se af -ter ages 50-55.35Si mi lar stu di es show that, in men the prevalence of breast cancer is ap pro xi ma tely 1.0%.36This re se arch gro up has fin dings per ti nent to the li te ra tu re.
The pa ti ents were di vi ded in to two gro ups; 49-and-lo wer (age1) and 50-and-over (age2). Sixty seven of 2589 (2.6%) pa ti ents ≤49 years of age and 82 of 2868 (2.9%) patients ≥50 years of age of di ed.
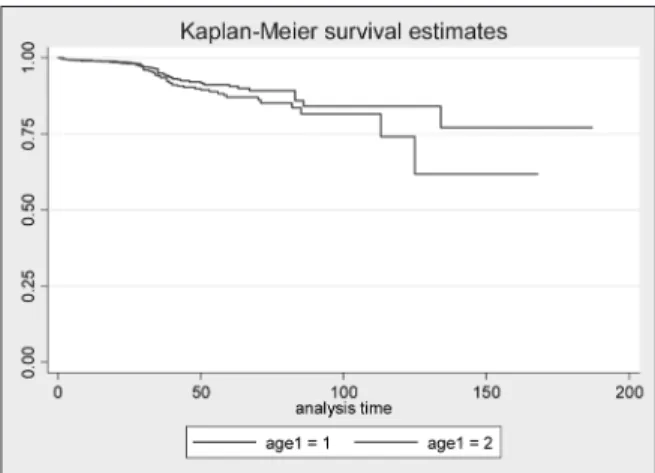
In the sur vi val func ti on graph ob ta i ned by Ka-p lan-Me i er which is a non-Ka-pa ra met ric tech ni qu e, it is se en that the es ti ma ted sur vi val pro ba bi lity of the 49-and-lo wer gro up pa ti ents was hig her than the one estimated in the 50-and-over gro up (Fi gu re 1). As a re sult of the log rank test used in com pa ri son of the sur vi val cur ves be lon ging to dif fe rent age gro ups, it is ob ser ved that the re was no any sta tis -ti cally sig ni fi cant dif fe ren ce bet we en the sur vi val cur ves of the bre ast can cer pa ti ents in 49andlo -wer and 50-and-over gro ups
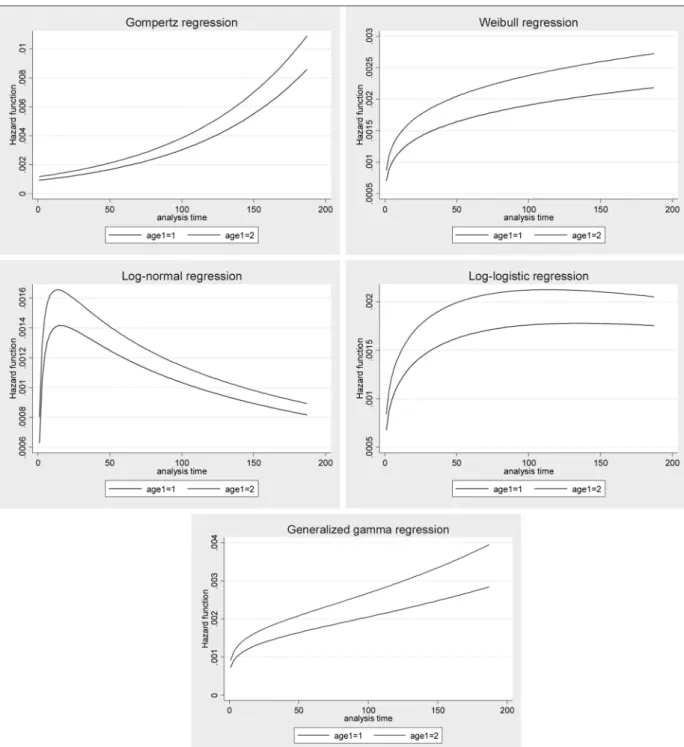
The ha zard func ti on graphs for age gro ups, cre a ted in ac cor dan ce with Log nor mal, Log lo gis tic, We i bull, Gam ma and Gom pertz dis tri bu ti ons are
gi ven in Fi gu re 2. When the ha zard func ti on graphs ob ta i ned as a re sult of the analy ses con duc -ted are exa mi ned, it is se en that the mor ta lity risk of the 49-and-lo wer gro up pa ti ents are lo wer than the ones in the 50-and-over gro up (Fi gu re 2).
The sur vi val func ti on graphs for age gro ups, cre a ted in ac cor dan ce with Log nor mal, Log lo gis tic,
We i bull, Gam ma and Gom pertz dis tri bu ti ons are gi ven in Fi gu re 3.
When the sur vi val func ti on graphs are exa mi -ned, it is ob ser ved that the sur vi val pro ba bi lity of the pa ti ents in the 49-and-lo wer gro up is hig her than the ones in the 50-and-over gro up. The graph of the Gom pertz mo del ex hi bits mo re cle arly the
cur vi li ne a rity ob ser ved in the Kap lan-Me i er cur ve (Fi gu re3).
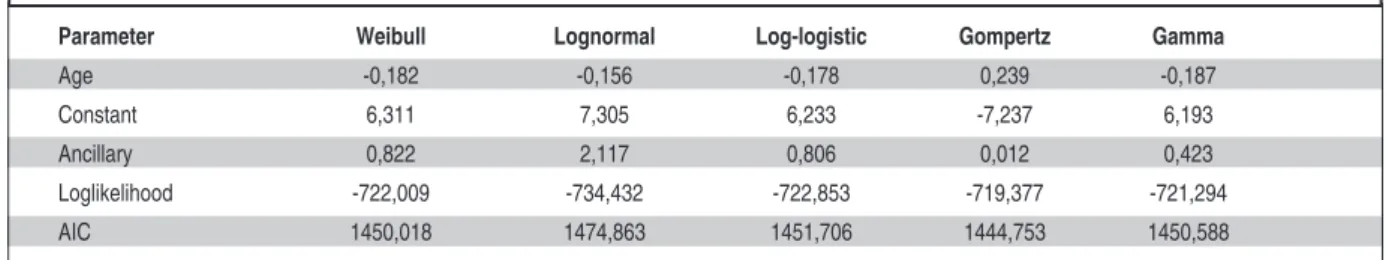
When analy sing the sur vi val pe ri ods using pa -ra met ric mo dels, the age va ri able is ta ken as the co va ri a te. The pa ra me ter ob ta i ned as a re sult of the analy sis, the log li ke li ho od and the AIC va lu es are pre sen ted in Tab le 3. As lo wer va lu es of AIC sug-gest a bet ter mo del, the mo del ob ta i ned by using
Gom pertz mo del is de ter mi ned as the most su i tab -le mo del for the 49-and-lo wer and 50-and-over gro ups among fi ve mo dels.
The ti me ra ti o (TR) va lu es were cal cu la ted as a re sult of the AFT func ti on and the ha zard ra ti o (HR) va lu es were cal cu la ted as a re sult of the PH form and the ir con fi den ce in ter vals were gi ven. The ti me ra ti o and ha zard ra ti o va lu es ob ta i ned for
all dis tri bu ti ons re la ted to the age va ri able were not fo und sta tis ti cally sig ni fi cant (p>0.05). This shows that the age va ri able do es not po se a risk fac tor for bre ast can cer pa ti ents (Tab le 4).
CONCLUSION
In this study, we aimed to compare the re sults of the sur vi val analy sis of bre ast can cer pa ti ents using We i bull, Gam ma, Gom pertz, Log lo gis tic and Log-nor mal mo dels. The da ta ob ta i ned from EUCRC be-t we en 1992 and 2007 were used. The da be-ta used in this study com pri ses of only fe ma le pa ti ents’ da ta.
In conclusion, as a re sult of the analy ses de pen -ding on the pa ra me ter es ti ma tes, age va ri able was not fo und as a risk fac tor. By using AIC, the mo d-els ob ta i ned vi a We i bull, Log lo gis tic, Log nor mal, Gam ma and Gom pertz mo dels were com pa red and the most su i tab le mo del for the ob ta i ned da ta dis
tri-bu ti on was de ter mi ned. Alt ho ugh the AIC va lu es of the fi ve dis tri bu ti ons in qu es ti on were very clo se to each ot her, the Gom pertz dis tri bu ti on, which had the lo west AIC va lu e, was de ter mi ned as the most su i tab le mo del. It was concluded that the Gompertz distribution model was more suitable for these sur-vival data obtained from EUCRC.
Parameter Weibull Lognormal Log-logistic Gompertz Gamma
Age -0,182 -0,156 -0,178 0,239 -0,187
Constant 6,311 7,305 6,233 -7,237 6,193
Ancillary 0,822 2,117 0,806 0,012 0,423
Loglikelihood -722,009 -734,432 -722,853 -719,377 -721,294
AIC 1450,018 1474,863 1451,706 1444,753 1450,588
TABLE 3: Parameter, loglikelihood and AIC values.
Distribution TR(95%CI) p-value
Weibull AFT .83 (.64 1.09) .180
Lognormal AFT .86 (.63 1.17) .324
Loglogistic AFT .84 (.64 1.10) .196
Gamma AFT .83 (.64 1.08) .162
Distribution HR (95%CI) p-value
Gompertz PH 1.27 (.92 1.76) .148
TABLE 4: TR and HR values for age in five distributions.
1. Stewart BW, Kleihues P. The Global Burden of Cancer. World Cancer Report. 1sted. Lyon:
IARC Press; 2003. p.12-7.
2. Özmen V. [Screening and registering pro-grams for breast cancer in Turkey and in the world]. Journal of Breast Health 2006;2(2):55-8.
3. Parkin DM, Bray F, Ferlay J, Pisani P. Global cancer statistics 2002. CA Cancer J Clin 2005;55(2):74-108.
4. Shyyan R, Masood S, Badwe RA, Errico KM, Liberman L, Ozmen V, et al. Breast cancer in limited-resource countries: diagnosis and pathology. Breast J 2006;12(Suppl 1):S27-37. 5. Robb C, Haley WE, Balducci L, Extermann M, Perkins EA, Small BJ, et al. Impact of breast cancer survivorship on quality of life in older women. Crit Rev Oncol Hematol 2007;62(1): 84-91.
6. Limpert E, Stahel WA, Abbt M. Log-normal distributions across the sciences: Keys and clues. BioScience 2001;51(5):341-52. 7. Horner RD. Age at onset of Alzheimer's
dis-ease: clue to the relative importance of etio-logic factors? Am J Epidemiol 1987;126(3): 409-14.
8. Gaddum JH. Log normal distributions. Nature London 1945;156(3964):463-6.
9. Boag JW. Maximum likelihood estimates of the proportion of patients cured by cancer therapy. Journal of the Royal Statistical Soci-ety Series B 1949;11(1):15-53.
10. Lee ET, Wang JW. Some well-known para-metric survival distributions and their applica-tions. Statistical Methods for Survival Data Analysis. 3rd ed. Hoboken, New Jersey: John Wiley&Sons, Inc; 2003. p.134-62.
11. Tai P, Chapman JA, Yu E, Jones D, Yu C, Yuan F, et al. Disease-specific survival for lim-ited-stage small-cell lung cancer affected by statistical method of assessment. BMC Can-cer 2007;7:31.
12. Feinleib M and Macmahon B. Variation in the duration of survival of patients with the chronic leukemias. Blood 1960; 15(3): 332-49. 13. Langlands AO, Pocock SJ, Kerr GR, Gore
SM. Long term survival of patients with breast cancer: a study of curability of the disease. Br Med J 1979; 2(6200):1247-51.
14. Gupta RC, Akman O, Lvin S. A study of log-lo-gistic model in survival analysis. Biom J 1999;41(4):431-43.
15. Byers RH Jr., Morgan WM, Darrow WW,Doll L, Jaffe HW, Rutherford G, et al.Estimating AIDS infection rates in the San Francisco co-hort. AIDS 1988; 2(3):207-10.
16. Zhou YY, Mi J, Guo S. Estimation of parame-ters in logistic and log-logistic distribution with grouped data. Lifetime Data Anal 2007; 13(3):421-9.
17. Weibull W. A statistical distribution functions of wide applicability. J Appl Mech 1951; 18(2):293-7.
18. Viscomi S, Pastore G, Dama E, Zuccolo L, Pearce N, Merletti F, et al. Life expectancy as an indicator of outcome in follow-up of popu-lation-based cancer registries: the example of childhood leukemia. Ann Oncol 2006;17(1): 167-71.
19. Akram M, Aman Ullah M, Taj R. [Survival analysis of cancer patients using parametric and non-parametric approaches]. Pakistan Vet Journal 2007;27(4):194-8.
20. Inghelmann R, Grande E, Francisci S, De An-gelis R, Micheli A, Verdecchia A, et al. Na-tional estimates of cancer patients survival in Italy: A model-based method. Tumori 2005;91(2)109-15.
21. Galli G, Maini CL, Salvatori M, Andreasi F. A practical approach to the hepatobiliary kinetics of 99mTc-HIDA: clinical validation of the method and a preliminary report on its use for parametric imaging. Eur J Nucl Med 1983; 8(7):292-8.
22. Bolin RB, Greene JR. Stored platelet survival data analysis by a gamma model. Transfusion 1986;26(1):28-30.
23. Poon D, Yap SP, Wong ZW, Cheung YB, Leong SS, Wee J, et al. Concurrent chemora-diotherapy in locoregionally recurrent na-sopharyngeal carcinoma. Int J Radiat Oncol Biol Phys 2004;59(5):1312-8.
24. Lee ET, Go OT. Survival analysis in public health research. Annu Rev Public Health 1997;18:105-34.
25. Zelen M. Application of exponential models to problems in cancer research. J Roy Statist Soc Series A 1966;129(3):368-98. 26. Spratt JA, Von Fournier D, Spratt JS, Weber
EE. Decelerating growth and human breast cancer. Cancer 1993;71(6):2013-9. 27. Dewals P, Bouckaert A. Methods for
estimat-ing the duration of bacterial carriage. Int J Epi-demiol 1985;14(4):628-34.
28. Sankrithi U, Emanuel I, Van Belle G. Com-parison of linear and exponential multivariate models for explaining national infant and child mortality. Int J Epidemiology 1991; 20(2):565-70.
29. Ahuja JC, Nash SW. The generalized Gom-pertz-Verhulst family of distributions. Sankhya Ser A 1967;29(2):141-56.
30. Jaheen ZF. Prediction of progressive cen-sored data from the Gompertz model. Com-munications in Statistics-Simulation and Computation 2003; 32(3):663-76.
31. Ata N, Karasoy D, Sözer MT. [Parametric and nonparametric survival models for nonpropor-tional hazards]. İstatistikciler Dergisi 2008;1(3):125-34.
32. Kleinbaum DG, Klein M. Parametric survival models. In: Gail M, Krickeberg K, Samet J, Tsiatis A, Wong W, eds. Survival Analysis-A Self-Learning Text. 2nd ed. New York:
Springer; 2005. p.260-312.
33. Ata N, Karasoy D, Sözer MT. [Stratified cox regression model for non-proportional hazards and an application on breast cancer patients]. Turkiye Klinikleri J Med Sci 2008; 28(3):327-32.
34. Akaike H. A new look at the statistical model identification. IEEE Transactions on Automatic Control 1974;19(6):716-23.
35. Key TJ, Verkasalo PK, Banks E. Epidemiol-ogy of breast cancer. Lancet Oncol 2001; 2(3):133-40.
36. Weiss JR, Moysich KB, Swede H. Epidemiol-ogy of male breast cancer. Cancer Epidemiol Biomarkers Prev 2005;14(1):20-6.