Turkish Journal of Field Crops 2014, 19(1), 35-45
SECOND-ORDER RESPONSE SURFACE METHOD: FACTORIAL
EXPERIMENTS AN ALTERNATIVE METHOD IN
THE FIELD OF AGRONOMY
Mustafa Agah Tekindal1*, Hülya Bayrak2,Berrin Özkaya3, Yasemin Yavuz 4 1 Mustafa AgahTekindal, Başkent University, Faculty of Medicine, Basics Medical Science,
Department of Biostatistics, Ankara, TURKEY
2 Gazi University, Faculty of Sciences, Department of Statistics, Ankara, TURKEY
3Ankara Üniversitesi, Faculty of Engineering, Department Of Food Engineering, Ankara, TURKEYs 4Ankara University, Faculty of Medicine, Basics Medical Science, Department of Biostatistics,
Ankara, TURKEY
*Corresponding author: [email protected]
Received: 28.08.2013 ABSTRACT
The main purpose in all experimental designs is to take into account the factors that are considered likely to have an effect on the response variable emphasized, and to minimize the error of experiment in this way. Bread, which is the staple human food, cannot have any negative effect on human beings as long as it is produced by using suitable materials under appropriate conditions. However, when inappropriate amounts of raw materials are used (e.g. non-optimal amounts of bran, yeast or other additives), bread threatens health. In this study, Box-BehnkenDesign (BBD) and Central Composite Design (CCD), the two different designs of the response surface method, were applied to a single dataset. Two designs were evaluated in terms of the results obtained. The purpose in the second-order factorial experiments is to identify the optimum levels of independent variables for the dependent variable. In this study, the implementation of second-order response surface model and interpretation of the results were based on 2k CCD (Central Composite Design) and BBD (Box-Behnken Design) with one replicate. In the CCD, the amount of bran added, flour type, the ratio of yeast added, furnace temperature, the duration of remaining in the furnace, and fermentation time were accepted to be significant factors that affected volume yield. In addition, R2 = 80.7% shows that the regression equation
explains variables by 80.7%. In the BBD, the ratio of bran added, the type of flour, the ratio of yeast added, furnace temperature (only in quadratic form), the duration of remaining in the furnace (only in quadratic form), and fermentation time (only in quadratic form) were accepted to be significant factors that affected volume yield. Furthermore, R2 = 89.64% shows that the regression equation explains variables by %89.64.
This method provides savings in terms of time and the amount of material by limiting the area at particular levels. Researcher may use the results of either CCD or BBD (whichever s/he deems suitable) according to the volume s/he wants to obtain.
Key Words: Box-BehnkenDesign, Central Composite Design, Experimental Design, Model, Response Surface Method, Steepest Ascent/Descent,
INTRODUCTION
Response surfaces are among the optimization methods used in the chemical production stages in biotechnology, pharmaceutics, and food engineering. Since chemical experiments are expensive and time-consuming, it is aimed to determine the most appropriate conditions by acquiring data and doing modeling through predetermined variables and points. In the light of obtained models, predictions are made at the production stage for points and ranges no experiment has been carried out.
Optimization refers to the implementation of process in accordance with the determined targets (responses) by considering the interactions of independent variables with one another and the effects of such independent variables on target (response). Any optimization procedure involves changing the determined conditions called decision (independent) variables in order to maximize or minimize the predefined criteria, which are called objective function in general, (e.g. product quality or profit) [Banga et. All, 2003]. Today, it is necessary to implement optimization theories and techniques in the competitive market. Optimization is employed for making process designs
productive (improving production and quality, and minimizing cost). A substantial progress has been made in optimization theories and techniques in the last two decades as a result of the application of mathematics, numerical analysis, and engineering in computer software. Medical sciences, have fallen behind other bioengineering disciplines in the implementation of optimization techniques. Due to various matters have too complicated physicochemical characteristics, which makes is difficult to simulate and model foodstuff in various processes [Saguy et all., 1984]. In general,many responses that determine the performance of system or the quality criteria of product are simultaneously employed in the course of the optimization of processes. It is requested to keep some of these responses at maximum level, to keep some of them at minimum level, and to enable some of them to take acceptable values or target values. In many cases, responses compete with one another. In other words, the improvement of a response may have a negative effect on another response. Therefore, all responses characterizing the system should be addressed collectively during optimization practices. However, in this case, optimization becomes quite complicated. Different approaches have been proposed in order to solve this problem. Single-response optimization problemsmay be solved through the calculation of stationary points. Response Surface Methodology, in which simple empirical models derived from experimental sets are used, is an optimization technique commonly used in the field of medical science and technology [Koç and Kaymak-Ertekin, 2009]. In this study, two different designs of response surface methodology Box-Behnken Design [BBD] and Central Composite Design [CCD]were applied to a single data set. The obtained results were evaluated in comparison of two designs.
MATERIALS AND METHODS
An experimental design having a first order model would have a linear structure. However, in different experiments, the existence of curvilinearity may be revealed through curvilinearitytest. This requires using the analyses of quadratic response surfaces.
e
b
b
b
b
b
b
+
+
+
+
+
+
=
12 1 2 2 2 22 2 1 11 2 2 1 1 0x
x
x
x
x
x
y
(2.1)This model is called second order response surface model. This experimental design has some characteristics [Myers and Montgomery, 2002]:
i) Each factor must have minimum 2 levels.
ii) The model must have minimum 1+2k+k(k-1) 2 different parameters. Finally, the experimental design must contain data obtained from 1+2k+k(k-1) 2 different points.
In these experiments, the point where the dependent variable gets its maximum or minimum value is called the “stationary point” [Dobson, 1990]. This point is at the center of the system showed in ellipses. In some cases,the stationary center located in the center shows neither maximum nor minimum value. In this case, stationary point is called “saddle point” while the system is called “saddle system”. Stationary points are one of the most important points in the second order response surface methodology. Three dimensional graphics (response surface graphic and contour plot) help determine these points.
The Calculation of Stationary Points
The determination of components in the second order response surface methodology depends on the size of coefficients given in the regression equation. The steps to be followed in calculating stationary points are as follows:
i) A quadratic response surface model is estimated by means of the data acquired through experiment.
ii) For each one of the factors included in a model, partial derivatives are calculated and evanished.
0
ˆ
...
ˆ
ˆ
2 1=
=
=
=
jY
Y
Y
c
c
c
(2.2)iii) The system of equation 2.2 obtained from the step ii is solved. One value will be obtained for each factor. The dependent variable value estimated for stationary points can be obtained by putting these values in their places in the model.
It is possible to obtain these stationary points via matrices. The model given is expressed in matrices as follows:
c
B
x
b
x
b
Y
ˆ
=
1+
'
+
'
ˆ
(2.3) In the equation 2.3, b1 shows model constant, b showslinear, and
Bˆ
shows the estimations of second order model coefficients.In additions:
[
x
x
j]
x
'
=
1,...
(2.4)
ú
ú
ú
ú
ú
ú
ú
ú
ú
û
ù
ê
ê
ê
ê
ê
ê
ê
ê
ê
ë
é
=
qq q q q qb
b
b
b
b
b
b
b
b
B
2 1 2 22 12 1 12 112
1
2
1
2
1
2
1
2
1
2
1
2
1
ˆ
(2.5) Stationary pointsb
x
S 1ˆ
2
1
-= b
(2.6)They can be obtained from the equation 2.6. If we put stationary points in their places in the main equation;
S S S S
b
x
b
x
B
x
Y
ˆ
=
0+
'
+
'
ˆ
b
x
b
Y
S'
S2
1
ˆ
0+
=
(2.7)the result of the equation 2.7 will be obtained.
S
Yˆ
is the value of response variable estimated through the stationary point [Myers and Montgomery, 2002; Box and Draper, 1986; Bauer et all., 1999;Neddermeijer,2000]The Structure of Stationary Point (CanonicalAnalysis) When a second order equation is considered sufficient, canonical analysis is applied for making a decision about the place and structure of stationary points in a second order equation. The structure of the stationary point is determined by the signs of eigenvalues obtained through
B
ˆ
matrix (2.5). For that, a new equation containing canonical values can be written.å
=+
=
k j j j SW
Y
Y
1 2ˆ
ˆ
l
(2.8)While the equation 2.8 shows the eigenvalues to be obtained from the vector
l
1,
l
2,...,
l
kb
ˆ
,k 2 1
,
W
,...,
W
W
are called “canonical variables”. It is possible to understand the characteristics of the stationary points obtained by means of the equation 2.8.i) If all
l
1,
l
2,...,
l
keigenvalues are negative, the stationary point is showing the maximum point.ii) If all
l
1,
l
2,...,
l
keigenvalues are positive, the stationary point is showing the minimum point.iii) If the signs of
l
1,
l
2,...,
l
keigenvalues are mixed, the stationary point is showing the saddle point [Myers and Montgomery, 2002; Tekindal et al., 2012].Central Composite Design
Central composite design (CCD) is one of the most popular methods for creating a second order response surface model. Provided that k is the number of factors, CCD consists of the combination of2k two-level factorial
experiments with 2kaxis points or star points. In addition,
it includes nc center points. The factors included in the
model must be two-level at the least. The placement of axis points in the experimental design is given in the Table1. While the main effects and the first order interaction effects of the second order model to be created are obtained from the 2kexperiment, the curvilinearity of the system is tested by means of center points. The quadratic terms in the model are estimated by means of axis points [Tekindal et al., 2012; Myers and
Montgomery, 2002; Box and Draper,
1986;Neddermeijer,2000; Yalçınkaya and Bayhan, 2008]. Table 1. Central composite experimental design
1
x
x
2 …….x
ka
-
0 ……. 0a
+
0 ……. 0 0-
a
……. 0 0-
a
……. 0 0 0 …….-
a
0 0 …….+
a
Box-BehnkenDesignSuggested by Box and Behnkenin 1980,Box-Behnken design is an effective method for creating a second order response surface model. It is a method built upon balanced incompleted block experiments. In the Box-Behnken design, while the value of one of the factors is fixed at the central value, the combinations of all levels of other factors are applied [Tekindal et al., 2012; Myers and Montgomery, 2002; Kocabaş, 2001; Myers and Montgomery, 2004]. As shown in Table2, firstly the level of the factor C was fixed and the combinations of all levels of the factors A and B were applied. Then, the same procedures were performed by fixing the levels of the
factors B and A (respectively) at the center. The last columns of the design matrix include center point values.
Table 2. Three-Factor Box-Behnken design
Rank Box-Behnken Design
A B C 1 -1 -1 0 2 1 -1 0 3 -1 1 0 4 1 1 0 5 -1 0 -1 6 1 0 -1 7 -1 0 1 8 1 0 1 9 0 -1 -1 10 0 1 -1 11 0 -1 1 12 0 1 1 13 0 0 0 14 0 0 0 15 0 0 0 Data Set
In this study, the flour A and the flour B with two different characteristics (used in the baking of bread) obtained from a commercial mill and wheat bran were used as materials.
In the making of bread, on the basis of the weight of flour, 3% and 5% yeast (in two different ratios), 1.5% salt, 1.0% sugar, 1.0% oil, 10% and 20% bran(in two different ratios) and water in the amount determined via Forinograhg were used for preparing dough. Such dough was fermented and shaped in two different fermentation programs (20-10-30 minutes and 30-30-50 minutes). Then, it was baked in two different oven temperatures (2300
C
and 2500C
) at two different periods (25 minutes and 35 minutes). The volumes of bread samples were measured via volume measuring instrument 6 hours later taken from the oven. Based on the obtained value, the volume yield corresponding to 100 g of flour was calculated. [Anonymous, 1971;Özkaya, 2005].The effects of Flour Type, The Ratio of Bran and Yeast Added, Oven Temperature, The Duration of Remaining in the Oven, and Fermentation Time on volume were examined. The examination was carried out by means of Central Composite Design and Box-Behnken Design of response surface methodology. Minitab 16 package was used for the analyses. In that program, experimental model was created randomly in the first place. The analysis was conducted according to the determined design levels.
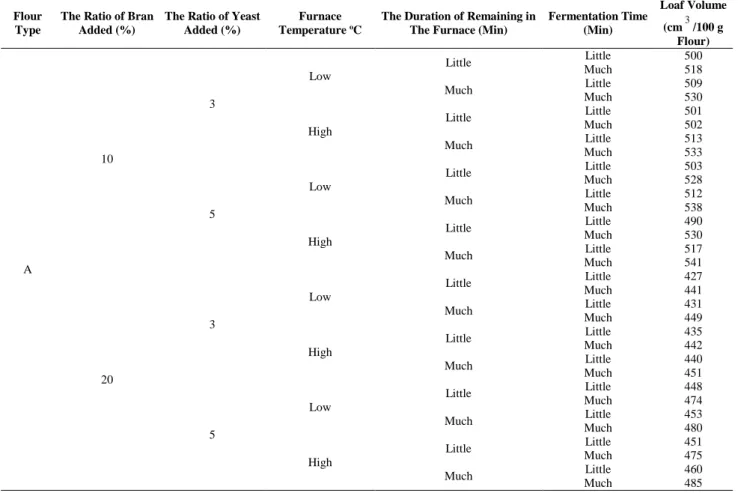
Table 3. Flour Type, The Ratio of Bran and Yeast Added, Furnace Temperature, The Duration of Remaining in the Oven, and
Fermentation Time in the Determination of Loaf
Flour Type
The Ratio of Bran Added (%)
The Ratio of Yeast Added (%)
Furnace Temperature oC
The Duration of Remaining in The Furnace (Min)
Fermentation Time (Min) Loaf Volume (cm3/100 g Flour) A 10 3 Low Little Little 500 Much 518 Much Little 509 Much 530 High Little Little 501 Much 502
Much Much Little 513 533
5 Low Little Little 503 Much 528 Much Little 512 Much 538 High Little Little 490 Much 530 Much Little 517 Much 541 20 3 Low Little Little 427 Much 441 Much Little 431 Much 449 High Little Little 435 Much 442 Much Little 440 Much 451 5 Low Little Little 448 Much 474
Much Much Little 453 480
High
Little Little 451
Much 475
Much Little 460
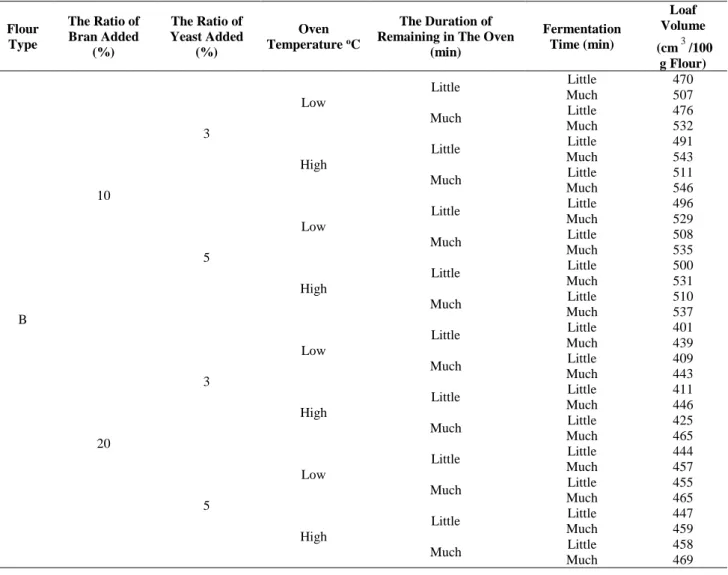
Table 4. Flour Type, The Ratio of Bran and Yeast Added, Oven Temperature, The Duration of Remaining in the Oven, and
Fermentation Time in the Determination of Loaf
Flour Type The Ratio of Bran Added (%) The Ratio of Yeast Added (%) Oven Temperature oC The Duration of Remaining in The Oven
(min) Fermentation Time (min) Loaf Volume (cm3/100 g Flour) B 10 3 Low Little Little 470 Much 507 Much Little 476 Much 532 High Little Little 491 Much 543 Much Little 511 Much 546 5 Low Little Little 496 Much 529 Much Little 508 Much 535 High Little Little 500 Much 531 Much Little 510 Much 537 20 3 Low Little Little 401 Much 439 Much Little 409 Much 443 High Little Little 411 Much 446 Much Little 425 Much 465 5 Low Little Little 444 Much 457 Much Little 455 Much 465 High Little Little 447 Much 459 Much Little 458 Much 469
RESULTS AND DISCUSSION
CCD design
According to the Table 3.1, in the CCD, the ratio of bran added, flour type, the ratio of yeast added, oven temperature, the duration of remaining in the oven, and fermentation time are significant factors that affect volume yield. In addition, R2= 80.7% shows that
regression equation explained variables by 80.7%.
Figure 1. ‘Nominal the best’ model in the CCD
Figure 2. The contour plot of the ‘the nominal the best’ model in
the CCD
According to the table of variance analysis, quadratic form came out to be significant at the end of response surface analysis.
Figure 1 and Figure 2 show that when ‘the nominal the best’ model is selected and the level of ratio of the yeast added is selected to be medium (i.e. 3 to 5), the targeted volume yield will be 200-300 (cm3/100 g flour).
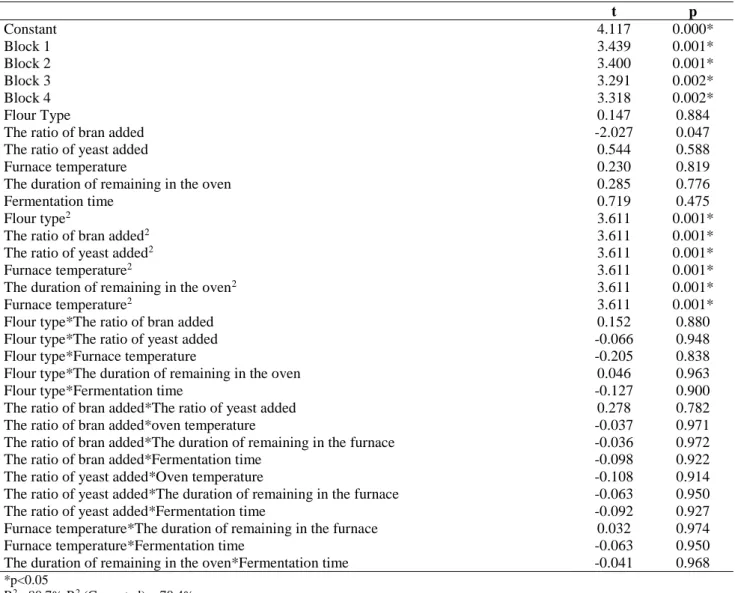
Table 5. Regression Analysis Results of the CCD t p Constant 4.117 0.000* Block 1 3.439 0.001* Block 2 3.400 0.001* Block 3 3.291 0.002* Block 4 3.318 0.002* Flour Type 0.147 0.884
The ratio of bran added -2.027 0.047
The ratio of yeast added 0.544 0.588
Furnace temperature 0.230 0.819
The duration of remaining in the oven 0.285 0.776
Fermentation time 0.719 0.475
Flour type2 3.611 0.001*
The ratio of bran added2 3.611 0.001*
The ratio of yeast added2 3.611 0.001*
Furnace temperature2 3.611 0.001*
The duration of remaining in the oven2 3.611 0.001*
Furnace temperature2 3.611 0.001*
Flour type*The ratio of bran added 0.152 0.880
Flour type*The ratio of yeast added -0.066 0.948
Flour type*Furnace temperature -0.205 0.838
Flour type*The duration of remaining in the oven 0.046 0.963
Flour type*Fermentation time -0.127 0.900
The ratio of bran added*The ratio of yeast added 0.278 0.782
The ratio of bran added*oven temperature -0.037 0.971
The ratio of bran added*The duration of remaining in the furnace -0.036 0.972
The ratio of bran added*Fermentation time -0.098 0.922
The ratio of yeast added*Oven temperature -0.108 0.914
The ratio of yeast added*The duration of remaining in the furnace -0.063 0.950
The ratio of yeast added*Fermentation time -0.092 0.927
Furnace temperature*The duration of remaining in the furnace 0.032 0.974
Furnace temperature*Fermentation time -0.063 0.950
The duration of remaining in the oven*Fermentation time -0.041 0.968
*p<0.05
R2= 80.7%,R2 (Corrected) = 70.4%
Table 6. Variance Analysis Results of the CCD
The Source of Variance
Degree of
Freedom Sum of Squares Mean of squares F p
Block 4 2644629 661157 45.21 0.000* Regression 27 903715 33471 2.29 0.004* Linear 6 74272 12379 0.85 0.540 Quadratic 6 826394 137732 9.42 0.000* Interaction 15 3048 203 0.01 0.999 Error 58 848254 14625 Total 89 *p<0.05
Figure 3. The response graphic of ‘the bigger the better’ model
in the CCD
Figure 4. The contour plot of ‘the bigger the better’ model
in the CCD
Figure 3 and Figure 4 show that when ‘the bigger the better’ model is selected and the level of ratio of the yeast added is selected to be high (i.e. 5), the targeted volume yield will be 400-500 (cm3/100 g flour).
Figure 5. The response graphic of ‘the smaller the better’ model
in the CCD
Figure 6. The contour plot of ‘the smaller the better’ model in
the CCD
Figure 5 and Figure 6 show that when ‘the smaller the better’ model is selected and the level of ratio of the yeast added is selected to be low (i.e. 3), the targeted volume yield will be 300-400 (cm3/100 g flour).
Figure 7. The ‘nominal the best’ model in the BDD
Figure 8. The contour plot of the ‘nominal the best’ model in the
BDD
Box Benhken Design
According to the Table 7, in BDD, the ratio of bran added, flour type, the ratio of yeast added, oven temperature (only in quadratic form), and fermentation time (only in quadratic form) are significant factors that affect volume yield. In addition, R2 = 89.64% shows that
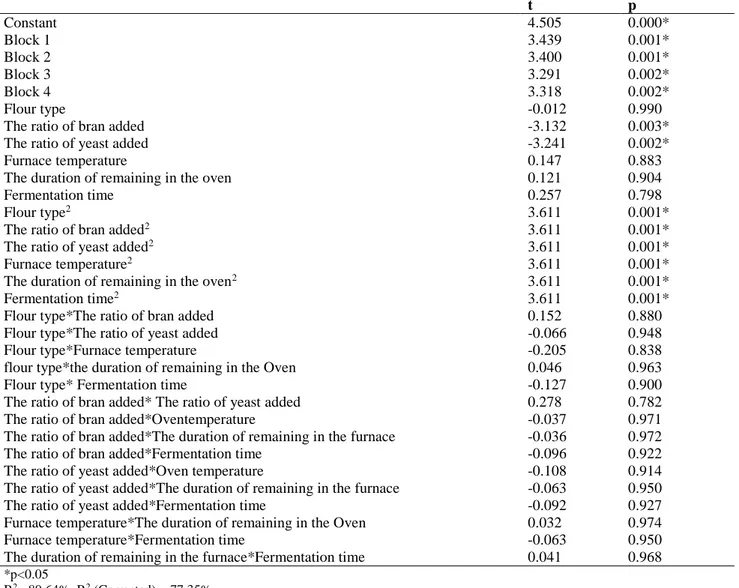
Table 7.Regression Analysis Results of the BBD t p Constant 4.505 0.000* Block 1 3.439 0.001* Block 2 3.400 0.001* Block 3 3.291 0.002* Block 4 3.318 0.002* Flour type -0.012 0.990
The ratio of bran added -3.132 0.003*
The ratio of yeast added -3.241 0.002*
Furnace temperature 0.147 0.883
The duration of remaining in the oven 0.121 0.904
Fermentation time 0.257 0.798
Flour type2 3.611 0.001*
The ratio of bran added2 3.611 0.001*
The ratio of yeast added2 3.611 0.001*
Furnace temperature2 3.611 0.001*
The duration of remaining in the oven2 3.611 0.001*
Fermentation time2 3.611 0.001*
Flour type*The ratio of bran added 0.152 0.880
Flour type*The ratio of yeast added -0.066 0.948
Flour type*Furnace temperature -0.205 0.838
flour type*the duration of remaining in the Oven 0.046 0.963
Flour type* Fermentation time -0.127 0.900
The ratio of bran added* The ratio of yeast added 0.278 0.782
The ratio of bran added*Oventemperature -0.037 0.971
The ratio of bran added*The duration of remaining in the furnace -0.036 0.972
The ratio of bran added*Fermentation time -0.096 0.922
The ratio of yeast added*Oven temperature -0.108 0.914
The ratio of yeast added*The duration of remaining in the furnace -0.063 0.950
The ratio of yeast added*Fermentation time -0.092 0.927
Furnace temperature*The duration of remaining in the Oven 0.032 0.974
Furnace temperature*Fermentation time -0.063 0.950
The duration of remaining in the furnace*Fermentation time 0.041 0.968
*p<0.05
R2= 89.64%, R2 (Corrected) = 77.35%
Table 8.Variance Analysis Results of the BBD
The Source of Variance The Degree of Freedom The sum of squares The mean of squares F p Block 4 2644629 661157 45.21 0.000* Regression 27 903715 33471 2.29 0.004* Linear 6 221877 36979 2.53 0.030* Quadratic 6 826394 137732 9.42 0.000* Interaction 15 3048 203 0.01 0.999 Error 58 848254 14625 Total 89 *p<0.05
sAccording to the table 8 of variance analysis, quadratic form and linear form came out to be significant at the end of response surface analysis. When both quadratic form and linear form come out to be significant, quadratic form is used.
Figure 7 and Figure 8 show that when the ‘nominal the best’ model is selected and flour type is ignored, the targeted volume yield will be less than 200 (cm3/100 g flour).
Figure 9. The response graphic of ‘the bigger the better’ model
in the BDD
Figure 10. The contour plot of the ‘nominal the best’ model in
the BDD
Figure 9 and Figure 10 show that when the ‘nominal the best’ model is selected and flour type is selected to be A, the targeted volume yield will be 400-600 (cm3/100 g
flour).
Figure 11. Response graphic of ‘the smaller the better’ model in
the BDD
Figure 12. The contour plot of ‘the smaller the better’ model in
the BDD
Figure 11 and Figure 12 show that when ‘the smaller the better’ model is selected and flour type is selected to be B, the targeted volume yield will be 300-400 (cm3/100 g flour).
Some researchers have reported that the volume data of bread change depending on the ratio of yeast added, volume yield increases as the ratio of yeast rises, and volume yield decreases as the ratio of yeast reduces [Pomerans et al.,1977; Akbaş, 2000; Çay, 2008].
The quality of flour is the most important factor that affects the quality of the bread to be produced [Özkaya, 2005;Çay, 2008]. The flour type A used in the present study was superior to the flour type B for ash content, protein content, gluten content and quality, and so on. As a result, the volume yield of the flour type A was found to be higher than the loaf volume of the floor type B.
Based on the results obtained through the response surface methodology, the items that affect volume yield fundamentally according to the results of the CCD (the ratio of bran added, flour type, the ratio of yeast added, oven temperature, the duration of remaining in the oven, and fermentation time)are in quadratic forms, but are not engaged in interaction. The CCD was used in all 3 surfaces of the ratio of bran added. The biggest or the smallest response surfaces were investigated, and the input variables
x
1,
x
2,....,
x
kto provide such values were determined. Based on the diversity of goal, all possible results were given.According to the CCD, the item that affects volume yield fundamentally is the ratio of bran added. Increasing or decreasing the ratio of bran added in accordance with our goal will directly increase or decrease the volume yield. Many researchers have reported that the volume yield of bread decreases as a result of the rise in the ratio of bran to be added to flour, and bran negatively affects the quality of bread [Pomerans et al.,1977; De Kock et al., 1999; Zhang and Moore, 1999]. According to the central composite design, it is seen that when the ‘nominal is the best’ model is selected and the level of ratio of the yeast added is selected to be medium (i.e. 3 to 5), the targeted volume yield will be 200-300 (cm3/100 g flour);when ‘the biggest the better’ model is selected and the level of ratio of the yeast added is selected to be high (i.e. 5), the targeted volume yield will be 400-500 (cm3/100 g flour);and when ‘the smaller the better’ model is selected and the level of ratio of the yeast added is selected to be low (i.e. 3), the targeted volume yield will be 300-400 (cm
3
/100 g flour).In addition,
R
2 = 80.7% shows that regression equation explains 80.7% of variation. This method provides savings for time and the amount of material by limiting the area at particular levels.In the BBD, the ratio of bran added, flour type, the ratio of yeast added, oven temperature (only in quadratic form), the duration of remaining in the ovrn (only in quadratic form), and fermentation time (only in quadratic form) were accepted to be significant factors that affected volume yield. In the BDD, the variable main effect was flour type instead of the ratio of yeast added. Thus, response graphic and contour plot were drawn based on flour type. According to the Box-Behnken design, it could be seen that when ‘the nomial the best’ model is selected and flour type is ignored, the targeted volume yield will be less than 200 (cm3/100 g flour);when ‘the biggest the better’ model is selected and flour type is selected to be A, the targeted volume yield will be 400-600 (cm3/100 g flour); and when ‘the smaller the better’ model is selected and flour type is selected to be B, the targeted volume yield will be 300-400 (cm3/100 g flour).
Furthermore,
R
2 = 89.64% variation indicates the equation explained variables 89.64% of the confusion.In the last two decades, response surface methodology has been widely applied in the field of food science and technology. Thanks to the response surface methodology, system modeling can be performed by means of simple empirical models, many variables that affect the response of the system can be examined collectively and simultaneously, and the response of process to the change in the operational parameters can be defined in the best way through the smallest number of experiments. One of the most significant reasons of selection the response surface methodology among other optimization methods in food processing is that it could be successfully applied in a wide range of food processes and it allows determining many optimal points by taking into consideration many responses. On the other hand, the most important disadvantage of response surface methodology is that experimental data are fitted into a quadratic polynomial model. Although all systems involving curvilinearity are not compatible with a quadratic polynomial model. In addition, the values estimated through model must definitely be confirmed experimentally, too.
This method provides savings for time and the amount of material by limiting the area at particular levels. Researcher may use the results of either the CCD or the BBD (whichever s/he deems suitable) according to the volume s/he wants to obtain.
LITERATURE CITED
Akbaş, E. 2000. Some of The Properties and The Amount of Phytic Acid on Cornbread Effects of Construction Methods. Master Thesis. Ankara University. Institute of Science and Technology. p 63. Ankara (in Turkish)
Anonymous 1971. Standart Methoden Fur Getraide Mehl Und Brot. Sewiterte AuflageIm. Verlag Moriztz Scheafer. Detmold.
Banga, J.R. Balsa-Canto, E., Moles, C.G., Alonso, A.A., 2003, Improving Food Processing Using Modern Optimization Methods. Trends Food Sci& Tech, 14: 131-144.
Bauer, W. B. Jr., Parnell, S. G., Mayers, A. D., 1999, “Response Surface Methodology As a Sensitivity Analysis Tool in A Decision Analysis”, Journal Of Multicriteria Decision Analysis, 8(3): 162-180.
Bayrak , H., B. Ozkaya, M.A. Tekindal. 2010. Productivity in the First Degree for the Optimum Point Determination of Factorial Trials: An application. Türkiye Klinikleri Biyoistatistik Dergisi [Turkey Clinics J Biostat ] 2(1) :18 – 27
Box, G.E.P. and N.R. Draper. 1986, “Empirical Model-Building and Response Surfaces”, John Wiley and Sons, 34-57, 304-381, 423-474.
Çay, P., 2008, Effect of Processing Amount of Phytic Acid Bran Bread. Master thesis. Ankara University. Institute of Science and Technology. p 105. Ankara (in Turkish).
De Kock, S., Taylor, S., S.R.N. Taylor. 1999. Effect of Heat Treatment and Particle Size of Different Brans on Loaf Volume of Brown Bread, Lebenesm. Wissu. Technol.: 32, p. 349-356.
Dobson, J.A. 1990. An Introduction Generalized Lineer Models, 2. ed. Chapman and Holls, 100-171.
Kocabaş, Z. 2001. An Application and Interpretation Of Second Order Response Surface Model. Ankara University Journal of Agricultural Sciences. 7: 121-128.
Koç B. and F. Kaymak-Ertekin. 2009. Response Surface Methodology and Food Processing Applications. Food Journal. 35:1, p.1-7
Maruyama, S.A., Palombini S.V., Claus, T., Carbonera, F., Montanher, P.F., de Souza, N.E., Visentainer, J.V., Gomes, S.T.M. Matsushita, M. 2013. Application of Box-Behnken Design to the Study of Fatty Acids and Antioxidant Activity from Enriched White Bread. Journal of The Brazilian Chemical Society. 24:9 1520-1529
Mladenov. V., Banjac. B., M. Mıloševıć. 2012. Evaluation of Yield and Seed Requirements Stability of Bread Wheat (Triticum aestivum L.) Via Ammi Model Turkish Journal of Field Crops, Volume: 17, No:2, page:203-207.
Myers R.H., Montgomery D.C., Vining G.G., Borror C.M., S.M. Kowalski. 2004. Response Surface Methodo¬logy: A Retrospective and Literature Survey. J Quality Tech. 36:53-77.
Myers, R. H. and D.C. Montgomery. 2002. Response Surface Methodology Process And Product Optimization Using Designed Experiments, John Wiley and Sons, 17-85, 203-303.
Neddermeijer, H. G, Oortmarssen, G. J., P. Nanda. 2000. A Frame Work For Response Surface Methodology for Simulation Optimization, Proceeding of the 2000 Winter Simulation Conference. 1: 129-136.
Özkaya, B. 2005. Fractions Received From Different Parts of The Mill Bran Bread Dough Rheological Properties and Impact on Quality, Food Technology Journal, 4;5 . p. 43-48 (in Turkish).
Pomerans, Y., Shagran, M., Finney, K.F., D.B.Bechtel.1977. Fibre in Breadmaking Effects On Functional Properties Cereal Chemistry. 54, p. 25-41.
Saguy I, Mishkin MA, M.Karel.1984. Optimizati¬on methods and available software. part1. CRC Critical RevFoodSci and Nutr. 20 (4): 275-299.
Tekindal M.A, Bayrak H., Özkaya B.,Y. Yavuz. 2012. Box- Behnken Experimental Design in Factorial Experiments: The Importance of Bread for Nutrition and Health Running Head, Turk J Field Crops, 17 : 115-123.
Yalçınkaya, O. and G. M. Bayhan. 2008. Modelling And Optimization Of Awarage Travel Time For A Metro Line By Simulation And Response Surface Methodology. European Journal of Operational Research. 10:10-16.
Zhang, D. and W.R Moore. 1999. Wheat Bran Particle Size Effects On Breadbaking Performance And Quality. Journal Of The Science Of Food And Agriculture: 79, p. 805-809.