1
A sustainable study of economic growth and development amidst ecological footprint: New insight from Nigerian Perspective
Edmund Ntom Udemba
Faculty of Economics Administrative and Social sciences, Istanbul Gelisim University, Istanbul, Turkey
Correspondence: Email: [email protected];
[email protected]; [email protected].
Tel: +905357808713
WhatsApp: +2347039678122; +905357808713
Funding
The author hereby declares that there is no form of funding received for this study.
Compliance with Ethical Standards
The author wishes to disclose here that there are no potential conflicts of interest at any level of this study.
Graphical Abstract
The graphical abstract depicts mostly the causality that exist among the variables of the study. The transmission is depicted with the red arrows that are pointing from one variable to other. Hence, a one-way (Uni-directional) transmission is passed from economic growth (GDP) to ecological footprint, from energy use to ecological footprint, from population to ecological footprint, from economic growth to energy use and from population to economic growth
2 Abstract
The current study presents the mitigation of Nigerian economic performance and ecological footprint with other selected variables in ascertainment of the contribution of the country in global fight to reduce global warming amidst competitive economic operations. The motivation behind
Agric FDI GDP IMPACTING EFP POP AND EU
Ecological
footprint
3
this is due to the fact that the country’s economy is majorly relying on two major sectors which are considered as emission-induced sectors. These sectors (petroleum and agricultural sector) are characterized by the excessive utilization of non-renewable sources of energy in operations. The findings from this study, both from the Autoregressive Distributed Lag (ARDL) and Granger Causality (GC) perspectives aligns with the first stage of the theory (scale effect). Hence, both the economic growth and ecological footprint are increasing in the same pace. Among the findings from the ARDL regression are: a positive relation amongst income (GDP per capita) and the selected independent variables (ecological footprint, agric, FDI, energy use). Also, a negative relationship is revealed amid income and population of the country The findings from the causality test are: A one-way (Uni-directional) transmission is passed from economic growth (GDP per capita) to ecological footprint, from energy use to ecological footprint, from population to ecological footprint, from economic growth to energy use and from population to economic growth. It is evident that almost all the variables are causing the ecological footprint which aligns with the findings on ARDL regression. This has paved way for a well-articulated policy framing from the authorities of Nigeria with focus on the operations of both petroleum and agriculture. From the findings of this study, a well-structured policy is expected to be framed to curtail the growth based emissions in the Nigeria.
Keywords: Ecological footprint; FDI; agricultural sector; energy use; GDP, ARDL; Nigeria JEL Codes: C32, C33, Q43, Q58
1. Introduction
The threat of Global warming has increase the volume of awareness from all works of life in quest to reduce the ugly situation facing the whole world. Many platforms and organization have been set up in line, and through the United Nations (UN) system and roadmap to achieving climate neutrality come 2020. The sole cause of the global warming is man activities on the surface of the earth which result to environmental degradation leading to global warming (McCright et al., 2000).
Since the emergence of the global warming, nations have been tasked to think and work towards the abatement of the global warming both on individual and collective manners. The climate change is a global phenomenon that has increased both the local and international alertness in curtailing the rising trend (Salinger et al., 2000). Emissions from different energy sources more
4
especially the fossil fuels, and other non-renewable energy sources are diffused into air as pollutant elements. These are capable of impacting both the environment and the health of the masses adversely. The emissions are not only into the air but also have access to water bodies and ecosystem which harm or poison the aquatic life and contaminate the clean water. The contamination of both the air and the water bodies impacts negatively on the society via poverty, starvation, living condition and the entire health of the population (Watson and Albritton, 2001). Economic growth has been identified as among many indicators that are considered triggers the horrendous effect of emission. Many economic activities which are all geared toward, and centered in economic growth give rise to pollutant emission (Abid, M. 2015). Such activities from different sectors (manufacturing sectors, agricultural sector, energy mining and petroleum sector) of the economy that are summed into economic growth are all stimulus to emission (Abid, M. 2015). These emissions from different sources and sectors of economy affects human health with different kinds of sicknesses like heart diseases, cancers and gaseous diseases (Pope and Dockery, 2006). Activities from manufacturing industry such as production processes, utilization of heavy duty machines with capacity of burning large quantity of fossil fuels, generating of electricity with coals and other fossil fuels, distribution of the goods from the point of production to the last or final consumer with trucks that emit carbon dioxide through exhaust pipe, disposal of the waste into water bodies constitute environmental dilapidation. The agricultural activities such as application of fertilizers and other chemicals, herders’ activities, land reclaiming, bush burning etc, constitute emissions. According to Ecological Footprint Network, (EFN, 2019), the ecological footprint accounts for built-up land, carbon emissions, cropland, fishing grounds, forestry products, and grazing land. The mentioned ecological factors are breaded in agricultural and economic activities which are part of emissions agents. Energy and Petroleum industry also contribute in emission production through exploration of oil and gas flaring. Most times the excavation and mining leads to oil spillage which constitute environmental pollution (environmental degradation) through poising of water bodies and rendering of soil infertile. This will affect the drinking water, pose dangers to human health and reduce the productivity of the agricultural sector.
The case of Nigerian economy with the domineering nature of agricultural and energy sector is considered enabling ground for dirty industrial operations. The major part of Nigerian export is dominated with oil related export which shows the major role the oil sector is playing to the
5
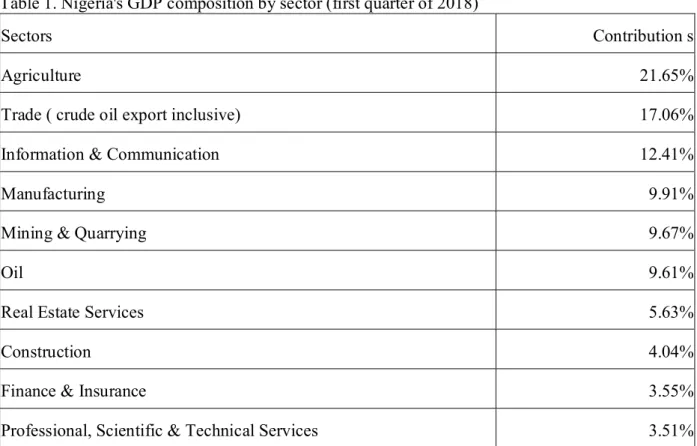
economic growth of Nigeria. According to National Bureau of Statistics, (NBS,2018), Nigeria earned N4.69 trillion (US$153.4 billion) from exports in the first quarter of 2018. Major part of the proceed was from sales of crude oil which made up to 76.3% in the mentioned period (January to March, 2018) amounted to N3.58 trillion (US$11.7 billion). Nevertheless, oil contributes less than 10% to the Nigerian GDP because most companies in the Nigerian oil sector are not domestic industries rather they are foreign companies that are operating on the ground of foreign investors to the host country (Nigeria). The summary of sectoral performance to the Nigerian economic growth is presented in a table below for a quick x-ray of author’s claim. Hence,
Table 1. Nigeria's GDP composition by sector (first quarter of 2018)
Sectors Contribution s
Agriculture 21.65%
Trade ( crude oil export inclusive) 17.06%
Information & Communication 12.41%
Manufacturing 9.91%
Mining & Quarrying 9.67%
Oil 9.61%
Real Estate Services 5.63%
Construction 4.04%
Finance & Insurance 3.55%
Professional, Scientific & Technical Services 3.51%
Estimates by the National Bureau of Statistics show the contribution of various sectors to the country's GDP between January and March 2018.
Source: National Bureau of Statistics
The energy industry as it consists of exploration and flaring of oil and gas, mining and quarrying is a great catalyst in emission inducement which most times constitute environmental degradations. Energy use is basic in the running of any meaningful economic activities, and the energy utilization tends to engineer pollution (environmental degradation) if not managed efficiently with a
6
sustainable source. Most Countries, in Africa like Nigeria engage more on non-renewable energy sources such as fossil fuel and coal in running their economic operations.
Figure1: Adverse effect to environmental via the crude oil exploration in Nigeria (Abi et al., 2009)
Source: Legit
Several authors have utilized different methods to research on the implication of economic growth to the environment through excessive utilization of fossil fuel energy sources. Sharma, (2011), observed that carbon emission is impacting positively to the economic growth (GDP). Omotor, (2015) identified a positive association between income (GDP per capita) and carbon emission for ECOWAS. Al-Mulali et al., (2015) found fossil fuel inducing pollution in his study for Vietnam. Balciliar et al., (2019) found equilibrium relnship between economic growth and pollution for the case of Pakistan. Bekun and Agboola, (2019) in their study found a long run equilibrium relationship between electricity and economic growth. Chen et al., (2016) observed a positive link amongst economic growth and pollution unhealthy environment. Balsalobre-Lorente et al., (2018) observed N-shaped connection between economic growth (GDP) and emission. Sarkodie and Stezov, (2019) found a valid pollution haven hypothesis with positive effect of energy use on pollution for emerging economies. Lee (2013) found in his work for the G20 countries a negative link between economic growth (GDP per capita) and pollution. In their study for Ghana, Twerefou et al., (2016) found a negative link between economic growth (GDP per capita) and pollution. Boopen et al., (2011) also found a negative connection between income level and pollution. Foreign Direct Investment (FDI) has been hypothesized with the belief that it contributes to pollution in the economy of the host countries. When the operations of the foreign companies impact unfavorable to the host environment, it is called pollution haven hypothesis (Cole and Elliot, 2003). But if their operations impact favorable to both the economy and the environment,
7
it is referred to as pollution halo hypothesis (Zarsky, 1999). Often times, the developing economies are seen with policies that will attract foreign investors to their economies. Such policies are believed to be framed towards inducing the domestic economic growth. These polices are sometime characterized with less stringent laws to the foreign investors which can be inform reduced tax, less hostile to the foreign investors as regards to the environmental regulations. Some of the energy intensive and emission incline companies who are confined or subjected to strict regulations of their home countries in carrying out their manufacturing operation will find solace in the economies with less stringent regulations. Their operations will amount to dirty productive operations with machines that utilized high level of fossil fuels there by constituting environmental degradations. Some authors have researched in these areas thereby confirming the impact of FDI to the environment of the host economies. Acharya (2009) found a positive relation between FDI and pollution. The work of Apergis and Payne, (2009) exposed inverted U shape. Paramati et al., (2017) found FDI impacting both energy use and the entire economic growth in their work on financing clean energy project for EU, G20 and OECD countries. Efficiency of Chinese economy is found improved by FDI by the study of Xing (2010). Hoang et al., (2010) in their study found that FDI is impacting economic growth through its additional capital accumulation. Also, Hansen and Rand, (2006) found a long term connection between economic growth and Investment. Reyath et al., (2009) found a connection between economic growth and FDI for Gulf countries. In the work of Karimi and Yusop, (2009) on the Malaysian economy, it was established that there was no causation among the FDI and economic performance (economic growth). Also, Irandoust, (2001) found that FDI has no causal relationship with economic growth. Chakraborty and Basu (2002) investigated the causality among FDI and economic growth, and observed a one-way transmission between FDI and economic growth.
Most studies targeting the unveiling and reduction of emission growth rate are focused on just one indicator in measuring the environmental quality. This practice may not be sufficient to uncover the real level of emission and the best source to limit or contain the climate change. Indicators like carbon emission, carbon nitroxide, methane and others have been used effectively in measuring the environmental quality in several studies with different approaches, but with less unified result and findings. This has left this particular area of environmental and energy field open for more studies and investigation.
8
Following the vacuum in the analyses of the root cause of the climate change and the measures in abating emissions because of inability of the right indicator in measuring the emission, the current study has adopted ecological footprint as the rightful variable in measuring emission instead of just one single indicator. The Uniqueness of this study is on growth-based model which is framed in line with the Environmental Kuznets Curve (EKC). This theory is simply based on the trade-off between the 3-stage economic growth and ecological performance. Most studies on Nigeria emission involvement have considered environment-based model which always give different interpretation to the emission of the country without much consideration of the economic growth of the country. Nigeria, as developing nation is expected to induce emission via its economic growth activities, and this is why it is essential to investigate the growth related emission of the country with a growth-based model. Also, the relevance of this study can be seen from Nigeria's position in Africa in the aspects of economic, agriculture, geography, politics among others is vital. Hence, the uniqueness of the country implies that some of the implications that are peculiar to Nigeria in the current study are relatively relevant to many of the Africa countries. For instance, the policies associated with natural resources such as crude oil are expectedly applicable to Sudan, Angola, and Libya. In terms of agriculture, most of the West African countries will share a similar approach to agricultural activities. The remaining parts of this study is organized as follow: Section 2, literature review. Section 3, Data and methodology. Section 4, Empirical analyses and discussion. Section 5, Conclusion and Policy recommendation.
2. Theoretical background
The basic theory of this work is rooted in the Environmental Kuznets Curve (EKC) with the adoption of Autoregressive Distributed Lag (ARDL) model. The first attempt of this theory was initiated by Simeon Kuznets (1966) in studying of the income inequality but was later adopted by some researchers in studying environmental impact of the economic development. The early scholars like Grossman and Krueger (1991); Shafik and Badypadhyay (1992) and Panayotou (1993) adopted this theory in studying the effect of economic development on the environment. This theory comes with classification or grouping of the economic growth in three (3) stages which effects to the environment are considered based on the reactions from the individuals or the masses. The first stage is scale effect or stage which is assumed associated with early stage of economic growth and development which characterized with competitive ideology. In this stage, countries
9
are more concern with economic performance with little or no concern to the environmental performance. This stage is mostly, associated with developing economies who have the target of becoming like the developed nations, and for this, competitive economic growth and development are adopted with adverse effect to the economy. The second stage is called technological expansion effect stage. This stage is characterized with transition from the scale effect to a more enlightened stage where the masses will start realizing the effect of their actions to the environment and their health, and will start advocating for quality environment. Structural programs that come with awareness of masses on the need for a less polluting environmental practice. At this stage, association between the economic growth and environment will change to a more favorable level thereby balancing the effect on both sides. The last stage is the composite effect stage. At this stage, the full awareness of the importance of a good environment quality and clean economic activities are observed and practiced. Most economic operation will be more advanced with advanced technologies that will sustain both the economic and environmental performance. Service sectors and research and development programs will champion the economic growth and development. The Research and Development (R&D) is given priority in the aspect of technological innovation which paves way for the adoption of clean productive activities with improved technology that can take the shape of renewable energy mix. R&D is among the validated avenues of attaining technological progress and innovation which act as means of attaining low carbon economy (Lin and Du, 2017; Hu et al., 2017& Huang et al 2018; XU et al., 2019). This present work borrowed from the EKC insight but with deviation from its modelling that involves quadratic style of income. Many scholars have criticized the style of applying multiple effect of income in the traditional EKC model. They deviate from this and apply models that are more linear in approach and found a more robust result without prejudice. Scholars like Musolesi et al., (2010); Gali (1998); Hübler and Keller 2010, b; Sadorsky 2011; Selden and Song (1994) Move a bit further froman old style of the EKC model, and applied the model where GDP remains only one with other incorporated variables. Upon this, the author has decided to perform his study with a linear ARDL- Bounds testing model.
10 3. Data and Methodology
3.1. Data
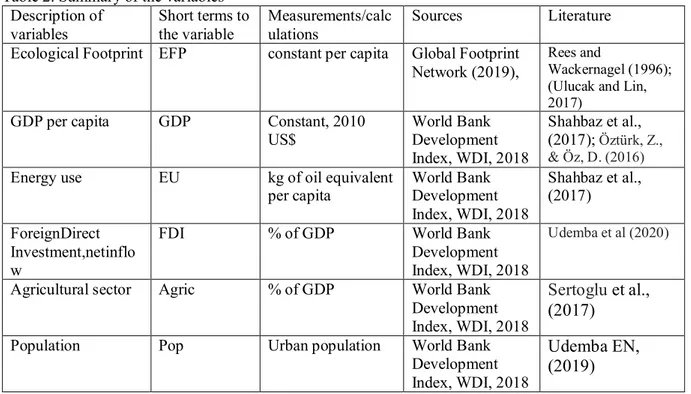
Nigerian annual data of 1981-2018 is employed for this study. The data with the exception of Ecological Footprint is sourced from the World Development Indicator (WDI, 2019). Ecological footprint data is sourced from the Global Footprint Network (2019 updated). The ecological footprint as utilized in this study is indexed and comprises of six (6) different variables (built-up land; carbon emission; cropland; fishing grounds; forestry products and grazing land.) that are summed up into one variable called ecological footprint. The adoption of ecological footprint as indicator to measure the environment gives a comprehensive and detailed insight to the quality of the environment unlike other single variables such as carbon emission or greenhouse gas. Apart from the ecological footprint (per capita) variable, other variables that are employed in this study are Gross Domestic Product (GDP) per capita (constant 2010 US$), energy use (kg of oil equivalent per capita), agricultural sector (forestry and fishing value added % gdp), Foreign Direct Investment, net inflow (%gdp), and population (urban). Variables are expressed in logarithm form except agriculture and FDI which are already in percentage to gdp. Information about the data is shown in the table below.
Table 2. Summary of the variables Description of variables Short terms to the variable Measurements/calc ulations Sources Literature Ecological Footprint EFP constant per capita Global Footprint
Network (2019),
Rees and
Wackernagel (1996); (Ulucak and Lin, 2017)
GDP per capita GDP Constant, 2010 US$ World Bank Development Index, WDI, 2018 Shahbaz et al., (2017); Öztürk, Z., & Öz, D. (2016)
Energy use EU kg of oil equivalent per capita World Bank Development Index, WDI, 2018 Shahbaz et al., (2017) ForeignDirect Investment,netinflo w
FDI % of GDP World Bank
Development Index, WDI, 2018
Udemba et al (2020)
Agricultural sector Agric % of GDP World Bank Development Index, WDI, 2018
Sertoglu et al., (2017)
Population Pop Urban population World Bank Development Index, WDI, 2018
Udemba EN, (2019) Source: Authors compilation
11 3.2 Methodology
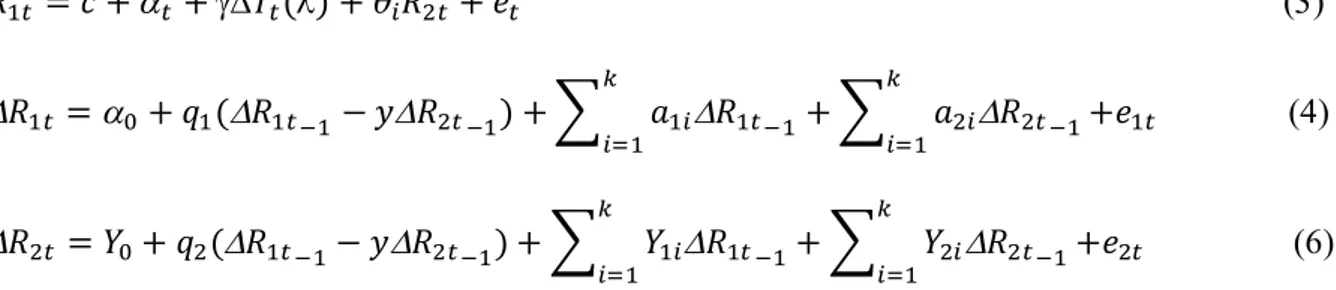
Different methods have been adopted in this study to give a clear and distinctive investigation into the chosen topic. The current paper adopts the following methods: Descriptive statistics, stationarity tests, optimal lag selection, Linear Autoregressive Distributive Lag (ARDL) with Bounds testing, and Granger Causality (GC) tests. The present study adopts the descriptive system of statistics to ascertain the normality and distribution of the data employed in this study. Stationarity is very essential whenever a time series analyses is undertaken. For the test of stationarity, the author applies the basic approaches for the unit root testing such as Augmented Dickey-Fuller test (ADF, 1979), Philip-perron, (1990) test and Kwiatkwoski Philip-Schmidt-Shin (KPSS, 1992). Also, structural break test is applied as a robust check to the traditional methods of testing for stationarity. Author obtained the optimal lag with the Akaike Information Criterion (AIC) for the check of the maximum lag to apply in this study. A linear regression analyses was also undertaken in this research for the purpose of dictating the linear relationship that exist among the selected variables. Autoregressive Distributed Lag (ARDL) with Bounds testing by Pesaran and Shin, (1998) and Pesaran et al., (2001) were used for this purpose. The model of this study is built on Pesaran and Shin, (1998) and Pesaran et al., (2001) as follows:
= + + + + + + + (1)
= 0 + + + + + + +
∑ + ∑ + ∑ + ∑ + ∑ +
∑ + + (2)
Equation 1. represents the econometric specification of ARDL equation and model, while the equation 2 is the expansion of the ARDL model in equation 1 to have expression that contains both the short run (error correction) and long run (ARDL-Bounds testing). GDP, EFP, FDI, AGRIC, EU and POP represent log of GDP per capita, log of ecological footprint per capita, Foreign Direct Investment, net inflow, agricultural sector, log of energy use and log of population. and in Equation 2 represent the long run and short run coefficients of the model. , represent 1st Diff of the variables in the model, speed of convergence over a long history of time and the error term respectively. Before the estimation of the linear autoregressive distributed lag, a cointegration/long run equilibrium
12
analyses is established via Bounds testing. The cointegration is determined by comparing the F-stats with the critical values of upper and lower bounds. Cointegration is established when the value of F-stat is greater than the upper bounds. But this is refuted when F-stats is displayed a value less than upper and lower bounds, while the inconclusive result is established when the value of F-stats fall in between the lower and upper bounds. This tested alongside the null and alternative hypothesis. The null hypothesis states that there is no cointegration, while the alternative hypothesis states that there is cointegration. Null hypothesis is represented as
H0 : = = = = = = = 0 whilethe alternative hypothesis is represented
as H1 : = = = = = = 0.
4. Empirical results and discussions
Empirical results of the adopted methods are presented and discussed in this section starting with the descriptive statistics and stationarity estimate.
4.1. Descriptive statistics
The output in the Table 1 below depicts descriptive statistics with the outcomes of the both population, GDP and energy use showing the highest values of mean, media and maximum. While the values of ecological footprint and FDI show are the lesser values. The result shows both negative and positive numbers in the case of skewness with all below 3 which satisfied the normality property of the data.
Table 1. Summary of Statistics
Variables EFP GDP FDI AGRIC EU POPU
Mean 1.093473 1758.613 1.571703 22.86120 641.5333 47928799 Median 1.169696 1548.288 1.266578 22.04733 698.8326 41757333 Maximum 1.383641 2563.900 5.790847 36.96508 798.6302 98611179 Minimum 0.000000 1324.297 0.257422 12.24041 0.000000 17103116 Std. Dev. 0.279299 439.8797 1.243151 4.764365 225.5234 23959086 Skewness -3.184516 0.655490 1.705011 0.438553 -2.462322 0.585221 Kurtosis 13.13279 1.830744 5.937832 4.422711 7.301437 2.173465
13
Jarque-Bera 226.7936 4.885897 32.07691 4.422913 67.69459 3.250730 Probability 0.000000 0.086904 0.000000 0.109541 0.000000 0.196840
Sum 41.55196 66827.29 59.72473 868.7255 24378.27 1.82E+09 Sum Sq. Dev. 2.886301 7159284. 57.18066 839.8694 1881850. 2.12E+16
Observations 38 38 38 38 38 38
Sources: Prepared by the author
4.2. Stationarity tests
Conventional approaches were adopted at first to test the stationarity of the selected variables. Approaches such as ADF, 1979, Philip-perron , (1990) and KPSS, (1992) were adopted for this purpose, and the outcomes shows the mixed order of integration (i.e. l(1)&l(0)). Apart from the findings from the test of the stationarity with the conventional approach, structural break test was employed to account for the shocks that are capable for disturbing the stationarity of the variables used in this study. Without this additional test, the conventional approach is limited on the aspect of uncovering the shocks that are capable of leaving a permanent shock to the economy. The findings from the test with this approach accounted for the shocks in the following years; 1990; 1994; 1995; 1998; 2001;2002; 2005;2013; 2014 and 2015. Nigeria economic performance faced a shock from external debt and excessive debt maintenance that put a perpetual shock to the entire economy within the periods of 1990’s which was extended to 2000’s. The debt was not utilized well in the areas of capital project that would have sustained the economy in long run, instead it founds its way into individual pockets through the act of corruption. This exposes the economy to a serious setback and left a sock to the economy. Within these periods (1998; 2001;2002; 2005;2013) as accommodated from the shock test, Nigerian economy has experienced a major privatization policy that is very remarkable in the communication sector which brought a tremendous change that affects the entire economy. This policy ushered in many telecommunication companies into the communication industry of the country. Great shocks were recorded in the economy from the petroleum sector within the periods of 2011 and 2014. The
14
shocks that affected both the production capacity of the country and the market price of crude oil. The region where the exploration of Nigerian crude oil is situated is considered a death-trap to both the workers of the multinational companies into oil business and the locals. The region faced environmental degenerated issue through the spilling of crude into the water bodies and the soil. These environmental factors which affect the drinkable water and the agricultural performance in those areas were instrumental to hostile behaviors of the youths from the region to the investors whose activities are located in those areas. This contributed to the abandonment of the oil production because of the fear of death and this reduced the quantity of the crude oil produced in those periods. Not only was the quantity of oil produced affected but oil price was crashed in 2014. This equally brought a major shock to the economy of the country through a dilapidated reserve and leaving and exposing the economy to borrowing. The few outlined shocks here were all accommodated in the structural break test. The findings of both the conventional stationarity test and the break test are presented in the Tables 2&3.
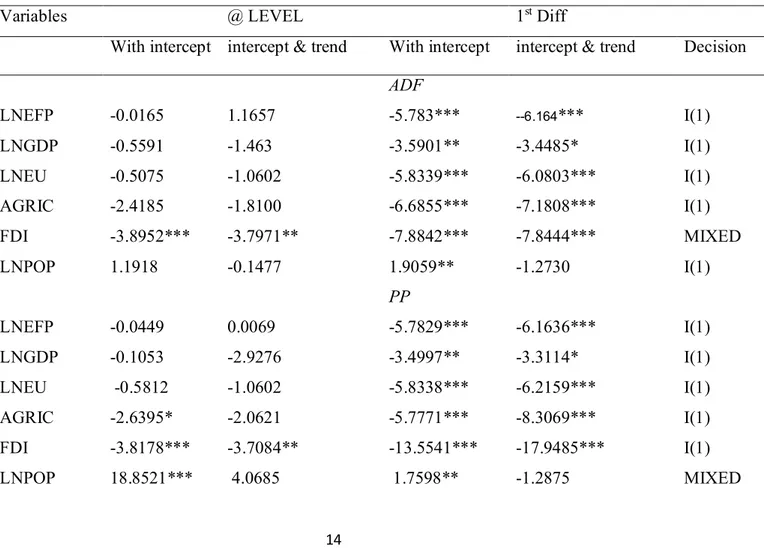
Table 2. Stationarity test
Variables @ LEVEL 1st Diff
With intercept intercept & trend With intercept intercept & trend Decision ADF LNEFP -0.0165 1.1657 -5.783*** --6.164*** I(1) LNGDP -0.5591 -1.463 -3.5901** -3.4485* I(1) LNEU -0.5075 -1.0602 -5.8339*** -6.0803*** I(1) AGRIC -2.4185 -1.8100 -6.6855*** -7.1808*** I(1) FDI -3.8952*** -3.7971** -7.8842*** -7.8444*** MIXED LNPOP 1.1918 -0.1477 1.9059** -1.2730 I(1) PP LNEFP -0.0449 0.0069 -5.7829*** -6.1636*** I(1) LNGDP -0.1053 -2.9276 -3.4997** -3.3114* I(1) LNEU -0.5812 -1.0602 -5.8338*** -6.2159*** I(1) AGRIC -2.6395* -2.0621 -5.7771*** -8.3069*** I(1) FDI -3.8178*** -3.7084** -13.5541*** -17.9485*** I(1) LNPOP 18.8521*** 4.0685 1.7598** -1.2875 MIXED
15 KPSS LNEFP 0.1896 0.1752** 0.3501* 0.1350* LNGDP 0.5889** 0.1767** 0.3772* 0.1376* LNEU 0.2939 0.1448* 0.2566 0.1165 AGRIC 0.3319 0.2131** 0.5000** 0.2858*** FDI 0.1533 0.1424* 0.3502* 0.2747*** LNPOP 0.7282** 0.1992** 0.6933** 0.1761**
Notes: a: (*) Significant@ 10%; (**) Significant @ 5%; (***) Significant @ 1%( b): P-value according to (1) Maclean et al., (1996) one-sided p-values (2) KPSS (1992)
Source: Authors computation
Table 3. Structural break test
Variable ADF P-value Lag Break date CV(1%) CV(5%)
Level LNGDP -3.164 0.933 3 1990 -5.719 -5.176 LNEFP -5.366 < 0.03** 3 2013 -5.719 -5.176 LNEU -23.461 < 0.01 *** 3 2014 -5.719 -5.176 Agric -7.029 < 0.01 *** 3 2005 -5.719 -5.176 FDI -6.664 < 0.01 *** 3 1994 -5.719 -5.176 LNPOP -2.273 > 0.99 3 1998 -5.719 -5.176 1st Diff LNGDP -4.665 0.168 3 2001 -5.719 -5.176 LNEFP -12.563 < 0.01 *** 3 2015 -5.719 -5.176 LNEU -42.548 < 0.01*** 3 2014 -5.719 -5.176 Agric -6.164 < 0.01*** 3 2002 -5.719 -5.176 FDI -9.842 < 0.01*** 3 1995 -5.719 -5.176 LNPOP -6.212 < 0.01*** 3 1990 -5.719 -5.176
Notes: a: (*) Significant at the 10%; (**) Significant at the 5%; (***) Significant at the 1% Source: Authors computation
16
Table 4 below displayed the outputs of the linear ARDL-Bounds testing with the diagnostic tests. From the output R-square and adjusted R-square are 0.954 and 0.908 respectively. The output shows that the independent variables (EFP, AGRIC, FDI, EU and POP) explain 95.4% (0.954) of the dependent variable (economic growth, GDP Per capita). The rest of the variation in the growth-pollution model are accounted by the error term. Durbin Watson (DW) output is 2.97 which falls with the expected range to confirm the absence of autocorrelation. This means that the model and the analyses are free from the problem of autocorrelation. The heteroscedasticity and serial correlation outputs were also displayed in the table which shows that model is free from the problems of heteroscedasticity and serial correlation. Among the diagnostic output shown immediately after the table is the reliability and stability test with CUSUM and CUSUM square. The test proved that the model is reliable and stable with the red line from the output well bounded inside the two blue lines. This output appears in the Figures 2&3 that come immediately after the linear regression table. Among the test presented in the ARDL table are the F-stats and t-stats for determining the cointegration and the long run relationsip amongst the selected variables. From the finding, it is established that the null hypothesis of no cointegration is rejected with the significant at 1%. The optimal maximum lag adopted in this study is 3 which was established with the application of Akaike Information Criterion (AIC). According to the error correction output, the speed of adjustment will occur at -0.681361. With the negative outcome which is highly significant, the outcome equally establishes the fact that there is a long run relationship amongst the variables. Also, this confirms the likelihood of speed of convergence in the long run period. ARDL findings are as following: A positive (elasticity) and significant connection is established between economic growth (GDP per capita) and ecological footprint in both short and long run respectively. This supposes that emission is inducing the economic growth. This can be the case when the host country is bent on achieving economic growth with less concern on the quality of the environment. This could be seen where the utilization of excessive non-renewable energy in the operation of the economic activities in Nigeria is impacting favorable to the economic growth while impacting unfavorably to the environment. The case of Nigeria is not surprising, especially when some indicators like FDI is impacting the economic performance favorably, and it is on record that most sectors that accommodate FDI are emission inducing in nature. Such sectors are petroleum and gas industries. This finding simply exposed that Nigeria economic growth is still at
17
the scale effect stage according to EKC postulation where both economic growth and environmental degradation is rising at the same time. This is numerically put as 1% increase in ecological footprint leading to about 0.05 increase in economic growth. This finding is in line with the findings of Udemba EN, (2019) for China; Udemba et al., (2019) for Indonesia; Fei et al., (2011) and Huanying Cui, (2016). Udemba et al., (2020). Again, a positively and significant association among economic growth (GDP per capita) and FDI both in short and long path is established. This simply means that investment from abroad is impacting favorably to the economic performance of Nigeria. This shows the ability of Nigerian economy to attract foreign investors is helping the economic performance of the country as the finding revealed the positive link between economic growth (GDP per capita) and FDI. This is a good trend for the development and growth history of Nigerian economy. Numerically, a 1% increase in FDI will lead to increase in economic growth (GDP) by 9.72%. This outcome is in support of the outcomes of Udemba et al., (2019) for the case of Indonesia; Udemba EN, (2019) for China; Shahbaz et al., (2019). Another finding of this study is the establishment of positive and significant link between economic growth (GDP per capita) and agriculture. This a typical of Nigeria situation where more than 70% of the population are into agriculture either subsistence or mechanized farming. According to CIA, (2012) agriculture contributes about 40% of the economic growth (GDP) and engages about 70% of the population (working population) in Nigeria. Even before the commencements of crude oil exploration and production in Nigeria, agriculture has been the sustainer of the economy. Numerically, a 1% increase of agriculture will lead to 11% approximately increase in the economic growth (GDP per capita) of Nigeria. This outcome is in consonance with findings of inusa et al., (2018); Izuchukwu O, (2011); Mathew and Mordecia, (2016); Sertoglu et al., (2017); Oyinbo and Rekwot, (2014). Furthermore, a positive (elasticity) and negative (elasticity) all significant relationships were established between economic growth (GDP per capita) and energy use, and between population and the economic growth (GDP per capita) both in short and long run respectively. This is supposed to mean that as energy consumption is increasing, the economic growth is equally growing. Also, as the population is increasing, the economic performance is affected negatively. This means adverse relationship between economic growth (GDP per capita) and population. This finding as it concerns energy use and economic growth is in line with the findings of Udemba EN, (2019) for China; Udemba et al., (2019) for Indonesia. Numerically, a
18
1% rise in energy use will increase economic growth (GDP per capita) by 0.09% approximately. Also, a 1% increase in population will lead to a decrease in income (GDP) by-0.000222. Table 4. ARDL assessments of GDP model
Variables Coefficients SE t-statistics P-value
Short-path D(LEFP) 0.0506 0.0106 4.771806 0.0005*** D(FDI) 9.727919 3.444396 2.824274 0.0153** D(AGRIC) 11.12862 2.220639 5.011448 0.0003*** D(LEU) 0.088703 0.039040 2.272114 0.0423** D(LPOP) -0.000222 5.67E-05 -3.907680 0.0021*** CointEq(-1)* -0.681361 0.081436 -8.366851 0.0000*** Long-path LEFP 0.0506 0.0179 2.831550 0.0151** FDI 9.727919 5.407344 1.799020 0.0972* AGRIC 11.12862 3.118111 3.569025 0.0039*** LEU 0.088703 0.039040 2.272114 0.0423** LPOP -0.000222 8.40E-05 -2.636023 0.0217** C 349.5022 203.5675 1.716886 0.1117 R2 0.999568 Adj.R2 0.997275 F-stat 600.171 P-value 0.000000 D.Watson 2.97 Bound test(Long-path)
F-statistics 8.235788*** K=5,@ 1% I(0)bound=4.3 I(1)bound=6.04 T-statistics -4.888*** K=5,@1% I(0)bound= -3.4 I(1)bound= -4.8 Wald test(short-path) R2 Adj2 0.954 0.908 F-statistics 20.840***
19
P-value 0.000
Serial Correlation test
F-statistics 6.164 R-square 19.324 P-value 0.018 Heteroscedasticity Test F-statistics 0.4601 R-square 0.3871 P-value 1.0000
Note: *, **, *** Denotes rejection of the null hypothesis at the 1%, 5% and 10% Sources: Authors computation.
4.4. Diagnostic tests (CUSUM and CUSUM of squares)
-12 -8 -4 0 4 8 12 07 08 09 10 11 12 13 14 15 16 17 18 CUSUM 5% Significance C U S U M Iteration -0.4 0.0 0.4 0.8 1.2 1.6 07 08 09 10 11 12 13 14 15 16 17 18
CUSUM of Squares 5% Significance
C U S U M S Q U A R E Iteration
20
Figure 2: CUSUM residual graphical plot (Top image) and Figure 3: CUSUM square residual graphical plot (Bottom image)
4.5. Granger Causality test
Granger causality was adopted in this study to give explicit meaning to the direction of transmission amongst the selected variables which the conventional or traditional linear regression lacks the ability to do. It is not enough to identify the positive or negative relationship between the selected variables, it is essential to identify which variable is impacting or transmitting directly to the other variable. This will help policy makers in framing the policy to will bring the needed changes. Granger causality give a better ground in exposing the transmission (Uni-directional or Bi-directional) amongst the selected variables. Gregory Hansen (1996) two-stage approach was utilized by the author in modelling the granger causality analyses, and is expressed as following:
= + + () + + (3)
= + ( − ) + + + (4)
= + ( − ) + + + (6)
Equation 3 shows that and are integrated of same order I(1). denotes a set of variables and ()=1 for t> T, or else ()=0. = / means a lasting shock where the structural break
lies. With the presence of long path via unit root test and the establishment of order of integration, causality test can be explained. Unit root test is employed to check if in equation (3) is integrated in order of I(1) or I(0). Long path (cointegration) occur between and where is integrated in same order. Once, this numerical property of confirmed, the Granger causality approach is applied.
21
Null Hypothesis: Causality F-stat Prob Remark Paths Decision
EFP does not Granger cause GDP GDP does not Granger cause EFP
YES 0.694 8.810 0.5074 0.009*** Uni-direction GDPEFP REJECT H0
EU does not Granger cause EFP
EFP does not Granger cause EU YES
10.81 0.093 2.E-14*** 0.9110 Uni-direction EUEFP REJECT H0
FDI does not Granger cause EFP
EFP does not Granger cause FDI NO
0.521 0.558 0.599 0.578 Uni-direction FDIEFP ACCEPT H0
AGR does not Granger cause EFP EFP does not Granger cause AGR NO
0.827 0.192 0.447 0.827 Uni-direction AGREPP ACCEPT H0
POP does not Granger cause EFP
EFP does not Granger cause POP YES
3.524 1.495 0.0418** 0.2400 Uni-direction POPEPP; REJECT H0
EU does not Granger cause GDP
GDP does not Granger cause EU YES
1.899 2.900 0.167 0.070* Uni-direction GDPEU; REJECT H0
FDIdoes not Granger cause GDP GDP does not Granger cause FDI NO
0.95063 1.53641 0.3975 0.2311 NEUTRAL GDPFDI ACCEPT H0
AGRdoes not Granger cause GDP GDP does not Granger cause AGR NO
1.281 0.76272 0.2921 0.4749 NEUTRA GDPAGR; ACCEPT H0
POPdoes not Granger cause GDP GDP does not Granger cause POP YES
10.7788 1.04943 0.0003*** 0.3622 NEUTRAL POPGDP REJECT H0
Notes: The decision to reject or accept the hypothesis is made at 5%. Remark paths point at the direction of the causal effects. ***p<0.01, **p<0.05, *p<0.10.
Granger causality output shows the direct transmission that passes amongst the variables. The findings are not different from the findings of the linear regression of the ARDL.The findings as displayed in the Table 5 give credence to the findings of the linear relationship amongst the variables and to the expectations of the authors. The findings from the causality test are: A one-way (Uni-directional) transmission is passed from economic growth (GDP) to ecological footprint, from energy use to ecological footprint, from population to ecological footprint, from economic growth to energy use and from population to economic growth. This is in line with the findings of
22
the study the author on Chinese economy (Udemba EN, 2019); Shahbaz et al., (2013); Aceleanu et al., (2017).
5. Conclusion and Policy recommendation
The current study presents the mitigation of Nigerian economic performance and ecological footprint with other selected variables in ascertainment of the contribution of the country in global fight to reduce global warming amidst competitive economic operations. The motivation behind this is due to the fact that the country’s economy is majorly relying on two major sectors which are considered as emission-induced sectors. These sectors (petroleum and agricultural sector) are characterized by the excessive utilization of non-renewable sources of energy in operations. With consideration to Environmental Kuznets Curve (EKC) postulations about the economic development and environment, Nigeria as a developing economy is presumed to be running its economy at the expense of the environment. The findings from this study, both from the ARDL and causality perspectives aligns with the first stage of the theory (scale effect). Hence, both the economic growth and ecological footprint are increasing in the same pace. Among the findings from the ARDL regression are: a positive relation amongst income and the selected independent variables (EFP, AGRIC, FDI, EU). Also, a negative association is established among income and population of the country. From granger causality finding, we observed population is granger causing both the economic growth and ecological footprint. This means that population is sensitive to both economic and environmental performance of Nigeria. Hence, population is growing and the economic growth is decreasing according to the findings from ARDL, and population is transmitting directly to the economic growth in causality findings. Also, among the findings is economic growth granger causing both the energy use and ecological footprint. This is explaining the findings from the ARDL where positive links are established between economic growth and ecological footprint, and between economic growth and energy use. It is agreeable with the finding that economic operations in Nigeria consume more into the energy sources (non-renewable energy sources), and this apparently induces the ecological footprint which impacts negatively on the environment. It is evident that almost all the variables are causing the ecological footprint which aligns with the findings on ARDL regression. This has paved way for a well-articulated policy framing from the authorities of Nigeria with focus on the findings of this estimations.
23
From the findings of this study, a well-structured policy is expected to be framed to curtail the growth based emissions in the Nigeria. This study has proven that Nigeria is in great need of a sustainable development that assures both great performance of both economy and the environment. Policies that involve national sustainable development strategy which anchored on economic, social and environmental dimensions should be explored. The target should be for a better practice that will ensure the integration of the three dimensions to reduce a tradeoff between the economic growth and environmental quality. Practices such as the identifying and adoption of alternative cleaner energy sources, and monitored economic policies to regulate the activities in the major economic sectors (agriculture and petroleum). There is a need for an awareness towards the implication of increase in population and the need for birth control. Renewable sources such as solar, wind power, hydropower, geothermal and ocean power should be considered cleaner, and alternatives to the fossil fuel energy in energy utilization in economic operations.
Conclusively, Nigeria as a country has more prospects of maintaining sustainable development both in economic and environmental operations.
Appendix
Definition of terms
Terms Full meaning
ARDL Autoregressive Distributed Lag
NARDL Nonlinear Autoregressive Distributed Lag
FDI Foreign Direct Investment.
R&D Research and Development
GC Granger Causality
GDP Gross Domestic Product (rep. as GDP per
capita)
EFP=ecological footprint Ecological Footprint (The Global Footprint Network (2018) describes the ecological footprint as “a measure of how much area of biologically productive land and water an individual, population, or activity requires to
24
produce all the resources it consumes and to absorb the waste it generates, using
prevailing technology and resource management practices).
C02 = carbon emission Carbon emission (According to World Bank, 2018, Carbon dioxide emissions are those stemming from the burning of fossil fuels and the manufacture of cement. They include carbon dioxide produced during consumption ofsolid, liquid, and gas fuels and gas flaring.) Pollution = environmental degradation According to Environmental Management,
2017 “Environmental pollution is defined as "the contamination of the physical and biological components of the
earth/atmosphere system to such an extent that normal environmental processes are adversely affected.".
AIC Akaike Information Criterion
ADF Augmented Dickey-Fuller test
PP Philip-perron,
KPSS Kwiatkwoski Philip-Schmidt-Shin
EU Energy use
DW Durbin Watson
POP Population
CUSUM and CUSUM square Cumulative Sum and Cumulative Sum Square
References
Abid, M. (2015). The close relationship between informal economic growth and carbon emissions in Tunisia since 1980: The (ir) relevance of structural breaks. Sustainable Cities and Society, 15, 11-21.
Abi, T. A., and P. C. Nwosu. "The effect of oil spillage on the soil of Eleme in Rivers State of the Niger Delta area of Nigeria." Res. J. Environ. Sci 3.3 (2009): 316-320.
Aceleanu, M. I., Șerban, A. C., Pociovălișteanu, D. M., & Dimian, G. C. (2017). Renewable energy: A way for a sustainable development in Romania. Energy Sources, Part B: Economics,
Planning, and Policy, 12(11), 958-963.
Al-Mulali, U., Saboori, B., & Ozturk, I. (2015). Investigating the environmental Kuznets curve hypothesis in Vietnam. Energy Policy, 76, 123-131.
25
Apergis, N., & Payne, J. E. (2009). CO2 emissions, energy usage, and output in Central America. Energy Policy, 37(8), 3282-3286.
Balcilar, M., Bekun, F. V., & Uzuner, G. (2019). Revisiting the economic growth and electricity consumption nexus in Pakistan. Environmental Science and Pollution Research, 26(12), 12158-12170.
Balsalobre-Lorente, D., Shahbaz, M., Roubaud, D., & Farhani, S. (2018). How economic growth, renewable electricity and natural resources contribute to CO2 emissions?. Energy Policy, 113, 356-367.
Bekun, F. V., & Agboola, M. O. (2019). Electricity consumption and economic growth nexus: evidence from Maki cointegration. Eng Econ, 30(1), 14-23.
Boopen, S., & Vinesh, S. (2011, December). On the relationship between CO2 emissions and economic growth: the Mauritian experience. In University of Mauritius, Mauritius Environment
Outlook Report, http://www. csae. ox. ac. uk/conferences/2011-EDiA/papers/776-Seetanah. pdf (Vol. 14, p. 2015).
Chakraborty, C., & Basu, P. (2002). Foreign direct investment and growth in India: A cointegration approach. Applied economics, 34(9), 1061-1073.
Cui, H. (2016). China’s economic growth and energy consumption. International Journal of
Energy Economics and Policy, 6(2), 349-355.
Dickey, D. A., & Fuller, W. A. (1979). Distribution of the estimators for autoregressive time series with a unit root. Journal of the American statistical association, 74(366a), 427-431.
Dickey, D. A., & Fuller, W. A. (1981). Likelihood ratio statistics for autoregressive time series with a unit root. Econometrica: journal of the Econometric Society, 1057-1072.
Fei, Li, et al. "Energy consumption-economic growth relationship and carbon dioxide emissions in China." Energy policy 39.2 (2011): 568-574.
Galli, R. (1998). The relationship between energy intensity and income levels: forecasting long term energy demand in Asian emerging countries. The Energy Journal, 19(4).
Gregory, A. W., & Hansen, B. E. (1996). Practitioners corner: tests for cointegration in models with regime and trend shifts. Oxford bulletin of Economics and Statistics, 58(3), 555-560.
Grossman, G. M., & Krueger, A. B. (1991). Environmental impacts of a North American free trade
agreement (No. w3914). National Bureau of Economic Research.
Hansen, H., & Rand, J. (2006). On the causal links between FDI and growth in developing countries. World Economy, 29(1), 21-41.
Hoang, T. T., Wiboonchutikula, P., & Tubtimtong, B. (2010). Does foreign direct investment promote economic growth in Vietnam?. ASEAN Economic Bulletin, 295-311.
26
Hübler, M., & Keller, A. (2010). Energy savings via FDI? Empirical evidence from developing countries. Environment and Development economics, 15(1), 59-80.
Huang, J., Liu, Q., Cai, X., Hao, Y., & Lei, H. (2018). The effect of technological factors on China's carbon intensity: New evidence from a panel threshold model. Energy Policy, 115, 32-42.
Hu, D., Wang, Y., Huang, J., & Huang, H. (2017). How do different innovation forms mediate the relationship between environmental regulation and performance?. Journal of Cleaner
Production, 161, 466-476
Inusa, B. M., Daniel, P. C., Dayagal, D. F., & Nyamdu, S. C. (2018). Nigerian economic growth and recovery: Role of agriculture. Int J Econ Manag Sci, 7(512), 2.
Irandoust, J. E. M. (2001). On the causality between foreign direct investment and output: a comparative study. The International Trade Journal, 15(1), 1-26.
Izah, S. C., Angaye, T. C., Aigberua, A. O., & Nduka, J. O. (2017). Uncontrolled bush burning in the Niger Delta region of Nigeria: potential causes and impacts on biodiversity. International Journal of Molecular Ecology and Conservation.
Izuchukwu, O. (2011). Analysis of the contribution of agricultural sector on the Nigerian economic development. World review of business research, 1(1), 191-200.
Karimi, M. S., & Yusop, Z. (2009). FDI and economic growth in Malaysia.
Keller, W. (2004). International technology diffusion. Journal of economic literature, 42(3), 752-782.
Kuznets, S., & Murphy, J. T. (1966). Modern economic growth: Rate, structure, and spread (Vol. 2). New Haven: Yale University Press.
Kwiatkowski, D., Phillips, P. C., Schmidt, P., & Shin, Y. (1992). Testing the null hypothesis of stationarity against the alternative of a unit root. Journal of econometrics, 54(1-3), 159-178.
Lin, B., & Du, Z. (2017). Promoting energy conservation in China's metallurgy industry. Energy
Policy, 104, 285-294.
Matthew, A., & Mordecia, D. B. (2016). The impact of agricultural output on economic development in Nigeria: 1986-2014. Journal of archives of current research international, 4(1), 1-10.
McCright, A. M., & Dunlap, R. E. (2000). Challenging global warming as a social problem: An analysis of the conservative movement's counter-claims. Social problems, 47(4), 499-522.
MOTOR, O. Sustainability Report (2015).
Musolesi, A., Mazzanti, M., & Zoboli, R. (2010). A panel data heterogeneous Bayesian estimation of environmental Kuznets curves for CO2 emissions. Applied Economics, 42(18), 2275-2287.
27
Network, G. F. (2019). Global footprint network. Obtenido de Global Footprint Network:
http://www. footprintnetwork. org online. Accessed, 1-10.
Oyinbo, O., & Rekwot, G. Z. (2014). The relationships of inflationary trend, agricultural productivity and economic growth in Nigeria. CBN Journal of Applied Statistics, 5(1), 35-47.
Panayotou, T. (1993). Empirical tests and policy analysis of environmental degradation at
different stages of economic development (No. 992927783402676). International Labour
Organization.
Paramati, S. R., Apergis, N., & Ummalla, M. (2017). Financing clean energy projects through domestic and foreign capital: The role of political cooperation among the EU, the G20 and OECD countries. Energy Economics, 61, 62-71.
Perron, P. (1990). Testing for a unit root in a time series with a changing mean. Journal of Business
& Economic Statistics, 8(2), 153-162.
Pesaran, M. H., & Shin, Y. (1998). An autoregressive distributed-lag modelling approach to cointegration analysis. Econometric Society Monographs, 31, 371-413.
Pesaran, M. H., Shin, Y., & Smith, R. J. (2001). Bounds testing approaches to the analysis of level relationships. Journal of applied econometrics, 16(3), 289-326.
Pope III, C. A., & Dockery, D. W. (2006). Health effects of fine particulate air pollution: lines that connect. Journal of the air & waste management association, 56(6), 709-742.
Ramanathan, R. (2006). ABC inventory classification with multiple-criteria using weighted linear optimization. Computers & Operations Research, 33(3), 695-700.
Reyath Y, Faras & Khalifa H Ghali 2009,= Toone, J. E. (2012). Mirage in the Gulf: examining the upsurge in FDI in the GCC and its legal and economic implications for the MENA region. Emory Int'l l. Rev., 26, 677.(cross reference)
Sadorsky, P. (2011). Financial development and energy consumption in Central and Eastern European frontier economies. Energy policy, 39(2), 999-1006.
Salinger, M. J., Stigter, C. J., & Das, H. P. (2000). Agrometeorological adaptation strategies to increasing climate variability and climate change. Agricultural and Forest Meteorology, 103(1-2), 167-184.
Sarkodie, S. A., & Strezov, V. (2019). Effect of foreign direct investments, economic development and energy consumption on greenhouse gas emissions in developing countries. Science of the Total
Environment, 646, 862-871.
Selden, T. M., & Song, D. (1994). Environmental quality and development: is there a Kuznets curve for air pollution emissions?. Journal of Environmental Economics and management, 27(2), 147-162.
28
Sertoglu, K., Ugural, S., & Bekun, F. V. (2017). The contribution of agricultural sector on economic growth of Nigeria. International Journal of Economics and Financial Issues, 7(1), 547-552.
Shafik, N., & Bandyopadhyay, S. (1992). Economic growth and environmental quality:
time-series and cross-country evidence (Vol. 904). World Bank Publications.
Shahbaz, M., Balsalobre-Lorente, D., & Sinha, A. (2019). Foreign direct Investment–CO2 emissions nexus in Middle East and North African countries: Importance of biomass energy consumption. Journal of cleaner production, 217, 603-614.
Shahbaz, M., Khan, S., & Tahir, M. I. (2013). The dynamic links between energy consumption, economic growth, financial development and trade in China: fresh evidence from multivariate framework analysis. Energy economics, 40, 8-21.
Toone, J. E. (2012). Mirage in the Gulf: Examining the upsurge in FDI in the GCC and its legal and economic implications for the MENA region. Emory Int'l L. Rev., 26, 677.
Toone, J. E. (2012). Mirage in the Gulf: Examining the upsurge in FDI in the GCC and its legal and economic implications for the MENA region. Emory Int'l L. Rev., 26, 677.
Twerefou, D. K., Adusah-Poku, F., & Bekoe, W. (2016). An empirical examination of the Environmental Kuznets Curve hypothesis for carbon dioxide emissions in Ghana: an ARDL approach. Environmental & Socio-economic Studies, 4(4), 1-12.
Udemba, E. N. (2019). Triangular nexus between foreign direct investment, international tourism, and energy consumption in the Chinese economy: accounting for environmental quality. Environmental Science and Pollution Research, 26(24), 24819-24830.
Udemba, E. N., Güngör, H., & Bekun, F. V. (2019). Environmental implication of offshore economic activities in Indonesia: a dual analyses of cointegration and causality. Environmental
Science and Pollution Research, 26(31), 32460-32475.
Udemba, E. N., Magazzino, C., & Bekun, F. V. (2020). Modeling the nexus between pollutant emission, energy consumption, foreign direct investment, and economic growth: new insights from China. Environmental Science and Pollution Research, 1-12.
Watson, R. T., & Albritton, D. L. (2001). Climate change 2001: synthesis report:[a report of the
Intergovernmental Panel on Climate Change]. IPCC.
WDI, T. (2019). World development indicators (DataBank).
Xing, Y. (2010). Facts about and impacts of FDI on China and the world economy. China: An
International Journal, 8(02), 309-327.
Xu, S. C., Li, Y. W., Miao, Y. M., Gao, C., He, Z. X., Shen, W. X., ... & Wang, S. X. (2019). Regional differences in nonlinear impacts of economic growth, export and FDI on air pollutants in China based on provincial panel data. Journal of Cleaner Production, 228, 455-466.