196
ISSN 2251-7502 © 2014; Science and Research Publications
Effects of hydration changes on body composition of wrestlers
Erkan Demirkan1*, Mehmet Kutlu2, Mitat Koz3, Mehmet Özal4, Aziz Güçlüöver2, Mike Favre51- Physical Education and Sports School, Hitit University, Çorum- TURKEY
2- Department of Physical Education and Sport, Education Faculty, the University of Kırıkkale, Kırıkkale- TURKEY
3- Ankara University, Faculty of Sport Science, Ankara – TURKEY 4- General Directorate of Sport – Ankara
5- Director of Olympic Sports S&C University of Michigan
*Corresponding author: Email: [email protected]
Abstract
The aim of this study was to determine effects of hydration changes on bioelectrical impedance in wrestlers. One hundred fourteen wrestlers aged 15-17 yr were recruited. The wrestlers’ body composition analysis was determined using the methods of bioelectrical impedance (BIA) and skinfold (SK). Urine specific gravity (Usg) method was used for determining the level of body hydration. According to different hydration status no significant difference was found in the comparison of body composition as determined by BIA (P>0.05). There was a significant difference between the two methods used for the assessment of body fat percentage (BIA %10.4±4.8; SKF % 9.0±5.6) (P<0.05). We may suggest that body hydration fluctuations or dehydration relatively may affect to assess body composition assessment via BIA. This observation may appear to not be appropriate the BIA to determine body composition of wrestlers during dehydration position.
Key words: Bioelectrical impedance, body composition, hydration levels, skinfold,
wrestlers.
Introduction
Wrestlers commonly use dehydration techniques for achieving a target body weight before competition weigh-in. In turn, these hydration changes may affect the widely held assumption that 73.2% of total body water (TBW) is a part of fat-free mass (FFM), and therefore fat mass is overestimated (Wang et al., 1999). The ability of researchers and coaches to accurately estimate minor changes in fat mass and fat-free mass is crucial in sports with weight categories (Kukidome et al., 2008). Consequently, it is important to identify alternative methods that are convenient, reliable, and accurate in measuring body composition. Urine Specific Gravity (USG) is the most practical and effective measure for assessing hydration status during the weight certification procedure (Shirreffs and Maughan, 1998; Stuempfle and Drury, 2003; Bartok et al., 2004a). At physiologic hydration status, USG values vary between 1.002 and 1.030 g/cm3 (Stuempfle et al., 2003). Currently as part of the
wrestling weight certification program (WCP), the National Collegiate Athletic Association (NCAA) has determined that each wrestler must present an Usg value of 1.020 or less as a limit for hydration status before undergoing a body composition assessment (Utter et al., 2003). As a criterion, NCAA has accepted a limit of 1.020 g/cm3 or below values of USG as the indicator of euhydration status of an athlete (Bartok et al., 2004b; Utter, 2001).
Many different methods are used for the assessment of body composition, and each has its own merits and disadvantages (Stewart, 2001). Skinfolds (SK) accurately assess body composition of high school wrestlers (Thorland et al., 1991; Oppliger et al., 1995), but this method imposes some limitations. These include having access to enough trained assessors within a defined geographical region, technical error that may be present because of caliper performance, within- and between-tester differences in SK compressibility, and the inability to palpate the fat–muscle interface (Lohman et al., 1984). One other method is bioelectrical impedance analysis (BIA). This procedure takes very little time, is easy to administer, requires no specialized training or practice for
197
the investigator and is non-invasive (Goss et al., 2003). Among the advantages of BIA includes its simplicity and portability (Utter et al., 2005). This makes it especially useful in assessing body composition in athletes’ population. BIA allows the determination of the FFM and TBW in subjects without significant fluid and electrolyte abnormalities, when using appropriate population, age or pathology-specific BIA equations and established procedures (Kyle et al., 2004). However, several factors such as hydration status and previous exercise have been shown to negatively impact the BIA assessment of body composition (Canton et al., 1988; Deurenburg et al., 1988). National Institute of Health (1994) stated that BIA values are affected by numerous variables including… hydration status and that ‘Reliable BIA requires standardization and control of these variables’.
To our knowledge only one study (Saunders et al., 1998) has investigated the efficiency of BIA in different hydration levels of wrestlers. Therefore, the first aim of the present investigation was to examine the efficiency of BIA in different hydration levels of wrestlers. The second aim of the present investigation was to compare BIA and skinfold body composition analyses methods, because SK is commonly used to assess body composition in high-school wrestlers. It is hypothesized that the hydration status negatively impacts the BIA assessment of body composition. In other words, the implementation of the BIA assessment imposes limitation, including hydration status.
Materials and Methods Subjects
One hundred and fourteen elite junior wrestlers (X age ± SD, 16.4 ± 0.7 yr; HT, 170.2 ± 8.1cm; BW, 68.3 ± 15.4 kg) volunteered as subjects in the present study. All participants were invited to the national team camp, before 2011 European and/or World Championships. The wrestlers were divided into two different hydration levels groups according to USG: lt was accepted 1.020 g/cm3 or below values as the indicator of euhydration status of an athlete, 1.021 g/cm3 or over values as the indicator of dehydration status of an athlete (Utter, 2001; Bartok et al., 2004). Before participating, subjects’ parents (all under the age of 18) read and signed an informed consent form. The study, which complied with the Declaration of Helsinki, was approved by the Bioethics Commission of Ankara University.
Measurements of Height and Body Weight
Body height and weight measurements were made using a digital scale (Seca 664, Hamburg, Germany) in bare feet and wearing only shorts.
Assessment of Urine Specific Gravity (Usg)
All urine samples were collected in transparent plastic cups in the morning just after the wake-up and before breakfast from each wrestler in the study, and Usg measurements were performed immediately after by an optical pen refractometre (Atago Inc., pen wrestling model 3749, Japan).
Assessment of Bioelectrical Impedance Method (BIA)
Body weight, percent body fat and total body fluids of each athlete included in the study were assessed by using a bioelectrical impedance device (Tanita Body Composition Analyzer BC- 418), according to the instructions of the device. Measurements were taken in the morning before breakfast after a 12-hour prohibition of food and water intake, and the athletes were allowed to wear shorts only.
Assessment of Skinfold Method (SK)
SK measures were recorded with a Holtain skinfold calipers at three sites: triceps, subscapular, and abdomen. Skinfolds were measured three times at each site to the nearest 0.5mm with the mean value recorded. All skinfold measurements were taken on the right side of the body. All skinfold measurements were taken by a specially trained technician with a minimum of three years’ experience in the use of skinfold calipers to determine body composition. Body fat percent was calculated from the formula developed by Lohman equations (1992). Fat free mass (FFM) was calculated by subtracting the fat tissue mass (in kg) from the total body mass.
Data Analysis
General characteristics of the participants were presented as means and standard deviations. Standard statistical methods were used for the calculation of the mean and standard deviations (SD). The comparison of two different hydration statuses determined using the independent-samples t test. In addition, the body fat percentages by using two different methods were compared with One Sample T-test. Additionally, Pearson correlation was calculated to examine the relationships between BIA and skinfold method. The level of significance for all statistics was set at p<0.05.
198
Results
The physical characteristics and hydration status of wrestlers are presented in Table 1. Table 1: the physical characteristics of wrestlers
Variables (n=114) Mean ±SD Age 16.4 ± 0.7 Height (cm) 170 ± 8.1 Weight (kg) 68.3 ± 15.4 BMI 23.3 ± 3.5 Fat% (BIA) 10.4 ± 5.2* Fat % (SK) 9.0 ± 5.6* Significant level: *P<0.05
There was found significant difference between skinfolds (SK) and BIA in assessing body composition (fat percentages) in wrestlers (Table 1).
Table 2: the comparison of body composition parameters in different hydration levels
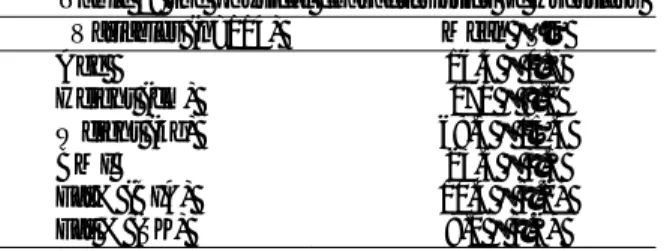
Variables A (N=27) X±SD B (N=87) X±SD P %Fat ( BIA) 9.0 ± 4.5 10.8 ± 5.4 0.11 %Fat (SK) 8.8 ± 6.8 9.1 ± 5.3 0.78 USG (g/cm³) 1.016 ± 0.003 1.028 ± 0.003 0.00
Significant level: *P<0.05; A: ≤1.020; B: ≥1.021 BIA: Bioelectrical impedance analysis, SK: skinfold, USG: Urine specific gravity,
There were no significant differences in BIA percent fat (9.0±4.5 % - 10.8±5.4% respectively) and SK percent fat (8.8±6.8% - 9.1±5.3 %respectively) between euhydration and dehydration status of wrestlers. (Table 2). There were significant differences (P = 0.00) in Usg g/cm³ values between euhydration and dehydration respectively (Table 2).
Discussion and Conclusion
To our knowledge, results from the present investigation may be important with the assessment of body composition in wrestlers that experience dehydration due to rapid weight loss prior to competition weigh-in. bioelectrical impedance analysis (BIA) body composition assessment eliminates the need to use specially trained and experienced technicians. However, several factors such as hydration status and previous exercise have been shown to negatively impact the BIA assessment of body composition (Goss.et al., 2003). In our study findings of hydration levels, significant differences (P < 0.01) in Usg g/cm³ values were found between euhydration and dehydration respectively in Table 2. However, there is no significant difference between hydration (A) and dehydration groups (B) for the assessment of body composition by using BIA. But, BIA percent fat values relatively increased 1.8 % from euhydration to dehydration in Table 2. In a similar study by Saunders et al., (1998) found that percent fat values obtained by hydrostatic weighing (HW) remained stable across all hydration levels, not significantly changing between normal hydration, hypohydration, and rehydration, or from normal to super hydration. By contrast, BIA percent fat values significantly decreased 1.7% from normal to hypohydration, increased 3.2% from hypohydration to rehydration, and increased 2.2% from normal to super hydration (Saunders et al., 1998). The results of this study confirmed the variability of BIA measures during periods of altered hydration seen by Saunders et al. (1998). In addition this, the study’s results also indicated that different hydration status relatively effects assessment of body composition via BIA.
There was significant difference fat values of 1.4% between techniques (BIA and SK) for the total subjects in Table 1. However, the study indicated that between SK and BIA with significant correlation (r=0.58). Portal et al. (2010) found that body fat percent measured by SK and BIA had a high, positive correlation (r > 0.83). They suggested that measurements of body composition by SK and BIA are essentially interchangeable. Ostojic (2006) found that estimates of body fat were similar between SK and BIA with significant correlation (r=0.96) between methods while the BIA method is less time-consuming. Ostojic (2006) suggested that the most simple, quick, and inexpensive method of BIA seems to be very useful to the dietitians' routine for assessing body fat in physically active individuals and athletes. Loenneke et al. (2013) found that BIA and SK methods, when compared with dual-energy X-ray absorptiometry (DXA) for estimating percent body fat (%BF), were not valid for estimating %BF. Loenneke et al. (2013) found that SK and Omron HBF-306C were the most reliable (<2%) methods of estimating BF%, with the BIA producing minimal differences greater than 2%. They suggested that
199
the SK method may be the best field method to track changes over time if you have an experienced tester. In our study, estimating BF% with BIA found that %1.4 more high level fat percentage, compared with SK (Table 1). Eisenmann et al. (2004) suggest that BIA has limited utility in estimating body composition, whereas body mass index (BMI) and SK seem to be more useful in estimating body composition during the adiposity rebound. However, all methods significantly underestimated body fatness as determined by DXA, and overall, the various methods and prediction equations are not interchangeable (Eisenmann et al., 2004). In contrast these studies, Utter and Lambeth (2010) demonstrated that BIA provides similar estimates of FFM when compared with HW in a heterogeneous high school wrestling population during a hydrated state. Utter and Lambeth (2010) suggested that BIA is an attractive assessment tool, easy to use, and may be considered as an alternative field-based method of estimating the FFM of high school wrestlers. Xu et al.(2011) found that BIA can relatively accurately predict %Fat Mass and % skeletal muscle (r=0.90) in healthy Chinese adults using dual-energy X-ray absorptiometry (DXA) as criterion methods. They suggest that the BIA is suitable for individual prediction of % fat mass and skeletal muscle.
Changes in hydration levels, resulting in no significant changes in BIA-determined percent fat measurements, but BIA-determined percent fat percentages relatively are higher during dehydration position compared with hydration position. Therefore, we may suggest that body hydration fluctuations or dehydration relatively may affect to assess body composition assessment via BIA. This observation may appear to not be appropriate the BIA to determine body composition of wrestlers during dehydration position. The BIA is an attractive assessment tool and easy to use, not need to a specially trained technician, thus should be recommended to assess body composition analysis during the hydration position. SK is also an attractive assessment tool and easy to use and portable, but need to a specially trained technician, lf the technician has enough experiences, it should be recommended to assess body composition analysis during even the dehydration position.
References
Bartok C, Schoeller D.A, Sullivan J.C, Clark R.R, Landry G.L, 2004. Hydration testing in collegiate wrestlers undergoing hypertonic dehydration. Med Sci Sports Exerc, 36, 510–7.
Bartok C, Schoeller D.A, Clark R.R, Sullivan J.C, Landry G.L, 2004. The effect of dehydration on wrestling minimum weight assessment. Med Sci Sports Exerc, 36,160-167.
Casa D.J, Armstrong L.E, Hillman S.K, Montain S.J, Reiff R.V, Rich BSE, William O, Roberts W.O, Stone J.A, 2000. National Athletic Trainers’ Association Position Statement: Fluid Replacement for Athletes. Journal of Athletic Training, 35, (2):212–224.
Canton J.R, Mole P.A, Adams W.C, Heustis D.S, 1988. Body composition analysis by bioelectrical impedance analysis: effect of skin temperature. Med Sci Sports Exerc, 20, 489-491.
Deurenburg P, Westrate J.A, Paymans I, Van Der Kooy K, 1988. Factors affecting bioelectrical impedance measurements in humans. Eur J Clin Nutr, 42, 1017-1022.
Eisenmann JC, Heelan KA, Welk GJ, 2004. Assessing body composition among 3- to 8-year-old children: anthropometry, BIA, and DXA. Obes Res, 12, (10):1633-40.
Goss F, Robertson R, Williams A, Sward K, Abt K, Ladewig M, Timmer J, Dixon C.A, 2003. Comparison of skinfolds and leg-to-leg bioelectrical impedance for the assessment of body composition in children. Dyn Med, 26, 2(1):5.
Kukidome T, Shirai K, Kubo J, Matsushima Y, Yanagisawa O, Homma T, Aizawa K, 2008. MRI Evaluation of Body Composition Changes in Wrestlers Undergoing Rapid Weight Loss. Br J Sports Med, 42(10):514-8.
Kyle U.G, Bosaeus I, De Lorenzo A.D, Deurenberg P, Elia M, Manuel Gómez J, Lilienthal Heitmann B, Kent-Smith L, Melchior J.C, Pirlich M, Scharfetter A, Schols C, Pichard E, 2004. Bioelectrical impedance analysis-part II: utilization in clinical practice. Clin Nutr Dec, 23(6):1430-53.
Loenneke J.P, Barnes J.T, Wilson J.M, Lowery R.P, Isaacs M.N, Pujol T.J, 2013. Reliability of field methods for estimating body fat. Clin Physiol Funct Imaging , 3. doi: 10.1111/cpf.12045.
Loenneke J.P, Wray M.E, Wilson J.M, Barnes J.T, Kearney M.L, Pujol T.J, 2013. Accuracy of field methods in assessing body fat in collegiate baseball players. Res Sports Med, 21, (3):286-91. doi: 10.1080/15438627.2013.792087.
Lohman T.G, 1992. Advances in Body Composition Assessment. Champaign, IL: Human Kinetics.
Lohman T.G, Pollock M.L, Slaughter M.H, Brandon L, Boileau A, 1984. Methodological factors and the prediction of body fat in female athletes. Med Sci Sports Exerc, 16, (1):92–6.
National Institutes of Health, 1994. Bioelectrical impedance analysis in body composition measurement. NIH Technol. Assess. Statement; 12–14, 1–35.
200
Oppliger R.A, Harms R.D, Herrmann D.E, Streich C.M, Clark R.R, 1995. The Wisconsin wrestling minimum weight project: a model for weight control among high school wrestlers. Med Sci Sports Exerc, 27, (8):1220–4.
Ostojic S.M, 2006. Estimation of body fat in athletes: skinfolds vs bioelectrical impedance. J Sports Med Phys Fitness, 46, (3):442-6.
Portal S, Rabinowitz J, Adler-Portal D, Burstein R.P, Lahav Y, Meckel Y, Nemet D, Eliakim A, 2010. Body fat measurements in elite adolescent volleyball players: correlation between skinfold thickness, bioelectrical impedance analysis, air-displacement plethysmography, and body mass index percentiles. J Pediatr Endocrinol Metab, 23, (4):395-400.
Saunders M.J, Blevins J.E, Broeder C.E, 1998. Effects of hydration changes on bioelectrical impedance in endurance trained individuals. Med Sci Sports Exerc, Jun; 30(6):885-92.
Shirreffs S.M, Maughan R.J, 1998. Urine osmolality and conductivity as indices of hydration status in athletes in the heat. Med Sci Sports Exerc, 30, (11):1598–602.
Stewart A.D, 2001. Assessing Body Composition in Athletes. Nutrition, 17:694–695.
Stuempfle K.J, Drury D.G, 2003. Comparison of 3 methods to assess urine specific gravity in collegiate wrestlers. J Athl Train, 38, (4): 315–319.
Stuempfle K.J, Lehmann D.R, Case H.S, Hughes S.L, Evans D, 2003. Change in serum sodium concentration during a cold weather ultradistance race. Clin J Sport Med, 13, (3):171-5.
Utter A.C, Goss F.L, Swan P.D, Harris G.S, Robertson R.J, Trone G.A, 2003. Evaluation of air displacement for assessing body composition of collegiate wrestlers. Med Sci Sports Exerc, 35, (3):500-5.
Utter A.C, 2001. The new National Collegiate Athletic Association wrestling weight certification program and sport-seasonal changes in body composition of college wrestlers. J Strength Cond Res, 15, (3):296– 301.
Utter A.C, Nieman D.C, Mulford G.J, Tobin R, Schumm S, McInnis T, Monk J.R, 2005. Evaluation of leg-to-leg BIA in assessing body composition of high-school wrestlers. Med Sci Sports Exerc, 37, (8):1395-400.
Utter A.C, Lambeth P.G, 2010. Evaluation of multifrequency bioelectrical impedance analysis in assessing body composition of wrestlers. Med Sci Sports Exerc, 42, (2):361-7.
Thorland W.G, Tipton C.M, Lohman T.G et al., 1991. Midwest wrestling study: prediction of minimal wrestling weight for high school wrestlers. Med Sci Sports Exerc, 23, (9):1102–10.
Xu L, Cheng X, Wang J, Cao Q, Sato T, Wang M, Zhao X, Liang W, 2011. Comparisons of body-composition prediction accuracy: a study of 2 bioelectric impedance consumer devices in healthy Chinese persons using DXA and MRI as criteria methods. J Clin Densitom; 14(4):458-64.
Wang Z, Deurenberg P, Wang W, Pietrobelli A, Baumgartner R.N, Heymsfield S.B, 1999. Hydration of fat-free body mass: new physiological modeling approach. American Journal of Physiology, 276 (6 Pt 1):E995-E1003.