EMPLOYMENT INCREASED IN MANUFACTURING AND SERVICES
Seyfettin Gürsel
*Gökçe Uysal
and Ayşenur Acar
Abstract
Seasonally adjusted labor market data shows that non-agricultural unemployment rate remained at 12.1 percent in
the period of November 2013. Increases in seasonally adjusted non-agricultural labor force and employment
counterbalanced each other, and thus, non-agricultural unemployment remained stagnant. Increases in service
employment has been accelerating during this period. Similarly, manufacturing employment that had been
declining for the last five periods increased in this period.
Slowdown in increases in non-agricultural labor force and employment
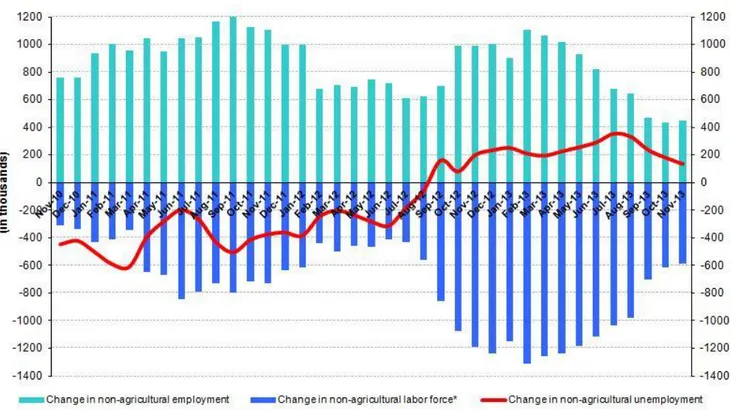
According to the data released by TurkSTAT, non-agricultural labor force increased by 587 thousand (2.7 percent)
and non-agricultural employment increased by 451 thousand (2.3 percent) in the period of November 2013 (Figure
1). Consequently, the number of persons unemployed in non-agricultural sectors increased by 136 thousand.
Increase in non-agricultural labor force was counterbalanced with an increase in non-agricultural employment.
Annual increases in non-agricultural labor force and employment decreased to below 600 thousand.
Figure 1 Year-on-year changes in non-agricultural labor force, employment and unemployment
Source: TurkSTAT,Betam
*Prof. Dr. Seyfettin Gürsel, Betam, Director, [email protected]
Yrd. Doç. Dr. Gökçe Uysal, Betam, Vice Director, [email protected] Ayşenur Acar, Betam, Research Assistant, [email protected]
Labor Market Outlook:
February 2014
www.betam.bahcesehir.edu.tr
2
Non-agricultural employment stagnates
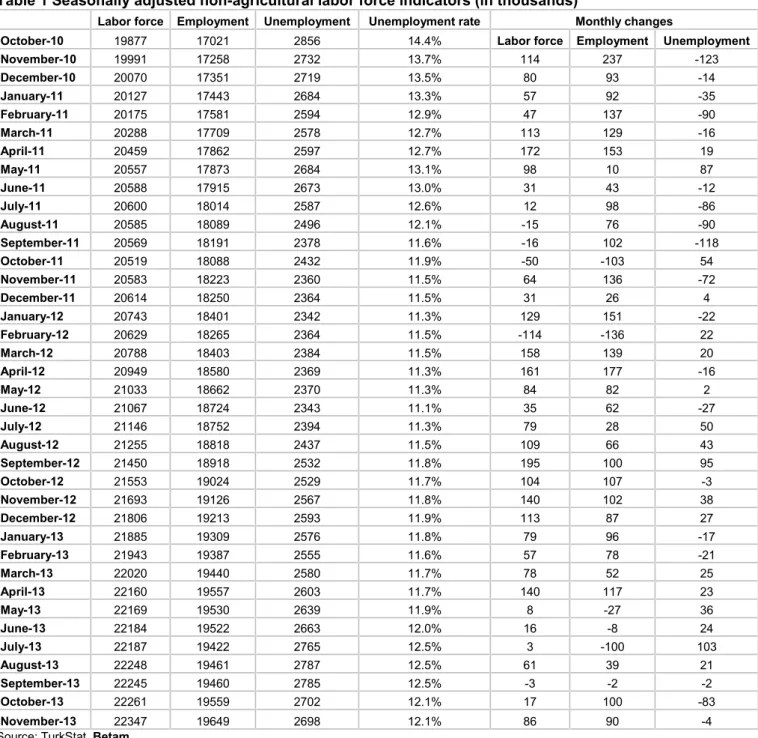
According to seasonally adjusted data, non-agricultural labor force increased by 86 thousand in the period of
November 2013 compared to the period of October 2013, and reached 22 million 347 thousand (Figure 2, Table 1).
Non-agricultural employment increased by 90 thousand and reached 19 million 649 thousand. Hence, the number
of persons unemployed in non-agricultural sectors decreased by 4 thousand and non-agricultural unemployment
rate remained the same at 12.1 percent in the period of November 2013.
Figure 2 Seasonally adjusted non-agricultural labor force, employment and unemployment
Source: TurkStat,Betam
According to Kariyer.net data, non-agricultural unemployment might slightly decrease in the next
period
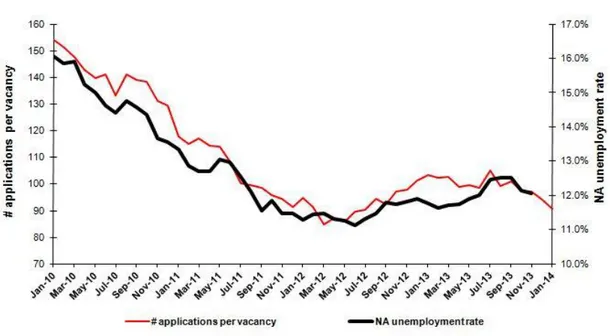
Seasonally adjusted application per vacancy statistics calculated using Kariyer.net series indicate that
non-agricultural unemployment might slightly decrease in the period of December 2013.
1Figure 3 Seasonally adjusted non-agricultural unemployment rate and application per vacancy
Source: Kariyer.net, TurkStat,Betam
1 Betam has been calculating application per vacancy using series released by Kariyer.net for a while. Seasonal and calendar adjustment
procedure is applied to application per vacancy series. A decrease in applications per vacancy may be caused by an increase in vacancies or by a decrease in the number of applications. An increase in vacancies signals economic growth while decreasing number of applications indicates a decrease in number of people looking for a job.
Increases in manufacturing and service employment
Seasonally adjusted labor market series show that manufacturing employment increased by 28 thousand in the
period of November 2013. The increase in manufacturing employment, which has been declining since the period
of June 2013, is in line with the increase in manufacturing production index (Table 2, Figure 4).
2Similarly, the
increase in service employment had been weakening since the period of June 2013. However, it increased by 51
thousand in the period of November 2013. Meanwhile agricultural employment decreased by 20 thousand and
construction employment increased by 11 thousand.
2Employment in each sector is seasonally adjusted separately. Hence the sum of these series may differ from the seasonally adjusted series of
www.betam.bahcesehir.edu.tr
4
Figure 4 Employment by sectors (in thousands)
3Source: TurkStat,Betam
Table 1 Seasonally adjusted non-agricultural labor force indicators (in thousands)
Labor force Employment Unemployment Unemployment rate Monthly changes
October-10 19877 17021 2856 14.4% Labor force Employment Unemployment
November-10 19991 17258 2732 13.7% 114 237 -123 December-10 20070 17351 2719 13.5% 80 93 -14 January-11 20127 17443 2684 13.3% 57 92 -35 February-11 20175 17581 2594 12.9% 47 137 -90 March-11 20288 17709 2578 12.7% 113 129 -16 April-11 20459 17862 2597 12.7% 172 153 19 May-11 20557 17873 2684 13.1% 98 10 87 June-11 20588 17915 2673 13.0% 31 43 -12 July-11 20600 18014 2587 12.6% 12 98 -86 August-11 20585 18089 2496 12.1% -15 76 -90 September-11 20569 18191 2378 11.6% -16 102 -118 October-11 20519 18088 2432 11.9% -50 -103 54 November-11 20583 18223 2360 11.5% 64 136 -72 December-11 20614 18250 2364 11.5% 31 26 4 January-12 20743 18401 2342 11.3% 129 151 -22 February-12 20629 18265 2364 11.5% -114 -136 22 March-12 20788 18403 2384 11.5% 158 139 20 April-12 20949 18580 2369 11.3% 161 177 -16 May-12 21033 18662 2370 11.3% 84 82 2 June-12 21067 18724 2343 11.1% 35 62 -27 July-12 21146 18752 2394 11.3% 79 28 50 August-12 21255 18818 2437 11.5% 109 66 43 September-12 21450 18918 2532 11.8% 195 100 95 October-12 21553 19024 2529 11.7% 104 107 -3 November-12 21693 19126 2567 11.8% 140 102 38 December-12 21806 19213 2593 11.9% 113 87 27 January-13 21885 19309 2576 11.8% 79 96 -17 February-13 21943 19387 2555 11.6% 57 78 -21 March-13 22020 19440 2580 11.7% 78 52 25 April-13 22160 19557 2603 11.7% 140 117 23 May-13 22169 19530 2639 11.9% 8 -27 36 June-13 22184 19522 2663 12.0% 16 -8 24 July-13 22187 19422 2765 12.5% 3 -100 103 August-13 22248 19461 2787 12.5% 61 39 21 September-13 22245 19460 2785 12.5% -3 -2 -2 October-13 22261 19559 2702 12.1% 17 100 -83 November-13 22347 19649 2698 12.1% 86 90 -4
6
Table 2 Seasonally adjusted employment by sector (in thousands)
Agriculture Manufacturing Construction Service Monthly changes
October-10 5801 4498 1437 11086 Agriculture Manufacturing Construction Service
November-10 5855 4667 1507 11084 53 169 70 -2 December-10 6035 4642 1564 11145 181 -25 57 61 January-11 6039 4656 1578 11209 4 14 14 64 February-11 6188 4652 1625 11304 149 -4 46 95 March-11 6200 4790 1628 11291 12 138 4 -13 April-11 6077 4828 1632 11402 -123 38 4 111 May-11 6020 4777 1652 11443 -56 -51 20 41 June-11 6092 4697 1666 11552 71 -80 14 109 July-11 6111 4710 1686 11618 19 13 20 66 August-11 6182 4682 1749 11658 72 -28 64 40 September-11 6120 4707 1755 11729 -63 25 6 71 October-11 6183 4657 1673 11757 63 -50 -82 28 November-11 6159 4700 1652 11872 -23 43 -21 114 December-11 6053 4701 1640 11909 -107 1 -12 38 January-12 6056 4685 1725 11991 4 -16 85 82 February-12 6042 4684 1586 11995 -15 -1 -139 4 March-12 6027 4721 1583 12099 -15 37 -2 104 April-12 6057 4792 1652 12136 31 71 69 37 May-12 6111 4760 1708 12195 53 -32 55 59 June-12 6051 4761 1718 12245 -60 1 10 50 July-12 6048 4778 1690 12284 -3 17 -28 40 August-12 6044 4745 1734 12339 -4 -33 45 55 September-12 6144 4735 1762 12420 100 -10 28 82 October-12 6210 4732 1777 12515 66 -3 15 95 November-12 6195 4814 1776 12536 -15 82 -1 21 December-12 6140 4856 1786 12571 -55 42 10 35 January-13 6114 4870 1850 12589 -26 14 64 18 February-13 6144 4886 1857 12644 30 16 7 55 March-13 6120 4948 1813 12679 -24 62 -44 35 April-13 6103 5030 1816 12711 -18 82 3 32 May-13 6031 5044 1722 12764 -72 14 -94 53 June-13 5972 5015 1737 12770 -59 -29 15 6 July-13 5968 4991 1655 12775 -4 -24 -82 6 August-13 5991 4964 1704 12793 23 -27 48 18 September-13 6010 4914 1747 12799 19 -50 43 5 October-13 5917 4899 1841 12819 -93 -15 94 20 November-13 5897 4927 1852 12870 -20 28 11 51