ISSN: 1307-1130, www.nobel.gen.tr
Reciprocal Modulation of Hepatic Cytochrome P450 Gene Expressions with Streptozotocin
Induced Diabetes and Resveratrol
Gökhan Sadi1,2, Özlem Sadi3
1Department of Biology, Karamanoğlu Mehmetbey University, Karaman
2Joint Biochemistry Graduate Program, Department of Biological Sciences, Middle East Technical University, 06531 Ankara 3Department of Educational Science, Karamanoğlu Mehmetbey University, Karaman
*Corresponding Author Received : January 09, 2010
e-mail: [email protected] Accepted : February 15, 2010
Abstract
Cytochrome P450s are very large and diverse superfamily of hemoproteins found in all domains of life and diverse array of compounds can influence the relative concentrations and/or activities of P450s. Expression of P450s is modulated not only by exposure to various chemicals, but also by some pathophysiological conditions such as diabetes, hypertension and obesity.
Six different Cytochrome P450 isoforms namely; 1A1, 2A1, 2E1, 2C11, 3A1, 4A1 were quantified by quantitative Real Time PCR to assess the relative expressions of CYPs mRNA in control and diabetic rat liver tissues. At the same time, effects of resveratrol (RSV) on these isoforms were evaluated. According to results, diabetes enhanced the CYP1A1, CYP2E1 and CYP3A1 gene expression and RSV reduced to these increments toward the control values. Furthermore, while CYP2C11 and CYP4A1 expressions were found to be reduced by diabetes, application of RSV decreased these isoforms’expressions further. Additionally, diabetes and RSV treatment did not alter the CYP2A1&2 expressions significantly.
As a result, expressions of cytochrome P450 were altered not only by diabetes but also by exposure to antioxidants such as resveratrol and levels of expressions of each isoforms are important factors determining the biological consequences of xenobiotics and antioxidant defense systems in diabetes.
Key words: Diabetes, Cytochrome P450, Resveratrol, Real Time PCR.
INTRODUCTION
Free radicals are atoms or groups of atoms with an odd (unpaired) number of electrons and can be formed when oxygen interacts with certain molecules. Under normal conditions the body can easily handle free radicals but increased oxygen flux or decreased removal may ultimately results in oxidative stress. Factors such as site of production, the availability of transition metals, and the action of enzymes determine the fate of each radical species. The consequences of free radicals in biological systems are manifold and include damage to all cell constituents which are prone to oxidative attack.
Biological antioxidants are natural molecules which can prevent the uncontrolled formation of free radicals and activated oxygen species, or inhibit their reactions with biological structures. Resveratrol (RSV), a phytoalexin abundantly found in grapes and red wine exhibited a large spectrum of beneficial health effects including free radical scavenging, cardioprotective [1], antiproliferative [2] and neuroprotective [3] properties. Plants produce RSV and other stilbenes in response to stress, injury, fungal infection, or ultraviolet (UV) radiation. RSV suppresses the expression of various isoforms of CYP under pathological conditions, which suggests its role in
reduction of CYP-mediated ROS generation and thereby cellular toxicity [4-7].
Diabetes mellitus is a common disease characterized by the disordered metabolism and abnormally high blood glucose levels (hyperglycemia) resulting from insufficient levels of insulin or its action on cells. Elevated blood glucose levels cause free radicals to be produced via glucose autoxidation [8], non-enzymatic protein glycation [9], increased influx toward polyol pathway [10], activation of protein kinase C and increased flux through hexosamine pathway [11]. Hyperglycemia may initiate and promote progression of diabetic disease and lead to insulin resistance and hyperinsulinemia [12], altered fatty acid metabolism, hypertension, ketoacidosis, osmotic effects, vasoactive hormones and dysfunction in sympathetic regulation of glucose and fat metabolism [13]. Furthermore, several theories explain the most adverse effects of hyperglycemia by oxidative stress responsible for tissue damage.
The cytochrome P450 (CYP) is the superfamily of hemoproteins that mediate the biotransformation of endogenous and exogenous compounds. Microsomal P450 catalyses the oxidative metabolism of a wide variety of lipophilic compounds such as drugs and carcinogens
as well as endogenous steroids and fatty acids [14]. Foreign chemicals or drugs called xenobiotics especially lipophilic drugs are metabolized by Cytochrome P450s. The metabolism of these compounds takes place in two phases. Phase I is chemical modification to add a functional group that can be used to attach a conjugate. The conjugate makes the modified compound more water soluble so it can be excreted in the urine. Many P450s add a hydroxyl group in a Phase I step of drug metabolism. The hydroxyl then serves as the site for further modifications in Phase 2 drug metabolism.
The P450 proteins are categorized into families and subfamilies by their sequence similarities. Sequences that are greater than 40% identical at the amino acid level belong to the same family. Sequences that are greater than 55% identical are in the same subfamily. The P450-dependent metabolism of xenobiotics and drugs is primarily catalyzed by enzymes of the CYP1, CYP2, CYP3 and CYP4 families. The CYP1 families of P450s metabolize polyaromatic hydrocarbons (N-hydroxylation) and aromatic and heterocyclic amines (N-oxidation) and catalyze several reactions associated with carcinogen activation [15].
CYP2 families are involved in drug and steroid metabolism. The most abundant form is the ethanol inducible CYP2E enzymes. CYP2B is inducible by barbiturates in rodents and CYP2C enzymes are the steroid hydroxylases. CYP2E1 is known to metabolize endogenous compounds such as fatty acids, lipid hydroperoxides, and ketone bodies into aldehyde and many xenobiotics and carcinogens into nucleophilic reactive species. Diabetes, fasting, and long-term alcohol consumption all result in altered nutritional status and metabolism (increased ketone body, glucose, and fatty acid levels) as well as altered hormone (insulin, glucagon, and growth hormone) secretion and so affect CYP2E family.
CYP3 family is involved in drug metabolism and the CYP3A subfamily is one of the most important drug metabolizing families in humans [16]. CYP3A includes four genes, CYP3A4, CYP3A5, CYP3A7, and the recently identified CYP3A4. CYP3A4 is the most abundantly expressed P450 in human liver [17] and the color of perfused liver is due to this protein. CYP3A4 is known to metabolize more than 120 different drugs.
CYP4 families are involved in arachidonic acid or fatty acid metabolism. This family ω-hydroxylate the terminal carbon of fatty acids and subfamily members of this family show a preference in the metabolism of short (C7-C10)-CYP4B, medium (C10-C16)-CYP4A, and long (C16-C26)-CYP4F, saturated, unsaturated and branched chain fatty acids.
This study concentrated on the regulation of the hepatic drug-metabolizing CYP genes in diabetes and showed the effects of intraperitonally administered antioxidant; resveratrol on some of the cytochrome P450 gene expression in diabetic rat liver tissues. Six different Cytochrome P450 isoforms namely 1A1, 2A1, 2E1, 2C11, 3A1, 4A1 were quantified with the help of quantitative
Real Time PCR using SYBR Green I chemistry to assess the expressions of six different CYP genes as compared to internal standard β-Actin.
MATERIALS AND METHODS
Male Wistar rats were randomly divided into three groups at the start of the experiment. In two groups diabetes was induced by single intraperitonal injection of Streptozotocin (50 mg/kg body weight) dissolved in 0.05M citrate buffer (pH 4.5) and blood glucose concentrations were checked by Accu-check-go blood glucose analyzer (Roche) and animals having blood glucose concentration higher than 200mg/dl was considered as diabetics. After one week of diabetes, administration of antioxidants (50mg/kg body weight/ day) was started and the experimental groups comprised the control group (n=9), untreated diabetic group (n=9), diabetic groups supplemented with trans-resveratrol (D+R) (n=7). All experiments were carried out with the approval of ethical committee. The procedures involving animals and their care are conformed to the institutional guidelines [18]. At the end of the four week growing period, rats were decapitated and livers were removed and quickly frozen in liquid nitrogen and kept -85oC for subsequent biochemical analysis.
Total RNAs were isolated from the liver tissues by guanidine isothiocyanide method [19]. This method is based on differential extraction of RNAs by organic solvents. Proteins are denaturated by strong denaturating agent, Guanidine isothocyanide, and DNAs are selectively fractionated from RNAs by phenol at acidic pH. In order to decrease the possibility of RNA degradation during the procedure, all glassware and plastics were treated by 0.1% DEPC (Diethyl Pyrocarbonate) solution overnight and then autoclaved and dried in oven which converts DEPC into CO2 and ethanol. Furthermore, all solutions were DEPC treated or prepared by 0.1% DEPC treated water to eliminate the RNAse activities.
Immediately after removal from the animal, about 500 mg liver tissue were minced on ice and homogenized (at room temperature) with 5 ml of solution D (4M Guanidine Isothiocyanide, 25mM Sodium Citrate pH:7.0, 0.5% Sarcosyl, 0.1 M 2-mercaptoethanol) in a glass-teflon homogenizer and subsequently transferred into pyrogen free 15ml polypropylene tube. Sequentially, 0.5 ml of 2M sodium acetate (pH 4.0), 5 ml of phenol (water saturated, acidic pH) 1 ml of chloroform-isoamyl alcohol mixture (49:1) were added to the homogenate, with thorough mixing by inversion after the addition of each reagent. The final suspension were shaken vigorously for 10 s and cooled on ice for 15 min. Then, samples were centrifuged at 10.000g for 20 min at 4°C and after that, RNA was present in the aqueous phase whereas DNA and proteins were present in the interphase and phenol phase, respectively. Five hundred microliter of aqueous phase was transferred to a fresh DNAse RNAse free eppendorf tube, mixed with 1 ml of isopropanol, and then placed at -20°C for at least 30 min to precipitate RNA.
Sedimentation at 10.000g for 20 min was again performed and the resulting RNA pellet was redissolved in 0.3 ml of solution D, which is re-precipitated with 1 volume of isopropanol at -20°C for 30 min. After centrifugation at 10.000g for 10 min at 4°C, the RNA pellet was resuspended and washed with 75% ethanol, sedimented by centrifugation, dried in oven (60-65oC, 15 min), and dissolved in 50µl DEPC treated water or deionized formamide at 65oC for 10min. Formamide provides a chemically stable environment that also protects RNA against degradation by RNAes. Purified, salt-free RNA dissolves quickly in formamide up to a concentration of 4 mg/ml. At such concentrations, samples of the RNA can be analyzed directly by gel electrophoresis and RT-PCR, saving time and avoiding potential degradation. If necessary, RNA can be recovered from formamide by precipitation with 4 volumes of ethanol as described by Chomczynski [20].
After isolation of total RNA, their integrities were checked by formaldehyde agarose gel electrophoresis and RNA concentrations and protein contamination were determined by spectrophotometry [21]. According to this, RNAs were diluted hundred times with TE buffer (10mM Tris, 1mM EDTA pH.8.0) in a quartz cuvette and absorbance of the solution was measured at 260 and 280 nm using TE buffer as blank. The purity of the isolated RNA was determined by taking the ratio of A260 and A280 readings. 40µg/ml solution of single stranded RNA gives absorbance of 1.000 and by using this quotation, we calculated the concentration of the RNA in our sample as follows: RNA concentration (µg/ml) = (OD 260) x (dilution factor) x (40 µg RNA/µl)
One microgram of total RNA was reverse transcribed into the cDNA by using M-MuLV Reverse transcriptase (MBI Fermentas, USA). To the reverse transcription reaction, 1μL oligo(dT)15 primer was added to 1μg total RNA. Then, the volume was completed to 12μL with DEPC-treated water. Afterwards, the mixture was gently mixed and incubated 5 min at 70oC and chilled on ice. Then 4μL of 5X M-MuLV reaction buffer and 1μL of RiboLockTM (20u/ μL) (MBI Fermentas, USA) was added. After addition of 2μL 10 mM dNTP mix, tubes were incubated at 37oC for 5 min. Finally, 1μL of M-MuLV RT (200u/μL) is added and reaction was carried out at 42oC for 1 hour and stopped at 70oC for 10 min with denaturation of reverse transcriptase. Finally, cDNA mixture was chilled on ice and stored at ambient temperature until subsequent PCR reactions.
One microliter of cDNA mixture (1:10 diluted) was amplified in a 10μL of PCR mixture containing 5μL SYBR Green Mastermix (Roche FastStart Universal SYBR Green Master Mix with Rox) (2X) and 2μL forward and 2μL reverse primer (2mM each). Different primer sets were used to amplify the internal standard (β-Actin gene) and CYP genes (Table 1). The Real Time PCR program was set for initial denaturation at 95°C for 15 minutes, denaturation at 94°C for 30 seconds, annealing at 58°C for 30 seconds and extension at 72°C for 30 seconds. The cycle from denaturation to extension was
repeated 40 times and at the end of each extension step green fluorescence was measured to follow the reaction chemistry on time in each cycle. Melt curve analysis was performed at the end of each run by rising the temperature from 50°C-99°C with the measurement of decrease in total flouresence which is used to determine the specificity of the final products. By taking the negative first derivative (-dF/dT) of the melting curve, the melting temperature of dsDNA can be easily visualized and compared, simplifying the specificity of final product. Although little or no primer-dimer formation was detected under normal PCR conditions (figure 1), the real-time thermal cycler (Rotor-gene 6000 Real-time rotary analyzer, Corbett Life Sciences, Sydney, Australia) was programmed to take fluorescence readings after each cycle at a temperature several degrees lower than the melting temperature of the amplicon. This step was taken to avoid or minimize any potential contribution of primer-dimers to the overall fluorescence signal. All PCR reactions were performed in duplicates and negative control samples were processed in the same manner, except that the template was omitted. Calibration curve was constructed by plotting the cross point (Ct) against serially diluted control cDNAs. The Ct is the cycle number at which the fluorescence signal is greater than a defined threshold, one in which all the reactions are in the logarithmic phase of amplification.
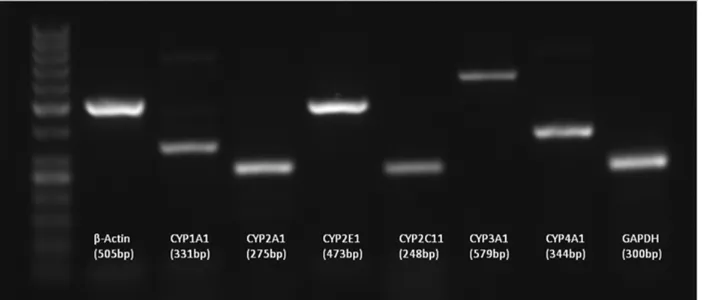
Also specification of the final product of each run was clarified by simple PCR amplification and agarose gel electrophoresis. To do this, 1 µl of cDNA mixture was amplified by conventional PCR in which initial denaturation at 94°C for 3 min, denaturation at 94°C for 30 sec, annealing at 58°C, extension at 72°C for 45 sec (30 cycle) and final extension at 72°C for 5 min was carried out by using Eppendorf gradient type mastercycler (Eppendorf, Germany).
After the reaction and agarose gel electrophoresis on 1.2% agarose gels, specific PCR products indicating the specificity of the reactions were visualized as in figure 1.
Statistical analysis
Data were expressed as mean standard error of mean (SEM) and differences in measured parameters between control, diabetic and resveratrol supplemented animals were assessed by two tailed Student T-test with the help of MINITAB 12.1 statistics software. The relationships between oxidative parameters characterizing diabetic and control rat liver status were analyzed and a probability of 0.05 and 0.005 was set as the level of statistical significance.
RESULTS
CYP1A1 also known as aryl hydrocarbon hydroxylase (AHH) is involved in the metabolic activation of aromatic hydrocarbons, such as benzopyrene, by transforming it to an epoxide. The expression of the CYP1A1 is regulated by the aryl hydrocarbon receptor, a ligand activated transcription factor [23]. As seen from the figure 2, diabetes enhanced the CYP1A1 gene expression significantly
around tenfold and administration of resveratrol did not change the diabetic CYP1A1 expression significantly.
CYP2A enzymes metabolize numerous xenobiotic compounds, such as coumarin, aflatoxin B1, nicotine, cotinine, acetaminophen, and 2,6-dichlorobenzonitrile, as well as endogenous compounds, including testosterone, progesterone, and other steroid hormones and the CYP2A1 and CYP2A2 genes code for hepatic steroid hydroxylases [24]. As seen in figure 2, in non-treated diabetics and resveratrol administered diabetic rats, CYP2A1&2 gene expressions were not statistically different from the control expressions.
The product of CYP2E1 metabolizes both endogenous substrates, such as ethanol, acetone, and acetaldehyde, as well as exogenous substrates including benzene, carbon tetrachloride, ethylene glycol, and nitrosamines. Due to its many substrates, this enzyme is involved in various processes such as gluconeogenesis, hepatic cirrhosis, diabetes, and cancer [25,26]. According to our results, diabetes causes an increment in the expression of CYP2E1 while RSV was too efficient for the lessening of CYP2E1 expression, which was found to be statistically significant.
Gene expression of CYP2C11 enzyme, which is a male specific steroid 16α- and 2α-hydroxylase, was reduced in diabetic animals significantly. LA administration enhanced the expression of this enzyme in both control and diabetic animals and this increment were found to be significant. Resveratrol did not alter the CYP2C11 expression in diabetic animals (Figure 1).
The CYP3A subfamily is involved in the metabolism of steroids and numerous xenobiotics and it is the most abundant human hepatic and intestinal CYP which is elevated in response to many xenobiotics by both transcriptional and post-transcriptional mechanisms [27]. According to our results, it has been found that diabetes increased the gene expression of CYP3A1. Resveratrol, which is a phytoalexins (antibiotics produced by plants that are under attack), reduces the CYP3A1 mRNA expressions in diabetic animals.
The product of hepatic CYP4A gene is functioning in the fatty acid and prostaglandin omega-hydroxylases. In diabetes, there was a severe reduction in CYP4A1 mRNA expression. When antioxidant; RSV were given to the control rats, there was significant reduction in the CYP4A1 mRNA expression which was found to be statistically significant (p<0.05).
DISCUSSION
Microsomal cytochrome P450-dependent mixed-function oxidases (cytochrome P450) are terminal monoxygenases involved in the metabolism of a wide variety of structurally diverse compounds. They play a major role in the metabolism of both endogenous and exogenous substrates. Cytochrome P450 metabolism may have one of two outcomes: detoxification of the xenobiotics by metabolism and conjugation and its safe excretion; or production of metabolites which are toxic
and may be mutagenic or carcinogenic [28]. In vivo animal studies have shown that isoforms of several of the families of cytochrome P450 are associated with xenobiotic metabolism, are highly inducible by chemical exposure and pathological conditions such as diabetes mellitus in animals [29,30]. In this study, our aim is to demonstrate the changes in the gene expressions of six different cytochrome P450 isoforms namely 1A1, 2A1&2, 2E1, 2C11, 3A1 and 4A1. In the literature, there is various studies in which alloxan or streptozotocin (STZ) is used as a diabetogenic agent. They have generally agreed that hepatic microsomal levels of CYP1A2, 2A1, 2B1, 2C7, 2E1, and CYP4A enzymes are increased 2-4 weeks after treatment of male rats, whereas CYP2A2, 2C11, and 2C13 levels are decreased [31,32].
CYP1A1 also known as aryl hydrocarbon hydroxylase is involved in the metabolic activation of aromatic hydrocarbons by transforming it to an epoxide. It has been shown that expression of the CYP1A1 genes are regulated by the aryl hydrocarbon receptor which is a ligand activated transcription factor [23]. Diabetes enhanced the CYP1A1 gene expression significantly and this increment suggests that transcriptional induction is present in diabetes. Coleman [15] stated that 1A1 family is a not a constitutive enzyme in the liver because an individual is not exposed to planar polyaromatic hydrocarbons. We proposed that in diabetes there might be excessive accumulation of inducers in the liver causing CYP1A1 to be overexpressed. Administration of RSV reversed this increment by somehow lessening these inducers. Furthermore, phase I metabolizing enzymes are known to produce free radical byproducts [33] and repression of CYP1A1 gene expression demonstrate that RSV decreases the diabetes induced free radical toxicity. CYP2A enzymes metabolize numerous xenobiotic compounds, such as coumarin, aflatoxin B1, nicotine, cotinine, acetaminophen, and 2,6-dichlorobenzonitrile, as well as endogenous compounds, including testosterone, progesterone, and other steroid hormones and the CYP2A1 and CYP2A2 genes code for hepatic steroid hydroxylases [24] . We found that diabetes and antioxidant treatment did not alter the CYP2A1&2 expressions indicating that in diabetes, steroid metabolism were not affected too much. Considering CYP2E1, there was an elevation in CYP2E1 mRNA which is in agreement with various studies carried out previously [34,35]. Current literature about CYP2E1 in diabetes states that enzyme is regulated at transcriptional, translational or posttranslational mechanism. The induction of CYP2E1 mRNA is not accompanied by an increase in CYP2E1 gene transcription, rather than mRNA is selectively stabilized in diabetes due to lack on insulin action. Since, mRNA of CYP2E1 was found to be destabilized by insulin [36]. Thus, elevation of CYP2E1 mRNA levels in the diabetic state has been attributed to mRNA stabilization. Reduction of this induction by antioxidant treatment suggests some other mechanisms which also regulate the mRNA levels of CYP2E1. Effects of antioxidants on CYP2E1 expression may be mediated by the reduced
levels of circulating ketone bodies; which has a direct effect on CYP2E1 expression in diabetes since elevated expression of CYP2E1 in these pathophysiological states in rats has been attributed to elevated ketone body levels. Gene expression of CYP2C11 enzyme, which is a male specific steroid 16α- and 2α-hydroxylase, was reduced in diabetic animals. RSV did not modulate the expression in diabetic rats. Since CYP2C11 expression in male rats is exquisitely sensitive to the temporal pattern of plasma growth hormones (GH) and the greatly reduced expression of this enzyme in diabetic rats is thought to be due in large part to the reduced GH secretion in these animals [37]. Furthermore, it was found that CYP2C11 expression is suppressed by glucagon in a cAMP dependent manner [38], and this effect is antagonized by insulin. This suggests a role of hypoinsulinemia and hyperglucagonemia in the diabetic suppression of CYP2C11.
The CYP3A subfamily is involved in the metabolism of steroids and numerous xenobiotics and CYP3A is the most abundant human hepatic and intestinal CYP and is elevated in response to many xenobiotics by both transcriptional and post-transcriptional mechanisms [27]. Different laboratories have reported either decreased [37], or increased [39] CYP3A protein expression following STZ treatment but neither of them focuses the effect of RSV treatment. According to our results, it has been found that diabetes increased the gene expression of CYP3A1 but hepatic CYP4A1 which is important fatty acid and prostaglandin omega-hydroxylases was severely reduced in diabetes. This study demonstrated that RSV reduced the CYP3A1 and CYP4A1 mRNA expressions in diabetic animals confirming reductive activities caused by this antioxidant.
As a summary, hepatic cytochrome P450 (P450) enzyme gene expressions were profoundly altered in streptozotocin induced diabetes. Increased or decreased levels of hepatic P450 enzymes by diabetes causes potential and documented impairment of drug clearance and clinical drug toxicity and modulation of P450s by selective application of antioxidants may provide a protection. Since, levels of expression of each isoform are important factors determining the biological consequences of antioxidants.
Acknowledgements:
We would like to thank to Prof. Dr. Tülin Güray, for her encouraging guidance and supervision throughout this study. We also thank Assoc.Prof.Dr.Ökkeş Yılmaz for providing the animals. The financial support provided by grants from Middle East Technical University (BAP-08-11-DPT2002K120510-TB3) and TUBITAK (108T295) are gratefully acknowledged.
REFERENCES
1. Bradamante S, Barenghi L, Piccinini F, et al. 2003. Resveratrol provides late-phase cardioprotection by means of a NO and adenosinemediated mechanism. Eur. J. Pharmacol. 465: 115-123
2. Hsieh TC, Juan GZ, Arzynkiewicz ZD, et al. 1999. Resveratrol increases nitric oxide synthase, induces accumulation of p53 and p21 (WAF1/CIP1), suppresses cultured bovine pulmonary artery endothelial cell proliferation by perturbing progression through S and G2. Cancer Res. 59: 2596–2601
3. Bastianetto S, Zheng WH, Quirion R. 2000 Neuroprotective abilities of resveratrol and other red wine constituents against nitric oxide related toxicity in cultured hippocampal neurons. Br. J. Pharmacol. 131: 711-720
4. Piver B, Berthou F, Dreano Y, et al. 2003. Differential inhibition of human cytochrome P450 enzymes by &unknown;-viniferin, the dimer of resveratrol: comparison with resveratrol and polyphenols from alcoholized beverages. Life Sciences. 73(9): 1199-1213
5. Piver B, Berthou F, Dreano Y, et al. 2001 Inhibition of CYP3A, CYP1A and CYP2E1 activities by resveratrol and other non volatile red wine components. Toxicology Letters. 125(1-3): 83-91
6. Chan WK, Delucchi AB. 2000. Resveratrol, a red wine constituent, is a mechanism-based inactivator of cytochrome P450 3A4. Life Sciences 67(25): 3103-3112 7. Chuna YJ, Kima MY, Guengerich FP. 1999. Resveratrol Is a Selective Human Cytochrome P450 1A1 Inhibitor. Biochem. Biophy. Res. Com. 262(1): 20-24
8. Hunt JV, Smith CC, Wolff SP. 1990. Autoxidative glycosylation and possible involvement of peroxides and free radicals in LDL modification by glucose. Diabetes. 39: 1420–1424
9. Wolff SP, Dean RT. 1987. Glucose autoxidation and protein modification. The potential role of autoxidative glycosylation in diabetes. Biochem J. 245: 243-250
10. Chung SS, Ho EC, Lam KS, et al. 2003. Contribution of polyol pathway to diabetes-induced oxidative stress. J. of American Soc. for Neph. 14: 233– 236
11. Brownlee M. 2001. Biochemistry and molecular cell biology of diabetic complications. Nature. 414: 813-820
12. Grill V, Bjorklund A. 2000. Dysfunctional insulin secretion in type 2 diabetes: role of metabolic abnormalities. Cellular and Molecular Life Sci. 57(3): 429-440
13. Nonogaki K. 2000. New insights into sympathetic regulation of glucose and fat metabolism Diabetologia. 43(5): 533-549
for the Cytochrome-P-450 Superfamily. Trends in Pharmacological Sciences. 12(8): 281-283
15. Coleman MD. 2005. Human drug metabolism: an introduction. Chichester, England ; Hoboken, NJ: John Wiley
16. Nelson DR, Koymans L, Kamataki T, et al. 1996. P450 superfamily: update on new sequences, accession numbers and nomenclature. Pharmacogenetics 6 : 1-42
17. Li AP, Kaminski DL, Rasmussen A. 1995. Substrates of human hepatic cytochrome P450 3A4. Toxicology. 104(1-3): 1-8
18. Giles AR. 1987. Guidelines for the use of animals in biomedical research. Thrombosis and Haemostasis. 58: 1078-1084
19. Chomczynski P, Sacchi N. 1987. Single-step method of RNA isolation by acid guanidinium thiocyanate-phenol-chloroform extraction. Anal. Biochem. 162: 156-159
20. Chomczynski P. 1992. Solubilization in Formamide Protects RNA from Degradation. Nucleic Acids Research. 40(14): 3791
21. Sambrook J, Russell DW. 2001. Molecular cloning: a laboratory manual (3rd ed.) New York: Cold Spring Harbor Laboratory
22. Thum T, Borlak J. 2002. Testosterone, cytochrome P450, and cardiac hypertrophy. The FASEB Journal. 2002(16): 1537-1549
23. Ma Q, Lu AY. 2007. CYP1A induction and human risk assessment: an evolving tale of in vitro and in vivo studies. Drug metabolism and disposition: the biological fate of chemicals 35(7): 1009–16
24. Su T, Ding XX. 2004. Regulation of the cytochrome P450 2A genes. Toxicology and Applied Pharmacology. 199: 285-294
25. Morita M, Marchand LL, Kono S, et al. 2009. Genetic Polymorphisms of CYP2E1 and Risk of Colorectal Cancer: The Fukuoka Colorectal Cancer Study. Cancer Epidemiology Biomarkers & Preventio. 18: 235-241
26. Lucas D, Farez C, Bardou LG, et al. 1998. Cytochrome P450 2E1 activity in diabetic and obese patients as assessed by chlorzoxazone hydroxylation. Fund. Clin. Pharmacol. 12: 553-558
27. Kim H, Putt DA, Zangar RC, et al. 2001. Differential Induction of Rat Hepatic Cytochromes P450 3A1, 3A2, 2B1, 2B2, and 2E1 in Response to Pyridine Treatment. Drug Metabolism and Disposition. 29(3):
353-360
28. Josephy D, Mannervik B. 2005. Molecular Toxicology (2nd ed) New York : Oxford University Press
29. Ahn T, Yun CH, Oh DB. 2006. Tissue-specitic effect of ascorbic acid supplementation on the expression of cytochrome P450 2E1 and oxidative stress in streptozotocin-induced diabetic rats. Toxicology Letters. 166(1): 27-36
30. Clarke J, Snelling J, Ioannides C, et al. 1996. Effect of vitamin C supplementation on hepatic cytochrome P450 mixed-function oxidase activity in streptozotocin-diabetic rats. Toxicology Letters. 89(3): 249-256
31. Cheng PY. Morgan ET. 2001. Hepatic Cytochrome P450 Regulation in Disease States. Current Drug Metabolism. 2: 165-183
32. Shimojo N. 1994. Cytochrome P450 changes in rats with streptozotocin-induced diabetes. Int. J. Biochem. 26(10-11): 1261-1268
33. Cederbaum AI, Wu D, Mari M, et al. 2001. CYP2E1-dependent toxicity and oxidative stress in HepG2 cells. Free Radical Biology and Medicine. 31(12): 1539-1543
34. Raza H, Prabu SK, Robin MA, et al. 2004. Elevated mitochondrial Cytochrome P450 2E1 and Glutathione S-transferase A4-4 in Streptozotocin-induced diabetic rats. Diabetes. 53: 185-193
35. Wang Z, Hall SD, Maya JF, et al. 2003. Diabetes mellitus increases the in vivo activity of Cytochrome P450 2E1 in humans. Br. J. Clin. Pharmacol. 55: 77-85
36. Woodcroft JK, Hafner MS, Novak RF. 2002. Insulin signaling in the transcriptional and posttranscriptional regulation of CYP2E1 expression Hepatology. 35(2): 263-273
37. Thummel KE, Schenkman JB. 1990. Effects of testosterone and growth hormone treatment on hepatic microsomal P450 expression in the diabetic rat. Mol. Pharmacol. 37: 119-129
38. Iber H, Tong LM, Qi CH, et al. 2001. Regulation of hepatic cytochrome P4502C11 via cAMP: Implications for down-regulation in diabetes, fasting, and inflammation Journal of Pharmacology and Experimental Therapeutics. 297(1): 174-180
39. Shimojo N, Ishizaki T, Imaoka S, et al. 1993. Changes in Amounts of Cytochrome-P450 Isozymes and Levels of Catalytic Activities In Hepatic And Renal Microsomes of Rats With Streptozocin-Induced Diabetes. Biochemical Pharmacology. 46(4): 621-627
Table 1: Primer sequences and expected product sizes for different Cytochrome P450 and internal standard β-Actin [22].
cDNA Forward primer sequence Reverse primer sequence RT-PCR product size
β-Actin
5′-CCTGCTTGCTGATC-CACA 5′-CTGACCGAGCGT-GGCTAC 505 bp
CYP1A1
5′-CTGGTTCTGGATAC-CCAGCTG 5′-CCTAGGGTTGGTTAC-CAGG 331 bp
CYP2A1&2A2
5′-CACAGGGCAGCTC-TATGACA 5′-CAGACCCAGCAAA-GAAGAGG 275 bp
CYP2E1
5′-CTCCTCGTCATATC-CATCTG 5′-GCAGCCAATCA-GAAATGTGG 473 bp
CYP2C11
5′-CTGCTGCTGCT-GAAACACGTG 5′-GGATGACAGCGATAC-TATCAC 248 bp
CYP3A1
5′-ATCCGATATGGAGAT-CAC 5′-GAAGAAGTCCTT-GCTTGC 579 bp
CYP4A1
5′-GGTGACAAAGAACTA-CAGC 5′-AGAGGAGTCTTGAC-CTGCCAG 344 bp
Table 2: Overall summary of CYP expressions with respect to internal standard; β-Actin in control, diabetic and resveratrol administered diabetic (D+RSV) rat liver tissues.
N CYP1A1 CYP2A1&2 CYP2E1 CYP2C11 CYP3A1 CYP4A1
Control 9 0,146±0,044 0,455±0,039 0,904±0,208 2,686±0,504 0,323±0,049 0,221±0,018 Diabetic 9 1,253±0,232 a 0,479±0,113 1,215±0,171 a 0,146±0,030 aa 0,793±0,193 a 0,090±0,023 aa D+RSV 7 1,143±0,434 a 0,386±0,047 0,379±0,128 a,b 0,128±0,035 aa 0,269±0,056 b 0,030±0,009 b
a Represents significance at P < 0,05 as compared with control groups aa Represents significance at P < 0,005 as compared with control groups
Figure 2: Relative mRNA expressions of several CYP isoforms in control, diabetic and resveratrol administered diabetic liver tissues. Measurements were carried out by real time polymerase chain reaction and normalized in response to internal standard.
Figure 1: Products of Reverse Transcriptase Polymerase Chain Reaction (RT-PCR) amplifications of different CYP genes and internal standards from a control animal to show whether selected primer pairs amplify correct products without any sign of by products which is also confirmed by melt analysis in Real Time PCR reactions. Products were resolved by 1.2% agarose gel electrophoresis.
![Table 1: Primer sequences and expected product sizes for different Cytochrome P450 and internal standard β-Actin [22].](https://thumb-eu.123doks.com/thumbv2/9libnet/4547207.82507/7.892.97.797.160.452/primer-sequences-expected-product-different-cytochrome-internal-standard.webp)