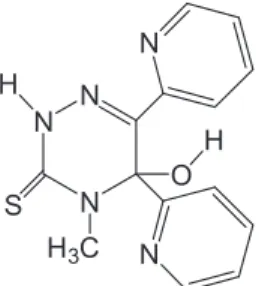
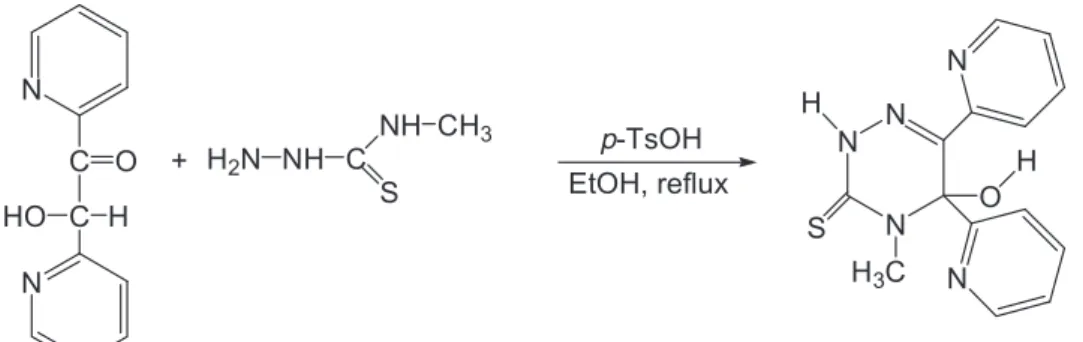
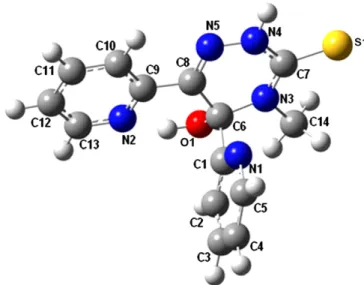
Ab initio and semi-empirical computational studies on 5-hydroxy-4-methyl-5,6-di-pyridin-2-yl-4,5-dihydro-2H-[1,2,4]triazine-3-thione
Tam metin
Şekil


Benzer Belgeler
ÖLÇME, DEĞERLENDİRME VE SINAV HİZMETLERİ GENEL MÜDÜRLÜĞÜ KİTAPÇIK TÜRÜ A.. Cevaplarınızı, cevap kağıdına
[r]
ÖLÇME, DEĞERLENDİRME VE SINAV HİZMETLERİ GENEL MÜDÜRLÜĞÜ KİTAPÇIK TÜRÜ A.. Cevaplarınızı, cevap kâğıdına
ÖLÇME, DEĞERLENDİRME VE SINAV HİZMETLERİ GENEL MÜDÜRLÜĞÜ KİTAPÇIK TÜRÜ A.. Cevaplarınızı, cevap kâğıdına
ÖLÇME, DEĞERLENDİRME VE SINAV HİZMETLERİ GENEL MÜDÜRLÜĞÜ KİTAPÇIK TÜRÜ A.. Cevaplarınızı, cevap kağıdına işaretleyiniz.. FEN
ÖLÇME, DEĞERLENDİRME VE SINAV HİZMETLERİ GENEL MÜDÜRLÜĞÜ KİTAPÇIK TÜRÜ A.. Cevaplarınızı, cevap kâğıdına işaretleyiniz.. T.C. Selanik’in aşağıdaki
ÖLÇME, DEĞERLENDİRME VE SINAV HİZMETLERİ GENEL MÜDÜRLÜĞÜ KİTAPÇIK TÜRÜ A.. Cevaplarınızı, cevap kâğıdına işaretleyiniz.. T.C. Mustafa Kemal, Sofya’da Osmanlı
Bir markette turşular küçük ve büyük boy ka- vanozlarda satılmaktadır. Küçük boy kavanoz- larda 650 gram turşu vardır. Büyük boy kava- nozlarda ise küçük
