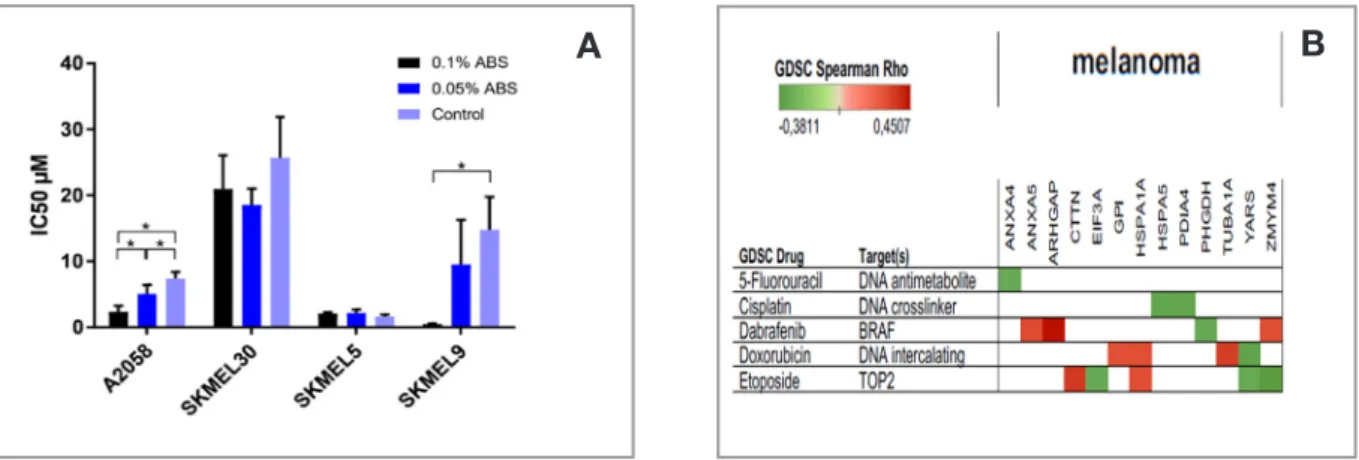
Ankaferd Hemostat Affects Etoposide Resistance of the Malignant Melanoma Cells
Tam metin
Şekil
Benzer Belgeler
Post hoc results revealed that FM patients showed an increased activation in “pain + TENS” condition compared to the “pain + placebo TENS” condition while the brain activity
Tarihî roman olarak kaleme alınan, Osmanlı Devleti'nin KuruluĢ Devrinin konu edinildiği Konak romanında, açık ya da kapalı olsun Anadolu'daki belli
[r]
Vallor felsefi düşüncede, içinde yaşadığımız teknososyal dünyada zorlayıcı du- rumların üstesinden gelebilecek, ahlaki bir karakter geliştirmeye yardım edecek, uygun
Şeyma' nın kaç tane fıstığı kalmıştır?. Alihan' ın 56 armudu
Avrupa Komisyonu, son olarak 10 Kasım 2010 tarihinde “A Strategy for Competitive, Sustainable and Secure Energy” başlıklı COM (2010) 639 sayılı belgede, Birliğin enerji
Biraz daha açmak gerekirse kitap, genel olarak modernite ile başlayan süreçte Türkiye’de yaşanan demokratikleşme ve modernleşme sürecinin 80’lerle beraber ortaya
2 we plot equilibrium transmission spectra of the bare and hydrogenated graphene flakes with single carbon atomic chain electrodes asymmetrically contacted to one of the edge
