* Corresponding author. Tel.: +90-338-226-2000 ; E-mail address: mehmetuzun@kmu.edu.tr (M. Uzun) ISSN: 2149-8024 / DOI: https://doi.org/10.20528/cjsmec.2020.01.004
Research Article
Effect of configuration of shear walls at story plan to seismic
behavior of high-rise reinforced concrete buildings
Mustafa Tolga Çöğürcü
a, Mehmet Uzun
b,*
a Department of Civil Engineering, Konya Technical University, 42075 Konya, Turkey
b Department of Civil Engineering, Karamanoğlu Mehmetbey University, 70100 Karaman, Turkey
ABSTRACT
In developing countries, the need for shelter, working area, shopping and entertain-ment centers is increasing due to the increasing population effect. In order to meet this need, it is necessary to turn to high-rise buildings. Significant damages have been observed as a result of insufficient horizontal displacement stiffness of high-rise buildings in major earthquakes in previous years. It is known that as the height of the structure increases, the displacement demand of the structure also increases. Since it is accepted that the structure will make inelastic deformation in the design of the structure, these displacements increase to very high levels as the number of stories increases. For this reason, damages can be much higher than expected. In order to limit the level of damage that may occur in high-rise buildings, the horizontal dis-placement of buildings is limited in many regulations in our age. This limitation is possible by increasing the rigidity of the structures against horizontal displacement. In recent years, the use of shear wall has increased due to the horizontal displace-ment limitation in the regulations. The use of shear walls in buildings limits the hor-izontal displacement. However, the choice of where the shear walls will be placed on the plan is very important. Failure to place the shear walls correctly may result in additional loads in the structure. It can also lead to torsional irregularity. In this study, a 10-storey reinforced concrete building model was created. Shear wall at the rate of 1% of the plan area of the building was used in the building. The shear walls are arranged in different geometric shapes and different layouts. The earthquake analysis of 5 different models were performed. Equivalent Earthquake Load, Mode Superposition and Time History Analysis methods were used for earthquake analy-sis. The results were compared and a proposal was made for the geometry and con-figuration of the shear wall.
ARTICLE INFO Article history: Received 20 November 2019 Revised 13 January 2020 Accepted 20 January 2020 Keywords: Reinforced concrete High-rise building Shear walls Time-history analysis Mode superposition method
1. Introduction
Earthquake is an oscillatory motion caused by the re-lease of strain energy under or in the earth's crust (Chen and Qian, 2002; Mo and Kuo, 1998). Earthquake oscilla-tions cause large horizontal displacements in buildings. As a result of this, significant damages occur in the build-ings. 95% of Turkey's population is at risk of earth-quakes (Yaman et al., 2019). It is an important issue that the structures show the necessary performance during
an earthquake. Adequate strength, rigidity and durabil-ity are expected from the structures during the earth-quake (Chandiwala, 2012). The use of curtain wall ele-ments that increase the horizontal displacement stiff-ness of buildings during earthquakes prevents story drift of buildings. (Aktan and Kiraç, 2010). The shear walls are vertical elements that resist the horizontal load in the buildings (Nainan and Alice, 2012). The shear walls are a preferred element type in the load-bearing system due to their high rigidity and strength (Firoozabad et al.,
the tendency of these studies. Young-Hun Oh examined the deformation capacity of the shear walls using a dis-placement-based approach (Oh et al., 2006). In Sakcalı et al.’s (2017) study, the earthquake performance of 8-sto-rey reinforced concrete structures with different shear wall ratio examined. Halkude et al. in their study, the ef-fect of the use of different lengths of shear walls in differ-ent places on the plan examined the earthquake perfor-mance (Halkude et al., 2015). In Gent Franch et al.’s (2008) study, they have tried to establish an acceptable connection with the ratio of shear wall to story area by modifying the vulnerability index value for masonry struc-tures. In Rokanuzzaman et al.’s (2017) study, the effects of the configuration of the shear walls at story plan on the 16-storey building are examined under horizontal load.
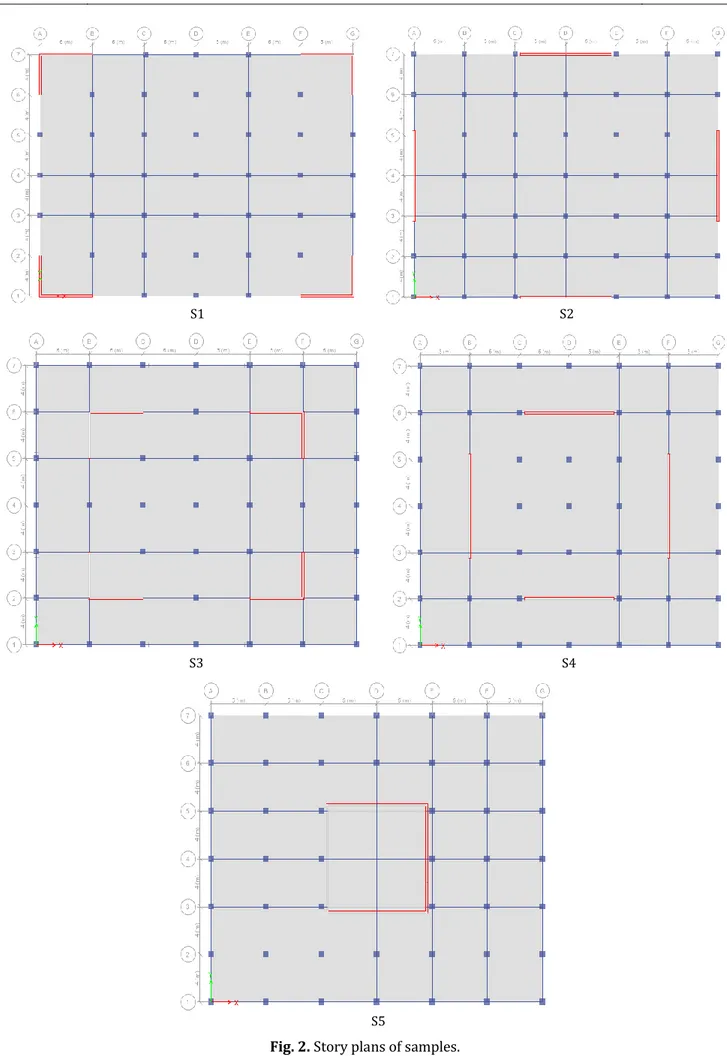
In this study, 5 different shear wall location have been created for a 10 storey reinforced concrete building. The three-dimensional view for the created models is given in Fig. 1. The story plans of the models according to the shear wall locations are given in Fig. 2.
For each model, 1.5 kN/m2 dead load and 5 kN/m2 live load were loaded on the story in addition to the self-weight of the building. The total length of the shear walls is the same for all samples. Additional infilled wall load is not added to the building. It was assumed that the structure was fixed in to the ground. The shear wall ele-ments are modeled as shell eleele-ments. Column and beam dimensions were taken as 50x50 cm and 25x60 cm re-spectively. Slab thickness was taken as 15 cm. The short edge of the shear wall was accepted as 20 cm.
S1 S2
S3 S4
S5
Latitude 40.667344o Longitude 30.408702o SS 1.723 S1 0.466 SDS 1.3784 SD1 1.0569 PGA 0.710 PGV 58.826
ETABS program. Natural vibration period for x and y di-rection is obtained from mode 1 and mode 2 respec-tively. As can be seen from Fig. 4, the natural vibration period of the buildings decrease as the shear wall is taken inwardly from the external axis. As a result, the fact that the shear wall is on the external axis increases the natural vibration period of the building and causes it to be exposed to less earthquake force. The fact that the shear wall is in the center of the building makes the building more rigid.
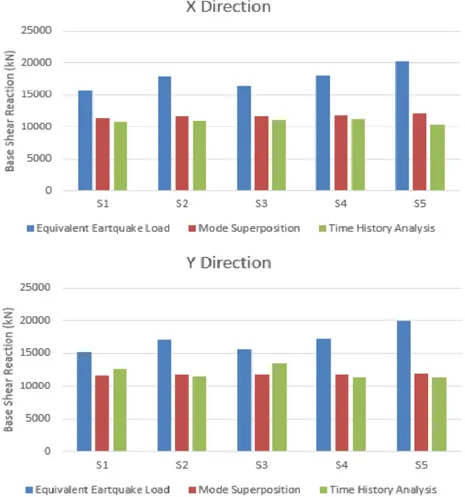
The base shear forces obtained from EEL, MS and TH methods are given in Fig. 5.
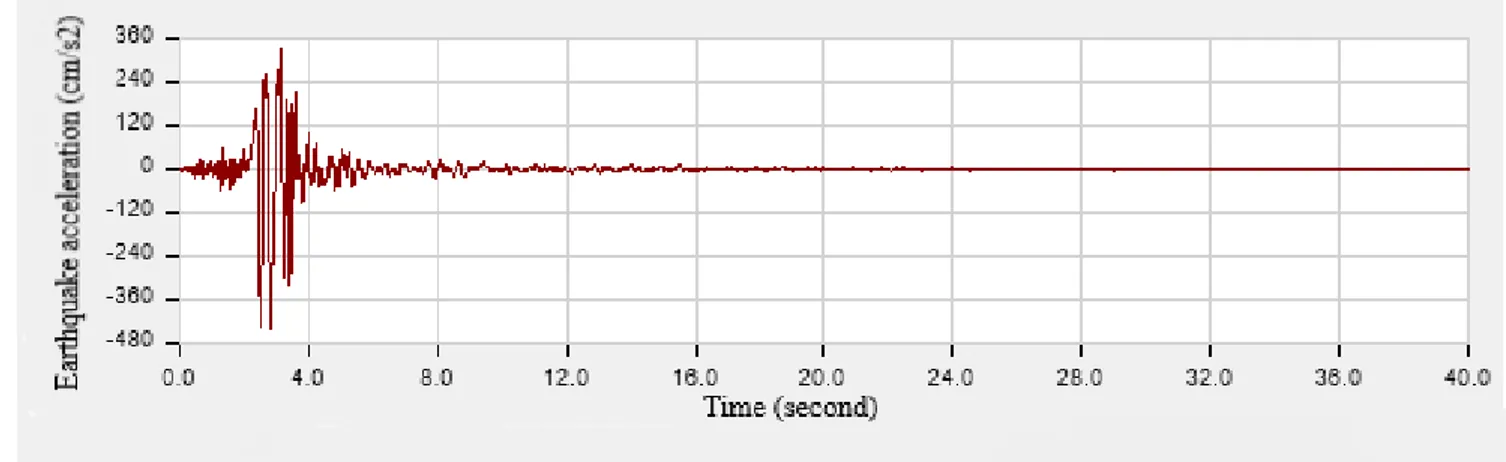
Fig. 3. ALTADENA - Earthquake acceleration record.
Fig. 5. Base shear force of models. As shown in Fig. 5, the shear forces obtained in the
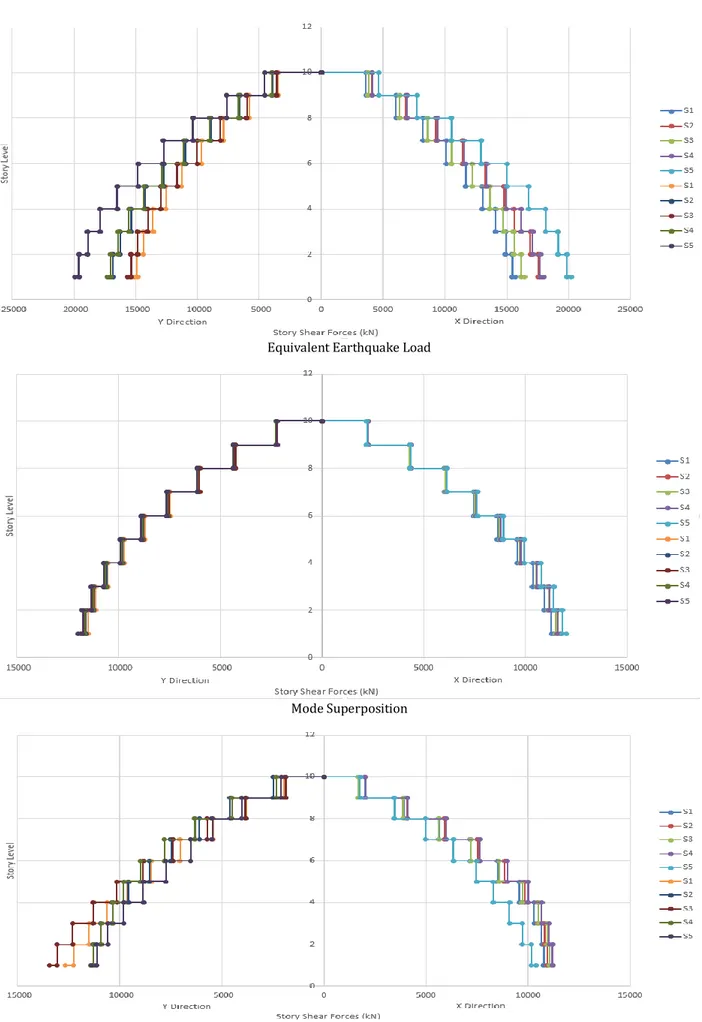
EEL method were higher than the other two methods. It can be understood from this that the EEL method does not provide accurate results in multi-storey buildings. As seen in the analysis methods in MS and TH, the results were very close to each other. Placing the shear wall from the external axis to the internal axis increased the earthquake load affecting the building. Earthquake load increased in all three methods. In addition, it was ob-served that the earthquake load affecting the building decreased when the shear wall were placed at the corner of the building. When the natural vibration periods are examined, the earthquake load that affects the building increases as the natural vibration period of the building decreases. This occurs because the spectral acceleration increases as the natural vibration period decreases. Due to the relationship between the spectral acceleration-natural vibration period curves, the earthquake load af-fecting the building increases for a while. Fig. 6 shows that the shear forces affected to the stories are more var-iable than the other methods in the EEL method. This shows that the EEL method does not give correct results in multi-storey buildings. When the increase rates for earthquake load in the stories are examined, it can be said that it is approximately same for each method. The ratio of shear forces affecting to shear walls to the base shear force is given in Table 2 and Table 3.
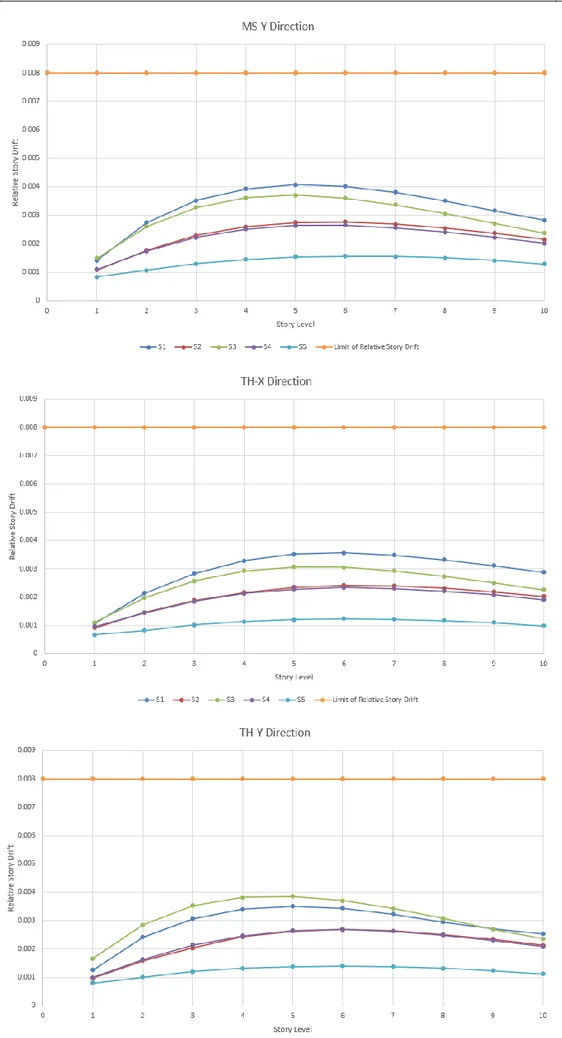
Relative story drifts according to earthquake calcula-tion methods are given in Fig. 7. For each method and di-rection (X and Y) are presented in separate graphs.
4. Conclusions
In this study, earthquake analysis was carried out for 5 different shear wall configurations. Results of the anal-yses are given below:
The natural vibration period of the building decreases as a result of the shear wall being taken in from the external axis.
The fact that the shear wall is on the external axis in-creases the natural vibration period of the building so that it is exposed to less earthquake load.
The shear forces obtained by the EEL method were higher than the other two methods. It can be under-stood from this that the EEL method does not provide accurate results in multi-storey buildings.
Placing the shear wall from the external axis to the in-ternal axis increased the earthquake load affecting the building.
It was observed that when the shear walls were placed at the corner of the building, the earthquake load affecting the building decreased.
As the shear walls are placed from the external axis to the internal axis, the shear force ratio of the shear walls increases. In S5, this ratio increased to 0.95. Relative story drifts were maximized on the 6th story
in all samples. In all samples, the limit value defined in TBDY-2018 has not been exceeded.
When the relative story drift are examined, it is seen that the building behaves more rigid as a result of moving the shear walls from the external axis to the internal axis.
TH 9405 10743 0.88 S2 EEL 16532 17828 0.93 MS 10383 11685 0.89 TH 9714 10953 0.89 S3 EEL 16143 16440 0.98 MS 10804 11653 0.93 TH 10228 11035 0.93 S4 EEL 17994 18024 0.99 MS 11046 11755 0.94 TH 10532 11215 0.94 S5 EEL 19257 20208 0.95 MS 11457 12021 0.95 TH 9897 10382 0.95
Table 3. Ratio of shear force acting on shear wall to base shear force for y direction.
Number of
Model Type of Seismic Analysis on Shear Walls (kN) Shear Force Acting Base Shear Force (kN) Ratio
S1 EEL 12974 15137 0.86 MS 9403 11636 0.81 TH 10267 12695 0.81 S2 EEL 15978 17127 0.93 MS 10383 11685 0.89 TH 10315 11445 0.90 S3 EEL 15244 15644 0.97 MS 10642 11840 0.90 TH 12086 13464 0.90 S4 EEL 16148 17318 0.93 MS 11025 11819 0.93 TH 10643 11418 0.93 S5 EEL 18976 19919 0.95 MS 11403 11819 0.97 TH 10861 11419 0.95
Equivalent Earthquake Load
Mode Superposition
Time History Analysis
Fig. 7. Relative story drift.
Gent Franch KA, Giuliano Morbelli GM, Astroza Inostroza MA, Gori RE (2008). A seismic vulnerability index for confined masonry shear wall buildings and a relationship with the damage. Engineering Structures, 30, 2605–2612.
Halkude SA, Konapure CG, Birajdar SM (2015). Effect of location of shear walls on seismic performance of buildings. International Journal of Current Engineering and Technology, 5(2), 826–833. Mo YL, Kuo CJ (1998). Structural behavior of reinforced concrete
frame-wall components. Materials and Structures, 31, 609–615. Nainan N, Alice TV (2012). Dynamic Response of seismo-resistant
building frames. International Journal of Engineering Science and Technology, 4(5), 1865–1870.
Oh YH, Han SW, Choi YS (2006). Evaluation and improvement of deformation capacities of shear walls using displacement-based seismic design. International Journal of Concrete Structures and Materials, 18(1E), 55–61.
Rokanuzzaman MD, Khanam F, Das A, Chowdhury SR (2017). Effect of location of shear wall on performance of building frame subjected to lateral load. International Journal of Advances in Mechanical and Civil Engineering, 4(6), 51–54.
Sahin H, Alyamac KE, Erdogan AS (2013). Determination of earthquake shear wall ratio in shear wall- frame buildings according to local site classes and number of story. SDU International Technologic Science, 5(1), 74–86.
Sakcalı GB, Tekeli H, Demir F (2017). The effects of shear wall amount on building performance in RC buildings. Sakarya University Journal of Science, 21(2), 157–168.
Ucar T, Merter O (2009). Effect of configuration of shear walls at floor plan to earthquake behavior of shear wall-frame reinforced concrete buildings. Dokuz Eylül University Engineering Faculty Journal of Science and Engineering, 11(2), 11–18.
Yaman S, Tekeli H, Demir F (2019). The effects of shear wall location on building performance in reinforced concrete buildings. European Journal of Science and Technology, 16, 194–204.