Investigations of M
3Al
8O
15:Eu
3+,Dy
3+(M = Ba, Ca, Mg)
phosphors
ESRAO¨ZTURK¨ ∗
Karamano˘glu Mehmetbey University, Engineering Faculty, Department of Materials Science and Engineering, Karaman, Turkey
In this work, aluminate type phosphorescence materials were synthesized via the solid state reaction method and the pho-toluminescence (PL) properties, including excitation and emission bands, were investigated considering the effect of trace amounts of activator (Eu3+) and co-activator (Dy3+). The estimated thermal behavior of the samples at certain temperatures (> 1000 °C) during heat treatment was characterized by differential thermal analysis (DTA) and thermogravimetry (TG). The possible phase formation was characterized by X-ray diffraction (XRD). The morphological characterization of the samples was performed by scanning electron microscopy (SEM). The PL analysis of three samples showed maximum emission bands at around 610 nm, and additionally near 589 nm, 648 nm and 695 nm. The bands were attributed to typical transitions of the Eu3+ions.
Keywords: aluminate phosphors; solid state reaction method; Eu3+; photoluminescence; phase formation © Wroclaw University of Technology.
1.
Introduction
Inorganic phosphors are photoluminescent ma-terials which are excited by photons from an ex-ternal energy source with a wavelength in electro-magnetic spectrum range. Their development has been a subject of widespread research over the past decade.
Photoluminescent inorganic phosphors are es-sentially based on excitation and emission pro-cesses. The excited phosphor absorbs energy, then emission takes place by either the host lattice or by impurity ions doped in trace amounts. The emis-sion commonly originates from the impurity ions by exciting with an external energy source. Thus, the emission color can be adjusted by choosing the proper impurity ion, using the same host lat-tice. Rare-earth (RE) ions are mostly used as im-purity ions for phosphors. Extensive research on rare-earth activated phosphors has been carried out because of their important properties, such as lu-minescent characteristics, thermal stability, envi-ronmental friendliness (non-toxic), corrosion-free
∗E-mail: [email protected]
gas emission, etc. [1, 2]. RE-ions doped materi-als have attracted considerable attention for a long time due to their significant optical, electronic, chemical characteristics, which are suitable for ap-plications such as solid state lighting (fluorescent or light emitting diodes – LEDs), signs and dis-play devices, radiation dosimetry, X-ray imaging, and sensors; they are also used as other functional compounds [2].
Research has proved that RE activated phos-phors can be classified into two types: those with broad and narrow emission bands owing to the d-f transition and the transition between the d-f lev-els, respectively. Eu3+/Eu2+, Ce3+, Tb3+, Gd3+, Yb3+, Dy3+, Sm3+, Tm3+, Er3+, Nd3+, etc., are the most commonly used activator ions or lumines-cent lumines-centers for inorganic phosphors. Among the inorganic based photoluminescent materials, rare-earth-activated alkali aluminates have attracted considerable interest due to their well-known lu-minescent properties. Until now, a large number of new aluminate phosphors have been developed, i.e. the photoluminescence properties of Eu2+/3+, Dy3+, Tb3+, Pr3+/4+, Ce3+, etc., single- or co-doped strontium, calcium, barium or magnesium
aluminates have been studied extensively due to their remarkable emission compared to traditional sulfide phosphors [1,3,4].
Consequently, as the need for novel phosphors for lighting is one of the most important and ur-gent challenges, this paper presents our attempts to use the solid state reaction route for the syn-thesis of some aluminate based phosphors, by sub-stituting europium as activator and dysprosium as co-dopant. In this respect, we aimed to prepare M3Al8O15 (M = Ba, Ca, Mg) phosphors systems and to investigate them by complementary analy-sis, i.e. thermal analysis (DTA/TG/DTG before heat treatments), X-ray diffraction (XRD), scan-ning electron microscopy (SEM) and photolumi-nescence (PL) measurements.
2.
Material and methods
Based on previous studies on aluminate type inorganic phosphor systems, the high temperature solid-state reaction method, also known as the ce-ramic method, was chosen for the production of the samples. As the components of M3Al8O15: REO M = Ba, Ca, Mg and REO = Eu2O3, Dy2O3 were used. Appropriate amounts of high purity raw materials, i.e. 4MgCO3·Mg(OH)2·5H2O (98 %), CaCO3 (99.9 %), BaCO3 (99.9 %), Al2O3 (99.0 %), Eu2O3 (99.99 %) and Dy2O3 (99.99 %) were mixed thoroughly and ground in an agate mortar. Subsequently, the well mixed and ground samples were sintered in pure alumina cru-cibles using an open-atmosphere high-temperature furnace (Protherm PLF 120/5) at 1200 °C for 24 hours, then they were cooled down to room tem-perature slowly. The synthesized phosphors were ground to powder form for characterization.
After preparing the batches, the thermal analy-ses, namely differential thermal analysis (DTA) and thermogravimetric (TG) analysis (Seiko In-struments Inc./Exstar TG/DTA 6200), at a heat-ing rate of 10 °C/min from room temperature to 1300 °C were performed to study the decompo-sition and oxidation processes of the precursor. X-ray analysis was carried out after heat treat-ments, using a BRUKER AXS D8 ADVANCE
model X-ray diffractometer, at 40 kV and 30 mA (CuKα radiation) in a step-scan mode (0.02°/2θ). Scanning electron microscopy (SEM) images were taken on a LEO 440 model scanning electron mi-croscope using an accelerating voltage of 20 kV.
The PL properties, including excitation and emission spectra of the produced phosphors were obtained using a fluorometer (Photon Technology International (PTI), QuantaMasterTM30).
3.
Results and discussion
3.1. Thermal analysis
The thermal behavior of the mixture of all starting materials with a nominal compo-sition, M3Al8O15:REO (M = Ba, Ca, Mg; REO = Eu2O3, Dy2O3) system, which included degradable compounds of BaCO3, CaCO3, and 4MgCO3·Mg(OH)2·5H2O, was characterized by DTA/TG in the 50 °C to 1300 °C temperature range (Fig.1to Fig.3).
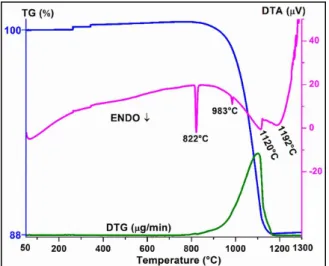
Fig. 1 shows the thermogravimetric analysis curves of all starting materials for Ba3Al8O15:Eu3+,Dy3+ which show a major weight loss between 800 °C to 1200 °C. This weight loss and endothermic peaks are attributed to the decomposing of BaCO3 to CO2 in the sys-tem. The reaction of BaCO3during heat treatment is given as:
BaCO3 ∆
−→ BaO + CO2 (1)
It can be clearly seen from the DTA/TG curves that BaCO3 posses three crystallographic struc-tures that are rhombohedral (natural witherite), β-hexagonal and α-cubic forms, depending on the temperature. The phase transformations in BaCO3 agree with previous studies, including our works. Thus, the first two endothermic peaks are attributed to the orthorhombic to rhombohedral transition at 822 °C and a rhombohedral to cubic phase transi-tion at 983 °C [5].
The total mass loss within 50 °C to 1300 °C is equal to 12.7 %. This result is close to the theoreti-cal mass change which was theoreti-calculated (∼13.0 %).
Fig. 1. DTA/TG curves for Ba3Al8O15:Eu3+,Dy3+
phosphor.
The DTA/TG/DTG analysis results of the start-ing materials for the second phosphor system, Ca3Al8O15:Eu3+,Dy3+, are given in Fig.2.
Fig. 2. DTA/TG curves for Ca3Al8O15:Eu3+,Dy3+
phosphor.
The TG curve demonstrates a major weight loss between 600 °C and 900 °C which is due to the de-composition of CaCO3and the elimination of CO2 in the system (Fig.1). The decomposition reaction during the heating is as follows:
CaCO3 ∆ −
→ CaO + CO2 (2)
Depending on the TG curve, the endothermic peak at 762 °C is related to the decomposition
of CaCO3 [2, 6]. It is clearly proved that the to-tal mass loss ∼18.0 % of the sample is very similar to the calculated mass loss (∼18.3 %).
The DTA/TG/DTG analysis results of the starting materials for the last phosphor system, Mg3Al8O15:Eu3+,Dy3+, is given in Fig.3.
Fig. 3. DTA/TG curves for Mg3Al8O15:Eu3+,Dy3+
phosphor.
As shown in Fig.3, the weight loss in the range of 100 °C to 345 °C and the further decrease be-tween 345 °C and 600 °C can be attributed to the decomposition of 4MgCO3·Mg(OH)2·5H2O as the MgO source for the system. The decomposi-tion reacdecomposi-tions of this material under heating are as follows: 4MgCO3· Mg(OH)2· 5H2O ∆ − → 4MgCO3· Mg(OH)2+ 5H2O (3) 4MgCO3· Mg(OH)2 ∆ − → 4MgCO3+ MgO + H2O (4)
4MgCO3−→ 4MgO + 4CO∆ 2 (5) The first endothermic peak associated with mass loss (TG) occurs at 265 °C which is re-lated to the departure of the hydroxyl group from Mg(OH)2. The second endothermic peak with a greater decrease in mass (TG) at 450 °C proves
the decomposition of MgCO3 changing into MgO [2, 8]. The TG curve exhibits a total mass loss of about ∼25.5 %, which is very similar to the calcu-lated mass loss (∼27.0 %) after the decompositions of the sample were completed.
3.2. X-ray diffraction (XRD) analysis and surface morphology
The heat treatments of each studied phosphor system were designed and carried out according to the DTA/TG results. Due to the first crystal forma-tion and compleforma-tion of decomposiforma-tion which oc-curred at about 800 °C, the heat treatments were carried out as a pre-sintering stage at 800 °C for 2 h and the major sintering process at 1200 °C for 24 h for all studied systems. The major sintering process was determined according to the high tem-perature production process of aluminate systems in previous studies [2]. Therefore the XRD analy-sis was conducted after the major sinterings.
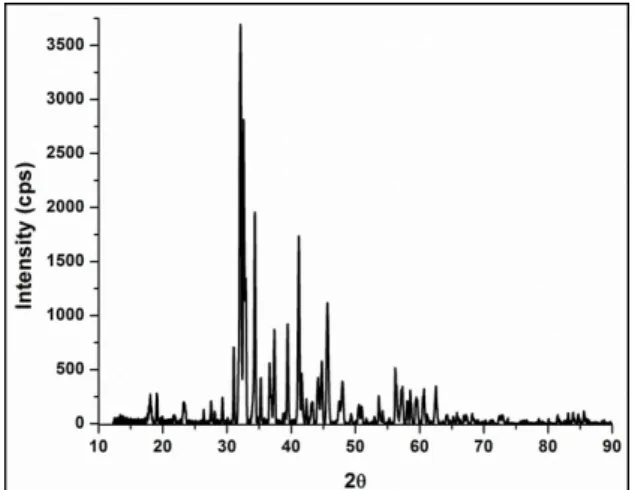
Fig. 4. XRD pattern for Ba3Al8O15:Eu3+,Dy3+.
Fig. 4 to Fig. 6 show the XRD patterns for Ba3Al8O15:Eu3+,Dy3+, Ca3Al8O15:Eu3+,Dy3+, and Mg3Al8O15:Eu3+,Dy3+, respectively.
Although the thermal treatments were carried out for these phosphors according to the DTA/TG results, the XRD results proved that the phosphor samples could not be indexed to any of the desired single phase. It was not possible to synthesize the main crystal structures of the three systems even at high temperatures and long times. Additionally,
Fig. 5. XRD pattern for Ca3Al8O15:Eu3+,Dy3+.
Fig. 6. XRD pattern for Mg3Al8O15:Eu3+,Dy3+.
none of these aluminate structures was reported the literature.
Fig.7shows the images obtained from the scan-ning electron microscopy (SEM) of the phosphors calcined at 1200 °C. The microstructures of the phosphor consist of relatively regular fine grains.
3.3. Photoluminescence properties
Although none of the expected phosphor sys-tems was observed in the obtained XRD pat-terns, and it was not possible to obtain the desired single phase crystals; all of the PL (excitations and emissions) studies gave remarkable results. The excitation and emission bands occurred owing
Fig. 7. SEM images for (a) Ba3Al8O15:Eu3+,Dy3+,
(b) Ca3Al8O15:Eu3+,Dy3+ and (c)
Mg3Al8O15:Eu3+,Dy3+.
to the activated rare-earth ion used for each system, Eu3+, which formed the luminescence center.
Fig.8to Fig.10show the PL spectra of the three samples which have a similar run because of the same activator, namely the Eu3+-ion.
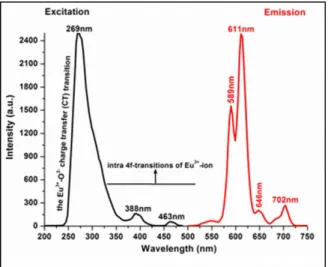
Fig. 8. PL spectra of Ba3Al8O15:Eu3+,Dy3+.
Fig. 9. PL spectra of Ca3Al8O15:Eu3+,Dy3+.
In this research, the PL results of all the sam-ples are both important and striking, despite the XRD results. The PL analyses of the three sam-ples show maximum emission bands at around 610 nm, and additionally near 589 nm, 648 nm and 695 nm, which can be attributed to typical 5D
0 → 7F2, 5D0 →7F1, 5D0 → 7F3, 5D0 →7F4 transitions of the Eu3+ ion, respectively. The most intense and broad band near 286 nm is the charge-transfer state (CTS) band which proves that the typical Eu3+-activated phosphors mostly show strong CTS transition band excitation around 200 nm to 300 nm. Furthermore, the CTS is related
Fig. 10. PL spectra of Mg3Al8O15:Eu3+,Dy3+.
to the electron transferred from the oxygen 2p or-bital to the empty 4f oror-bital of europium, which may be ascribed as ligand-to-Eu3+charge-transfer transitions (LMCT). The other bands between 300 nm to 500 nm originate from intra-4f for-bidden transitions of Eu3+, such as the band at 395 nm, which is associated with the7F0-5L6 tran-sition [2, 9, 10]. Typical emission bands of Dy3+ ions have not been observed in the PL spectrum of all the phosphor systems.
4.
Conclusions
The systems were prepared by a conventional solid-state reaction method under an open atmo-sphere. The most important conclusion from the results is that although none of the phosphors could be indexed to any crystal system on the basis of XRD patterns, the remarkable PL bands were achieved due to the activator ion, Eu3+. In brief, the PL results proved that all of the Eu3+-activated aluminate type hosts exhibited
similar red emission, i.e. maximum emission bands at around 610 nm, and additional emission bands near 589 nm, 648 nm and 695 nm which were attributed to typical 5D0 →7F2, 5D0 →7F2, 5D
0 →7F1, 5D0 → 7F3, 5D0 →7F4 transitions of the Eu3+ ion, respectively. Consequently, it is concluded that the activator ion based PL results for these phosphors are independent of the phase forming process.
Acknowledgements
The author would like to thank to the Karamanoglu Mehmetbey University’s Scientific Research Projects Com-mission (BAP), under the Project Number 05-YL-12, Repub-lic of Turkey, for its financial support.
References
[1] PAWADE V.B., SWART H.C., DHOBLE S.J., Renew. Sust. Energ. Rev., 52 (2015), 596.
[2] ¨OZTURK¨ E., KARACAOGLU E., J. Therm. Anal. Calorim., 119 (2015), 1063.
[3] FENGX., FENGW., WANGK., J. Alloy. Compd., 628 (2015), 343.
[4] MATSUI K., ARIMA M., KANNO H., Opt. Mater., 35 (2013), 1947.
[5] PASIERBP., GAJERSKI R., ROKITA M., REKAS M., Physica B, 304 (2001), 463.
[6] HSUC., Thermochim. Acta, 392 (2002), 157.
[7] FRUTH V., ANDRONESCU C., HORNOIU C., TE -NEA E., RUSU A., SCURTU R., Rom. J. Mater., 41 (2011), 56.
[8] BERBENNIV., MARINIA., MILANESEC., BRUNIG., Z. Naturforsch. B, 63 (2008), 1052.
[9] LIY.C., CHANG Y.H., LINY.F., CHANGY.S., LIN Y.J., J. Alloy. Compd., 439 (2007), 367.
[10] ´ALVAREZE., ZAYASMA E., ALVARADO-RIVERAJ., F ´ELIX-DOM´INGUEZ F., DUARTE-ZAMORANO R.P., CALDINO˜ U., J. Lumin., 153 (2014), 198.
Received 2015-11-12 Accepted 2016-02-24