Ankara Ecz. Fak. Derg. 31 (3)157-168,2002
J. Fac. Pharm, Ankara 31 (3) 157-168,2002
E V A L U A T I O N O F S O M E B I O C H E M I C A L M A R K E R S I N C H R O N I C A L C O H O L U S E A N D A L C O H O L D E P E N D E N C Y
K R O N İ K A L K O L K U L L A N I M I V E A L K O L B A Ğ I M L I L I Ğ I N D A B A Z I B İ Y O K İ M Y A S A L G Ö S T E R G E L E R İ N DEĞERLENDİRİLMESİ
Nevin VURAL* Hülya SAYIN***
University of Ankara Faculty of Pharmacy, Deparment of Toxicology, 06100 Tandoğan ANKARA-TURKEY
**Forensic Medicine Office, 06300 Ankara-TURKEY
A B S T R A C T
The sensitivity, specificity and the total area under the ROC curves of GGT, SGOT, cholesterol and uric acid levels of light-moderate alcohol drinkers (25-40 g alcohol/ day, n=25), heavy alcohol drinkers (over 60 g alcohol/ day, n=35) and alcohol dependent subjects (over 120 g alcohol/day, n=25) were compared with controls (non-drinking, n=40). SGOT and GGT levels indicated a significant increase between all the groups (p<0.001). Uric acid and cholesterol levels of the alcohol user groups have not indicated a significant difference. The sensitivity of the SGOT and GGT in the alcohol dependent groups have been found rather higher than the alcohol drinkers.
Utility of study, GGT, SGOT, SGPT, MCV, uric acid, cholesterol and triglyceride levels in alcoholics admitted 3 weeks inpatient treatment programme were also studied. All the parameters show a significant decrease after 3 weeks treatment within the range p<0.01 and p<0.001 except uric acid and triglyceride. Evaluation of GGT and SGOT using ROC curves seem to be the best biomarkers in the identification of alcohol users who are under the risk of dependency.
Key words: Alcoholism, alcohol use, biochemical markers, ROC analysis. Ö Z E T
Az-orta miktarda alkol kullanan (25-40 g alkol/gün, n=25), fazla miktarda alkol kullanan (>60 g alkol/gün, n=35) ve alkol bağımlılarında (>120 g alkol/gün, n=25) GGT, SGOT, kolesterol ve ürik asit düzeyleri duyarlılık,seçicilik ve ROC eğrisi altında kalan alanlar açısından kontrol grubu (içki içmeyen, n=40) ile karşılaştırılmıştır. SGOT ve GGT düzeyleri bütün gruplar arasında anlamlı bir artış göstermiştir (p<0.001). Alkol kullanan gruplarda ürik asit ve kolesterol düzeyleri anlamlı bir fark göstermemiştir. Alkol bağımlısı olan kişilerde SGOT ve GGT duyarlılığı alkol kullananlardan daha yüksek bulunmuştur.
Üç haftalık tedavi programına katılan alkoliklerin GGT, SGOT, SGPT, MCV, ürik asit, kolesterol ve trigliserid düzeylerinin kullanılabilirliği de bu çalışmada incelenmiştir. Üç haftalık tedavi sonrasında, ürik asit ve trigliserid dışındaki bütün parametrelerde istatistiksel olarak p<0.01 — p<0.001 aralığında anlamlı bir azalma görülmüştür. ROC eğrileri kullanılarak, alkol bağımlılığı riski altında olan alkol kullanan kişilerin tanımlanmasında GGT ve SGOT'nin en iyi biyomarker olduğu gözlenmiştir.
Anahtar kelimeler: Alkolizm, alkol kullanımı, biyokimyasal göstergeler, ROC analizi.
INTRODUCTION
Alcohol consumption has been steadily increasing in Turkey as well as developing and occidental countries. During the last five years alcoholic beverage consumption has been increased by 27 % in this country. It has been reported that alcoholic beverage consumption is about 17 liters per person in 2000.The prevalance of alcoholism in Turkey is 7.9 % of the general population and 31.8 % of adults report alcohol consumption (1).These rates are comparable with Spain where prevalence of alcoholism ranges between 7 and 13 % in the general population (2).
Excessive alcohol use and alcoholism are widely observed risk factors for health damage and social problems. It is a major cause of accidently mainly including traffic cases (3-5).Early identification of alcohol misuse could improve the possibility of early treatment and health damage and social problems relating himself and environment. Although self report or observation by others is in general a valid and important diagnostic tool, it is often difficult to obtain by interview from persons with early stage alcohol related problems.
More objective and effective screening methods are needed for the diagnosis of alcohol misuse. As there is no single biomarker, investigators have been encouraged to search more than 30 biochemical and heamatological parameters as screening tests for alcoholism. Serum glutamic oxalacetic transaminase (SGOT), serum glutamic piruvic transaminase (SGPT), gamma glutamyltransferase ( -GT or GGT), mean corpuscular volume (MCV), alkaline phosphatase, creatinine, tryglyceride and cholesterol have been often used as traditional alcohol markers (2,6-8). In recent years carbohydrate deficient transferrin (CDT) and sialic acid are being studied as new biomarkers for high alcohol consumption and alcoholism (9-12).
The investigation of reliability tests for the markers individually or incombination is also important for the identification of different patterns of alcohol users. The sensitivity, specificity, cut off levels and ROC analysis are considered effective statistical methods (11-13).
Ankara Ecz. Fak. Derg., 31(3)157-168, 2002 159
The aim of this study to compare the individual sensitivity, specificity and cut off values of 4 traditional biomarkers (SGOT, GGT, cholesterol and uric acid) for the identification of different patterns of chronic alcohol misusers and alcoholics and by applying ROC analysis. Moreover changes in 7 biomarkers (in addition to mentioned above biomarkers : SGPT, MCV, Triglyceride) of the alcoholics who take 3 weeks inpatient treatment have been studied.
MATERIALS AND METHODS
Subjects were mainly classified in two groups:
A. Non-hospital alcohol consumers: Subjects were selected among alcohol users who were involved in criminal cases and sent by police to the Forensic Medicine Office (Ankara region) for blood alcohol test . Drivers with positive blood alcohol and reported by themselves use alcohol daily were used the main experimental subject. All subjects were interviewed about their drinking habits, mean daily alcohol consumption. They were also asked to answer a questionnaire form including age, sex, occupation, the amount and kind of alcohol they consume. None of the subjects had a history of liver disease and they have not occupational exposed to organic solvents. They have never been treated for drinking problem. These subjects categorized of the following three groups (4,7,9).
1. Non-drinking group (control subjects) : 40 subjects (all men, mean age 34.92 ± 8.79 years). Totally abstinent person or a person who drinks alcohol only on special occasions (averagly 5-10 occasions per year) and no more than 15 g alcohol on each occasion.
2. Light-moderate alcohol intake group: 25 male subjects (mean age 29.48 ± 7.77 years).These persons had been drinking at least once or twice a month and the average alcohol consumption is 25-40 g/day.
3. Heavy alcohol intake group: 35 subjects (all men, mean age 37.89 ± 8.45 years). These persons had been drinking more than 60 g alcohol per day at least for one year.
B. Alcohol dependent subjects : 25 male subjects (mean age 45.28 ± 5.73 years). These subjects determined alcohol dependents. The assessment was conducted by the psychiatry clinic of the hospital. They have been drinking alcohol more than 120 g/day at least for one year. As their clinical signs indicated alcohol dependency, they have been admitted for 3 weeks inpatient treatment programme for the first time.
Determination of biomarkers
Venous blood samples from all subjects were collected in vacutainer EDTA tubes. Blood cells, plasma and serum samples were stored at -18°C . Plasma GGT, SGOT activities and cholesterol, uric acid levels were determined by using commercial kit reagents (Sigma diagnostic). SGPT activities, triglyceride levels and MCV of the alcohol dependent subjects were determined by routine clinical chemistry methods using standard procedure on an autoanalyzer before and after hospitalisation.
Statistical analyses
Statistical analyses were performed using SPSS packed programme. One way variance analysis was used for the comparison of means of ages. Kruskal-Wallis variance analysis (Kruskal-Wallis one way Anova) was used for the comparison of mean biomarkers of groups. The sensitivity and specificity of biomarkers were calculated. ROC curves and estimated areas under these curves were obtained using the Graph ROC of Windows program. This program also calculated sensitivity, specificity and likelihood ratios at definied cut-off values. The difference and effect of treatment on SGOT, GGT, SGPT and uric acid levels of alcoholic subjects were compared by Wilcoxon matched-pairs signed-ranks test. In the case of MCV, cholesterol and triglyceride values of groups, t-tests (t-tests for paired samples) were used.The performance of total areas under ROC curves of SGOT and GGT were analyzed by Medcalc packed program.
RESULTS AND DISCUSSION
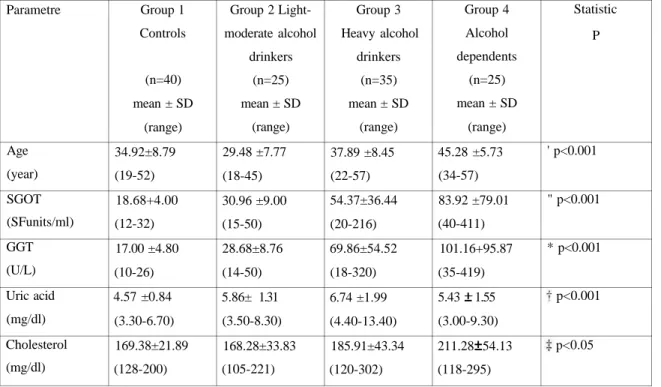
The mean of SGOT, GGT, cholesterol and uric acid levels of the controls, different patterns of drinkers and alcohol dependent subjects is shown in Table 1. The mean ages of the studied groups and the varience analysis of the biomarkers between the groups are shown in Table 1. The results indicate that SGOT and GGT levels are higher in alcohol drinkers than in non-alcoholic groups. These values are also higher in alcoholics than the alcohol drinkers and controls, when these higher levels represented as percentages. Mean SGOT activity in the light-moderate drinkers, heavy drinkers and alcoholic groups were increased by 65.7 % , 191 % and 349.2 % respectively as compared with the control group. Mean GGT activity in the light-moderate drinkers, heavy drinkers and alcoholic groups were increased by 68.7 %, 311 % and 495 % respectively as compared with the control group. These biomarkers are significantly higher in the chronic alcohol users and the alcoholics than the control groups (p<0.001). SGOT and GGT levels were increased in groups with the amount alcohol consumed per day (SGOT and GGT are correlated in groups with groups ethanol consumption).
Ankara Ecz. Fak. Derg., 31 (3) 157-168, 2002 161
Table 1. Comparison of mean values of SGOT, GGT, uric acid and cholesterol of the controls, alcohol drinkers and alcohol dependents.
Parametre Age (year) SGOT (SFunits/ml) GGT (U/L) Uric acid (mg/dl) Cholesterol (mg/dl) Group 1 Controls (n=40) mean ± SD (range) 34.92±8.79 (19-52) 18.68+4.00 (12-32) 17.00 ±4.80 (10-26) 4.57 ±0.84 (3.30-6.70) 169.38±21.89 (128-200) Group 2 Light-moderate alcohol drinkers (n=25) mean ± SD (range) 29.48 ±7.77 (18-45) 30.96 ±9.00 (15-50) 28.68±8.76 (14-50) 5.86± 1.31 (3.50-8.30) 168.28±33.83 (105-221) Group 3 Heavy alcohol drinkers (n=35) mean ± SD (range) 37.89 ±8.45 (22-57) 54.37±36.44 (20-216) 69.86±54.52 (18-320) 6.74 ±1.99 (4.40-13.40) 185.91±43.34 (120-302) Group 4 Alcohol dependents (n=25) mean ± SD (range) 45.28 ±5.73 (34-57) 83.92 ±79.01 (40-411) 101.16+95.87 (35-419) 5.43 1.55 (3.00-9.30) 211.28 54.13 (118-295) Statistic P ' p<0.001 " p<0.001 * p<0.001 p<0.001 p<0.05
' Significant difference between 1-4; 2-3; 2-4; 3-4. " Significant difference between all groups. * Significant difference between all groups. t Significant difference between 1-2; 1-3 ;l-4; 3-4.
Significant difference between 1-4; 2-4. SD: Standart deviation,
n: number of subjects.
Although blood uric acid levels were found within the reference limit in all the groups, uric acid levels were increased 28.2 % in the light-moderate drinkers, 47.5 % in the heavy drinkers and 18.8 % in the alcoholic groups as compared with the control group. The increase in uric acid levels are significantly different as compared to control group (p<0.001).
A significant increase was found for the mean cholesterol levels of the alcohol dependent subjects as compared with the control and light-moderate drinkers (p<0.05). In control group and drinkers, the cholesterol level was found within the reference limit.
Initial analysis (Table 1) indicated that a combination of SGOT and GGT gave the best discrimination between high and low alcohol groups. GGT was superior to SGOT. Cholesterol and uric acid determination did not significantly increase the results.
SGOT and GGT have traditionally been one of the most employed tests to indicate chronic alcoholic abuse. Many investigators have reported SGOT and GGT rather sensitive markers and found higher among the alcohol users (6,7). Also it has been reported, SGOT and GGT activities increase parallel with the amount of alcohol intake (4,7,14-16). Our present study confirms these investigation mentioned above.
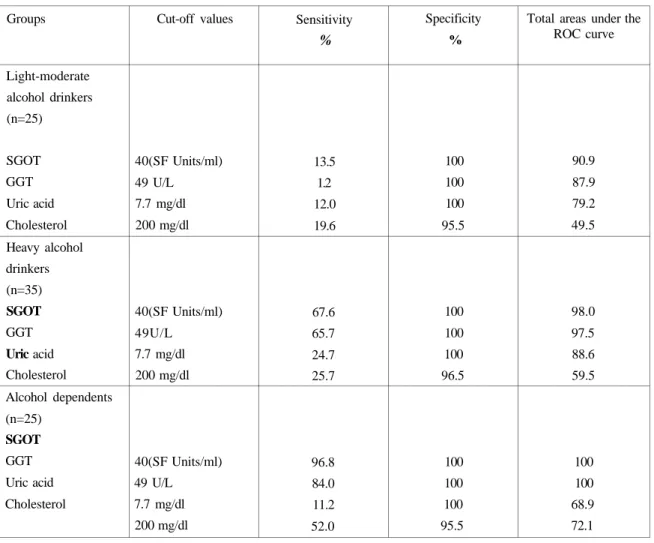
The sensitivity, specificity and total areas under the receiver-operating characteristics (ROC) of SGOT, GGT, uric acid and cholesterol for the different drinking patterns are given in Table 2. ROC curves of the biochemical parameters for the three different drinking patterns are given in Figures 1,2 and 3. Areas under the curve and differences between the areas were calculated accepting the controls as negative group. The reference values for GGT 49 U/L, for SGOT 40 SF Units/ ml, for uric acid 7.7 mg/dl and for cholesterol 200 mg/dl were used as cut-off values. As expected specificity is not influenced by the amount of alcohol use for three biomarkers, the specificity is found high (100 %) and the specificity of cholesterol is very slightly lower (95.5 %).The drinking patterns however influence the sensitivity. Higher values for sensitivity are observed parallel with the amount of alcohol intake for the SGOT, GGT and cholesterol. The highest sensitivity for uric acid is found in the heavy alcohol group (24.7 %). SGOT is the most sensitive (96.8 %), followed by GGT (84.0 %). The largest differences in sensitivity are the alcohol dependents as compared with the light-moderate and heavy alcohol users.
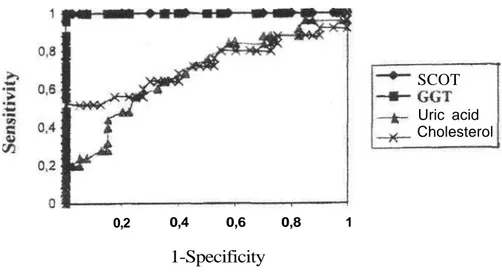
Figures 1-3 represent the ROC curves of the 4 biomarkers for the light-moderate , heavy alcohol drinkers and the alcohol dependent subjects. The ROC curves for SGOT and GGT for all the alcohol drinking groups are somewhat similar and apparently higher than the curves of uric acid and cholesterol. This means blood SGOT and GGT levels for different drinking patterns represent higher sensitivity than for the cholesterol and uric acid levels.
Ankara Ecz. Fak. Derg., 31 (3) 157-168, 2002 163
Table 2. Cut-off values, sensitivity, specificity and total areas under the receiver operating characteristic (ROC) curve for SGOT,GGT, uric acid and cholesterol in different alcohol drinkers. Groups Light-moderate alcohol drinkers (n=25) SGOT GGT Uric acid Cholesterol Heavy alcohol drinkers (n=35) SGOT GGT Uric acid Cholesterol Alcohol dependents (n=25) SGOT GGT Uric acid Cholesterol Cut-off values 40(SF Units/ml) 49 U/L 7.7 mg/dl 200 mg/dl 40(SF Units/ml) 49U/L 7.7 mg/dl 200 mg/dl 40(SF Units/ml) 49 U/L 7.7 mg/dl 200 mg/dl Sensitivity % 13.5 1.2 12.0 19.6 67.6 65.7 24.7 25.7 96.8 84.0 11.2 52.0 Specificity % 100 100 100 95.5 100 100 100 96.5 100 100 100 95.5
Total areas under the ROC curve 90.9 87.9 79.2 49.5 98.0 97.5 88.6 59.5 100 100 68.9 72.1
Figure 1. ROC curves for light-moderate alcohol drinkers.
1-Specificity
SCOT GGT Uric acid Cholesterol 1Figure 2. ROC curves for heavy alcohol drinkers.
0,2 0.4 0,6 0,8
1-Specificity
Figure 3. ROC curves for alcohol dependents.
0,2 0,4 0,6 0,8
1-Specificity
Table 2 gives data on the total areas under the ROC curves of the 4 markers for the different drinking groups and alcohol dependent subjects.The areas of the SGOT and GGT are higher than the uric acid and cholesterol. SGOT and GGT levels for all the alcohol users give a discrimination from the nonalcoholics with the 100 % probability. No significant difference has been found between the performances of the total areas of SGOT and GGT under the ROC curves for the three drinking groups (p>0.05).
1 SCOT
SGOT
GGT
Uric acid
Cholesterol
Uric acid Cholesterol 1Ankara Ecz. Fak. Derg., 31 (3) 157-168, 2002 165
ROC analysis of the SGOT and GGT indicated that light-moderate drinkers, heavy drinkers and alcohol dependents can be separated from the controls with probability of 89.4 %, 97.75 % and 100 % respectively. As agreement with previous observations a significant correlation was obtained between GGT and SGOT (4,9,12).
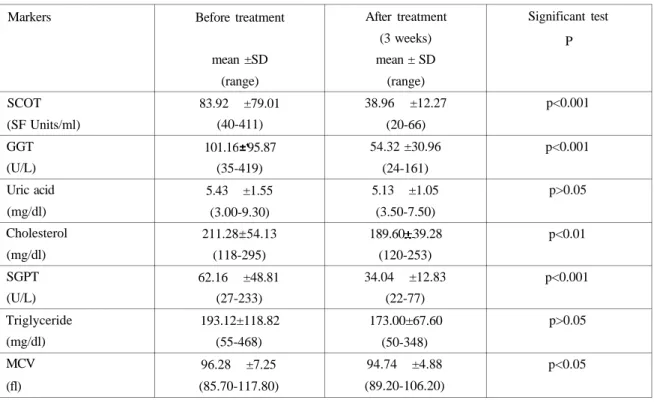
In the second part of the study , the effect of treatment on the biomarkers have been examined. These alcoholics described as the third group in the study A, had a history of chronic alcoholism and a diagnostic criteria for primer alcoholism and alcohol dependence and depression. None of them had a history of liver disease or showed clinical signs of liver disease at the time of admittance for the detoxification treatment for 3 weeks period. They consumed alcohol before the last day admittance inpatient programme. Additionally a follow up study was included with 25 alcoholics. Blood sample (1) was taken an admission to inpatient treatment and sample (2) after 3 weeks treatment. Blood SGOT, GGT, SGPT activities, uric acid, triglyceride, cholesterol levels and mean corpuscular volume of erythrocytes (MCV) of the inpatient alcoholics were measured. The results and statistical evaluation are shown in Table 3.
The estimated significance between the same parameters in the follow up study was based on Wilcoxon matched-pairs signed ranks and t tests. SGOT,SGPT and GGT activities of the alcoholics were found higher than the reference values .The mean levels were decreased (p<0.001) after the 3 weeks treatment. The decrease was estimated about 50 % of the initial levels. SGOT and SGPT levels were decreased within a normal reference levels, although GGT activities have been yet over the normal values.
Mean cell volume (MCV) showed a significant decrease during the treatment (p<0.05), although the values were found higher than the normal reference values before and after the treatment.
Blood cholesterol and triglyceride levels were decreased to normal value ranges during the treatment. The decrease was significant for cholesterol (p<0.01), was not significant for triglyceride (p>0.05).
No significant decrease was found between the uric acid levels in the 3 weeks follow up study (p>0.05). The values for uric acid were within the normal range before and after the treatment.
Table 3.Traditional alcohol marker values in alcoholics in follow up study (the changes in the biomarker values during the 3 weeks, n=25).
Markers SCOT (SF Units/ml) GGT (U/L) Uric acid (mg/dl) Cholesterol (mg/dl) SGPT (U/L) Triglyceride (mg/dl) MCV (fl) Before treatment mean ±SD (range) 83.92 ±79.01 (40-411) 101.16 95.87 (35-419) 5.43 ±1.55 (3.00-9.30) 211.28 54.13 (118-295) 62.16 ±48.81 (27-233) 193.12±118.82 (55-468) 96.28 ±7.25 (85.70-117.80) After treatment (3 weeks) mean ± SD (range) 38.96 ±12.27 (20-66) 54.32 ±30.96 (24-161) 5.13 ±1.05 (3.50-7.50) 189.60 39.28 (120-253) 34.04 ±12.83 (22-77) 173.00±67.60 (50-348) 94.74 ±4.88 (89.20-106.20) Significant test P p<0.001 p<0.001 p>0.05 p<0.01 p<0.001 p>0.05 p<0.05 SD:Standart deviation. n:number of subjects.
It has been observed that the fairly high levels of biomarkers were decreased to the normal reference ranges at the end of treatment period. The patients have taken the medication for abstinence syndrome, electrolyte in balance and depression. Generally three weeks treatment was supportive, the clinical symptoms disappear and the patients feel themselves healthy.
Earlier and the recent studies have indicated that monitoring of SGOT, GGT, SGPT and MCV can detect alcohol dependency. Sensitivity and total ROC areas select inpatient the alcoholics (12,17). In this study, the decrease to the normal value of these biomarkers during the treatment which observed in the present study confirm the other studies (8,10).
In conclusion, monitoring of conventional biochemical markers particularly (SGOT, SGPT, GGT, MCV) indicate and select alcohol misuse who at the risk of alcoholism and alcohol dependency. Although in recent years, the new selective biomarkers CDT (Carbohydrate deficient transferrin) , CDT-GGT combination and Sialic acid have been investigating for the detection of alcoholism which need more costly analytical techniques
Ankara Ecz. Fak. Derg., 31 (3) 157-168, 2002 167
clinical biomarkers which are not specific for the alcohol biomarkers are still effective tools. The statistical evaluation of markers by using ROC curve, specificity and sensitivity confirm these observations.
ACKNOWLEDGEMENT
This work has been supported by the Research Found of Ankara University, Ankara (96-03-00-02).
We wish to thank Doç.Dr.Kamil Nahit Özmenler and Dr. Ali Ceran from the Department of Psychiatry of GATA (Ankara) for providing us the clinical reports and blood samples of alcohol dependent subjects.
REFERENCES
1. Türkiye Yeşilay Cemiyeti Genel Merkezi.Yeşilay Dergisi,796, 26-28 (2000).
2. Girela, E., Villanueva, E., Hernandez-Cueto, C. and Luna, J.D." Comparison of the cage questionnaire versus some biochemical markers in the diagnosis of alcoholism" Alcohol
Alcohol, 29(3), 337-343 (1994).
3. Vural, N. and Sayın, H."Effect of time interval between the traffic case and alcohol test on the legal blood alcohol limit in traffic accidents" Ankara Ecz. Fak. Der., 24(2), 83-94 (1995).
4. Helander, A., Tabakoff, B. and WHO/ISBRA Study Centres. "Biochemical markers of alcohol use and abuse: experiences from the pilot study of the WHO/ISBRA collaborative project on state and trait markers of alcohol" Alcohol Alcohol, 32(2), 133-144 (1997). 5. Sweedler, B. and Stewart, K. "Younger age of drinking onset associated with higher crash
risk" Reporter, 12(1), (2001).
6. Whitehead, T.P., Clarke, C.A. and Whitfield, A.G.W. "Biochemical and hematological markers of alcohol intake" Lancet, 978-981 (1978).
7. Chalmers, D.M., Rinsler, M.G., MacDermott, S., Spicer, C.C. and Levi, A.J. Biochemical and haematological indicators of excessive alcohol consumption" Gut, 992-996(1981).
8. Mundle, G., Ackermann, K., Munkes, J., Steinle, D. and Mann, K." Influence of age, alcohol consumption and abstinence on the sensitivity of carbohydrate deficient transferrin, y-glutamyltransferase and mean corpuscular volume" Alcohol Alcohol, 34(5), 760-766 (1999).
9. Werle, E., Seitz, G.E., Kohl, B., Fiehn, W. and Seitz, H.K. "High-performance liquid
chromatography improves diagnostic efficiency of carbohydrate-deficient transferrin"
Alcohol Alcohol, 32(1), 71-77 (1997).
10. Huseby, N.E., Bjordal, E., Nilssen, O. and Barth, T. "Utility of biological markers during outpatient treatment of alcohol-dependent subjects: carbohydrate-deficient transferrin responds to moderate changes in alcohol consumption" Alcohol Clin. Exp. Res.,
21(7), 1343-1346(1997).
11. Huseby, N.E., Nilssen, O. and Kanitz, R.D. "Evaluation of two biological markers combined as a parameter of alcohol dependency" Alcohol Alcohol, 32(6), 731-737 (1997). 12. Sillanaukee, P., Ponnio, M. and Seppa, K. "Sialic acid: new potential marker of alcohol
abuse" Alcohol Clin. Exp. Res., 23(6), 1039-1043 (1999).
13. Meerkerk, G.J., Njoo, K.H., Bongers, I.M.B., Trienekens, P. and Van Oers, J.A.M. "Comparing the diagnostic accuracy of carbohydrate-deficient transferrin,
-glutamyltransferase and mean cell volume in a general practice population" Alcohol Clin.
Exp. Res., 23(6), 1052-1059 (1999).
14. Bernadt, M.W., Mumford, J., Taylor, C, Smith, B. and Murray, R.M. "Comparison of questionnaire and laboratory tests in the detection of excessive drinking and alcoholism"
Lancet, 325-328 (1982).
15. Thome, J., Foley, P., Gsell, W., Davids, E., Wodarz, N., Wiesbeck, GA., Boning, J. and
Riederer, P. "Increased concentrations of manganese superoxide dismutase in serum of
alcohol-dependent patients" Alcohol Alcohol, 32(1), 65-69 (1997).
16. Foster, J.H. and Peters, T.J. "Impaired sleep in alcohol misusers and dependent alcoholics and the impact upon outcome" Alcohol Clin. Exp. Res., 23(6), 1044-1051 (1999).
17. Wetterling, T., Kanitz, R.D., Veltrup, C. and Driessen, M. "Clinical predictors of alcohol withdrawal delirium" Alcohol Clin. Exp. Res., 18(5), 1100-1102 (1994).
Başvuru Tarihi: 26.04.2002 Kabul Tarihi: 13.06.2002