Heterostructured MgO/ZnO photocatalysts: Synthesis,
Characterization and UV Light-Induced Photocatalytic Activity
Using Model Pollutant 2,6-dichlorophenol
1A. I. Vaizogullar*
Medical Services and Techniques Department, Vocational School of Health Services, Muğla Sıtkı Koçman University, Muğla, Menteşe, 48000 Turkey
*e-mail: [email protected]
Received May 11, 2017; in final form, December 21, 2017
Abstract—ZnO and MgO/ZnO (mass ratio 2 : 5, 5 : 5 and 8 : 5) heterostructure photocatalysts (Mg2Zn5,
Mg5Zn5 and Mg8Zn5, respectively) were successfully synthesized via co-precipitation method. MgO/ZnO composites were characterized by scanning electron microscopy (SEM), X-Ray diffraction and low tempera-ture nitrogen adsorption–desorption isotherm. According to SEM images all composites consisted of spher-ical granules with particle sizes of 30–50 nm. The band gap value of ZnO was found to be lower than that of MgO/ZnO composites as observed during the optical studies. Pure ZnO showed lower photocatalytic activity (38%) in the degradation of 2,6-dichlorophenol (2,6-DCP) than MgO/ZnO composites. Mg5Zn5 composite
with a higher concentration of defects in crystallites was more active in the photocatalytic degradation (79.5%) than Mg8Zn5 (61.2%) and Mg2Zn5 (63.5%). High-resolution mass spectrometry-and UV-Vis spec-troscopic analysis of the by-products, derived from model pollutant 2,6-DCP, proved the successful photo-catalytic performance of Mg5Zn5 under the UV light. The synthesized composites are future candidates
against other potential environmental pollutants.
Keywords: phenol, advanced oxidation, chloro-organic pollutants, photodegradation, MgO/ZnO photocatalyst DOI: 10.1134/S0023158418040146
Industries are becoming the backbone of econo-mies as well as a job market. Together with their bene-fits, they also carry drawbacks. One of the most important problems associated with the industrial development is the sewerage wastewater. Although it should be treated and then released into the environ-ment, very few countries perform this practice due the cost or complications in the procedures.
There are various useful processes to treat wastewa-ter such as adsorption, membrane systems and electro-coagulation. These processes are either expensive or painstaking. In this regard, semiconductor catalysts are most suitable, popular and cheap as they utilize sunlight as renewable energy [1]. As an example, ZnO, a photocatalyst, has been reported as non-toxic, highly photosensitive, possessing strong oxidizing power and photochemical stability [2, 3]. Pure ZnO has a large band gap energy i.e. 3.2 eV. In the presence of UV/vis-ible light, the electrons in ZnO are excited from the valence band to the conduction band. The subsequent drift of electron-hole pairs from the ZnO surface after
this excitation initiates the photocatalytic reaction. The lower separation rate of electron-hole pairs reduces photocatalytic reaction yield. This problem can be tackled using coupled structure semiconduc-tors. This definition addresses two different semicon-ductors present together in a photocatalytic system as hetero-junctions to show enhanced photocatalytic activity [4].
ZnO can be used in combination with different metal oxides i.e. MgO, CuO, Fe2O3 etc. Mg-doped Zn
semiconductors have shown surprising results. Kulub-nuan et al. [5] have synthesized MgO/ZnO nanocom-posites by a hydrothermal method and found that photocatalytic degradation is inversely proportional to the amount of MgO. Zhao and coworkers [6] have reported morphological structure of MgO/ZnO as nanosheetts where MgO caused zigzag edges with angles of 120° in the MgO/ZnO system. Al-Naser et al. [7] have synthesized Zn1 – xMgxO (x = 0, 2 and 5%) microtubes via microwave heating method. They emphasized that UV-Vis absorption peak related to ZnO showed blue shift from λmax = 379 (3.27 eV) to
370 nm (3.35 eV) for Zn0.95Mg0.05O microtubes when 1The article is published in the original.
MgO content was increased. Bobu and coworkers [8] observed hyperchromic shift in UV and green emis-sion when MgO content was decreased. Suwanboon et al. [9] have synthesized composite Zn1 – xMgxO
nanostructures by the sol–gel method. They found a decrease in crystal size when Mg content was increased to x = 0.05. The prepared Zn0.95Mg0.05O
cat-alyst exhibited higher efficiency in the degradation of methylene blue.
The results outlined above suggest that a propor-tional increase of MgO does not improve catalytic and optical properties of ZnO. In this study, we have intro-duced different amounts of MgO into ZnO to obtain MgO/ZnO nanocomposites by co-precipitation method using N-propylamine as stabilizer. Herein, we also report the optical, structural and photocatalytic properties of MgO/ZnO composites in the degrada-tion of 2,6-dichlorophenol (2,6-DCP).
EXPERIMENTAL
Preparation of ZnO and MgO/ZnO Nanocomposites
Pure ZnO particles were synthesized by chemical precipitation method. To prepare solution A, 64 g (0.296 mol) of Zn(Ac)2 ⋅ 2H2O (≥97%, Merck) was
dissolved in 200 mL of distilled water. Then, to solu-tion A 53 mL of 0.1 M NH4OH solution (97%, Carlo
Erba) was dropped and stirred for 4 h. The reaction mixture was filtered and washed with distilled water, dried at 80°C for 4 h and calcined at 600°C for 3 h.
A series of MgO/ZnO composites with various MgO content was prepared by co-precipitation method. To prepare solution A, 0.062 mol of Zn(Ac)2· 2H2O (Sigma-Aldrich) was dissolved in
water/n-propylamine (100 mL) solutions (4 : 1, v/v) and stirred at 45°C for 30 min. Stoichiometric amounts (30, 50, 60 wt %) of Mg(NO3)2 · 6H2O were added to solution A with stirring to synthesize MgO/ZnO composite catalyst. Then, to the mixture 0.1 M of ammonia hydroxide (65 mL) (Merck) was dropped and stirred at 45°C for 4 h. Solid particles thus obtained were filtered and washed thrice with dis-tilled water. The samples were dried at 80°C in an oven and calcined at 600°C for 4 h. The synthesized MgO/ZnO composites were denoted as Mg2Zn5,
Mg5Zn5 and Mg8Zn5 where the subscripts signify the
weight amounts of MgO and ZnO in the composites.
Characterization and Photocatalytic Activity Measurements
The crystalline structure was examined by XRD (Dmax 350, Rigaku, Japan) using CuKα radiation (λ = 0.154056 nm). The microstructure and shape of the particles were investigated using a scanning electron
microscope (SEM) (JSM-7600F, JEOL, Japan). Ele-mental composition was determined using an EDAX analyzer (JSM-7600F). BET surface area, pore vol-ume, and pore size were measured using a ASAP 2010 (Micromeritics Instrument, USA) with N2 adsorption at 77.35 K.
A specially designed UV reactor was used in the photolytic experiments with five UV light sources (254 nm, 20 W) at ambient temperature and atmospheric pressure. In addition to the photocatalytic kinetics experiments, 2,6-dichlorophenol (2,6-DCP) decom-position intermediates were also evaluated using UV-visible spectroscopy and high-resolution mass spec-trometry (HRMS) at different intervals of degradation procedure. HRMS analyses were carried out using a SYNAPT G1 MS system (Waters Corp., USA) with experimental conditions as follows: sampling cone 30 V, extraction cone 4 V, source temperature 80°C, desol-vation temperature 250°C and capillary voltage 2 kV.
RESULTS AND DISCUSSION
SEM Analyses
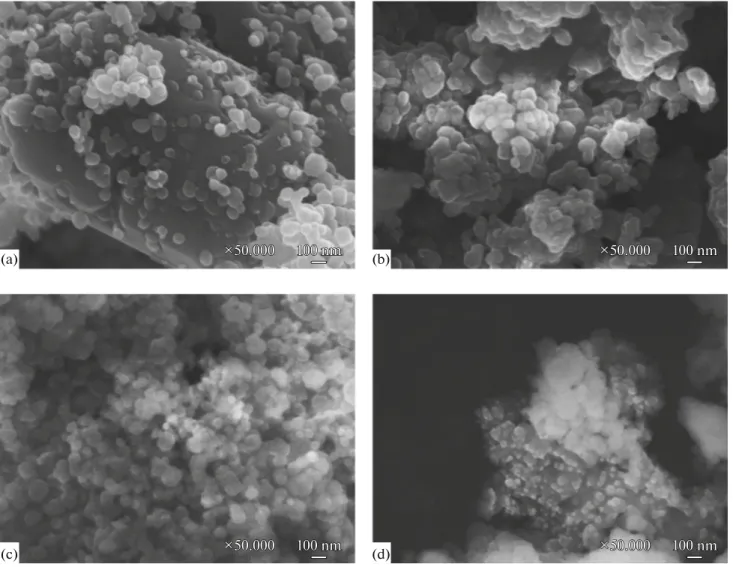
SEM analyses (Fig. 1) were carried out to study the morphology of the prepared catalysts. Morphological features were nearly the same for all samples. The images of pure ZnO and all composites show aggre-gates of smaller particles. The aggregation density of the composites was increased with increasing MgO content. It is expected that coarsening can negatively affect the photocatalytic activity of the composites in the degradation of organic pollutants. SEM results are consistent with results of XRD measurements (Fig. 2). In addition, the size of secondary particles of pure ZnO, Mg2Zn5 and Mg5Zn5 was about 100 nm while in
was 50 nm in the case of Mg8Zn5.
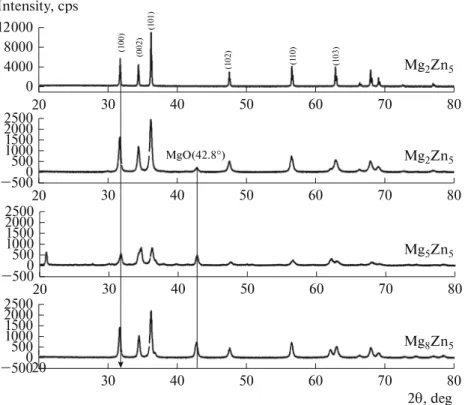
Figure 2 shows XRD pattern of the prepared com-posites. In all patterns, the wurtzite structure of hexag-onal ZnO can be recognized as the main phase (JPDS 36-1451). In addition, the peak at 2θ = 42.8° due to MgO is clearly seen in the MgO/ZnO samples (JPDS-89-7746) indicating the formation of the composites. Generally, the peak intensity of MgO increases with increasing amount of MgO. On the contrary, the peak height of ZnO decreases with concomitant broadening as evidenced by the XRD patterns of Mg5Zn5 catalysis.
A possible explanation might be that MgO is well dis-persed onto ZnO surface. Broadening of ZnO peaks indicates that Mg5Zn5 particles have a smaller size as compared to other samples. Higher density of crystal-line defects in Mg5Zn5 catalyst has already been
The crystal sizes of the prepared catalysts were cal-culated (Table 1) using Scherrer equation (eq. 1).
(1)
where d is the average particle size, B is the Scherrer constant (0.94), λ is the wavelength of the X-Ray, β1/2
is full width at half maximum of the diffraction peak and θ is the diffraction angle. Pure ZnO particles showed larger crystallite sizes due to higher crystallin-ity (Table 1). In addition, it appears that the crystal size initially decreased and then increased as a func-tion of MgO content.
The differences in crystal sizes may be due to two reasons. First, the particle radius of Mg2+ is similar
with the bulk ZnO exciton Bohr radius, so, quantum confinement effects can be expected [11]. Second, Zener pinning effect can be considered [5]. The crystal size of composites may be affected by changing the MgO content. The strong ZnO peaks (Fig. 2) shows
1 2
Bλ , β cosθ
d =
that the ZnO particles are well crystallized by the ther-mal annealing at 600°C [12]. Estimated error for ZnO and MgO in the XRD results for its characteristic peaks was obtained below 36° (2θ degree). The observed shifts in the XRD results confirm the pres-ence of crystallite defects in the composite structure.
Now we can discuss the effect of stress on the crys-tallite size. The magnitude of stress can be calculated using below equation 2 [13] with the values tabulated in Table 1.
(2)
where Csample is the lattice constant of ZnO and Cbulk is
the strain free lattice constant of ZnO (5.206 Å). Stress undergoes transformation from a positive tensile to a negative compressive form that would lead to decline in the crystal size. It is possible that the stress prevents the growth of composite particles [13].
(
)
9 Sample Bulk Bulk 233 10 , C C C − × − σ =Fig. 1. SEM images of ZnO (a), Mg2Zn5 (b), Mg5Zn5 (c) and Mg8Zn5 (d) composites. 100 nm 100 nm 100 nm ×50.000 ×50.000 ×50.000 100 nm 100 nm 100 nm ×50.000 ×50.000 ×50.000 ×50.000×50.000×50.000 100 nm100 nm100 nm 100 nm 100 nm 100 nm ×50.000 ×50.000 ×50.000 (a) (b) (c) (d)
Fig. 2. XRD results of ZnO and MgO/ZnO composites. 2θ, deg 2500 1000 500 0 500 80 20 40 30 50 60 70 2000 1500 Mg8Zn5 2500 1000 500 0 500 80 20 30 40 50 60 70 2000 1500 Mg5Zn5 2500 1000 500 0 500 80 20 30 40 50 60 70 2000 1500 Mg2Zn5 MgO(42.8°) 12 000 0 80 20 30 40 50 60 70 8000 Mg2Zn5 4000 Intensity, cps (1 00) (002) (1 0 1 ) (1 02) (110 ) (1 03) Optical Properties
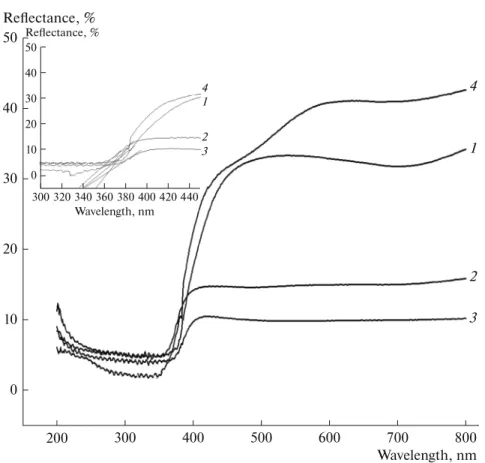
The effect of MgO content on the band gap value was also investigated (Fig. 3). Each sample has a high absorbance around 300–400 nm. The optical band gap value was determined using equation, where λ is the onset to the rising part to the x-axis of the plots shown by the dotted line. The obtained Eg
value of each sample is higher than that of ZnO (3.44 eV) (Table 1). MgO/ZnO composites possess ordered structure and have fewer defects than ZnO. Eg values
of Mg2Zn5, Mg5Zn5 and Mg8Zn5 composites were
found to be 3.54, 3.49 and 3.58 eV, respectively (Fig. 3, inset). These values ref lect the presence of both metal oxides; and MgO presence causes a blue shift [14], especially pronounced at higher amounts of MgO.
g
1240 λ
E =
Increased amounts of MgO slightly increase the sepa-ration between defect levels. This situation leads to a blue shift in emission for ZnO that possibly originates from the Zni (interstitial) defect [15]. The above dis-cussion supports the conceptual premise that a lower
Eg value of Mg5Zn5 catalyst within the MgO/ZnO
composites indicates an increased population of crys-talline defects in the Mg5Zn5 composite [16].
Photoluminescence Analysis (PL)
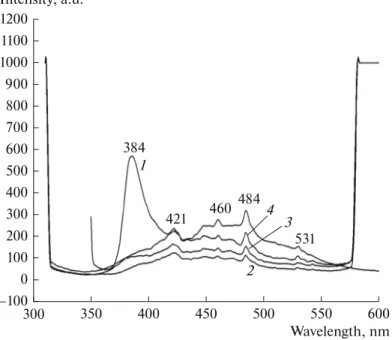
Photoluminescence spectra of the ZnO and MgO/ZnO composites with excite on emission at 300 nm are presented in Fig. 4. The PL spectrum of the ZnO shows a sharp UV emission peak at 384 nm due to extinction of excitons [17]. Also, blue-green emission
Table 1. The physical properties and kinetic results of each sample Catalyst dMgO, nm dZnO, nm Lattice
constant c, Å σ, 109 Pa Eg, eV BET, m2/g k × 10–3, min–1 ZnO – 33.6 5.205 0.044 3.40 3.6 4.8 Mg2Zn5 25.5 26.9 5.198 0.358 3.54 74 8.7 Mg5Zn5 24.2 16.1 5.216 –0.447 3.49 57 14.2 Mg8Zn5 26.1 30.4 5.192 0.357 3.58 67 5.1
bands at 421, 460 and 484 nm are present in the spec-trum. The green emission band at 531 nm indicates impurities in structure such as Zn interstitials (Zni)
and oxygen vacancy (Ov) [18]. The PL spectrum of the
MgO/ZnO samples contains UV and visible emission peaks of lower intensity as compared to those of ZnO. This UV emission peak confirms electron transition from a lower conduction band to the valence band. The population of Zn interstitial defects (Zni) is fairly sparse in the MgO/ZnO composite as shown by a small PL intensity (Fig. 4). For MgO/ZnO compos-ites, the intensity of blue emission has increased due to the interstitial Mg (Mgi) and Zn vacancy (Znv)
recom-bination [19]. It can thus be suggested that within creasing MgO content, the concentration of surface defects in the MgO/ZnO composite increases until MgO content reached its optimum value. In addition, the recombination of an electron trapped in Znv could
cause a rising to blue emission in MgO/ZnO compos-ites. As a result, higher PL intensity and red shift from the exciton absorption peak ref lects an increased pop-ulation of crystallite defects in a certain material. Therefore, it seems that Mg5Zn5 composite has more
surface defect sites than Mg2Zn5 and Mg8Zn5 compos-ites, excellent photocatalytic activity of which can be clearly recognized on Figs 5 and 6.
Kinetic and Photocatalytic Experiments
The photocatalytic activity of MgO/ZnO compos-ites was evaluated following the degradation of 2,6-DCP in a specially designed UV reactor. A 2,6-2,6-DCP stock solution (10 mg/L) was freshly prepared. Ali-quots of 50 mL from this solution and 0.1 g of catalyst were transferred into the UV reactor and stirred for 60 min in dark to obtain adsorption-desorption equi-librium. After every 15 min, 1 mL of sample was with-drawn and filtered to monitor degradation rates. The degradation progress was monitored spectrophoto-metrically (Dr. Lange 1601 UV-vis) at λmax = 298 nm. The degradation (%) of 2,6-DCP was calculated using the following equation:
(3)
where are the initial and final absorbencies of 2,6-DCP. According to the Beer–Lambert law, ini-tial and final absorbencies correspond to the iniini-tial ( and final ( ) concentrations of 2,6-DCP [16].
Results obtained from photocatalytic activity are shown in Fig. 5. Pure ZnO exhibited lower photocata-lytic activity (38%) due to either lower inhibition of e–-h+
pairs or lower BET surface area. With increasing amount of MgO in ZnO photocatalytic activity
0 0 0 0 % Degradation C C 100 A At, C A − − = × = 0 and t A A 0) C C
Fig. 3. UV-DRS spectra of ZnO (1) and MgO/ZnO composites: (2) Mg5Zn5, (3) Mg5Zn5, (4) Mg2Zn5.
50 20 10 0 800 400 300 200 Reflectance, % Wavelength, nm 700 600 500 40 30 50 20 10 0 320 300 Reflectance, % Wavelength, nm 360 340 40 30 420 400 380 440 4 1 2 3 4 1 2 3
increased. Within various MgO/ZnO composites Mg5Zn5 catalyst exhibited an efficient photoactivity (79.5%) in degradation of 2,6-DCP. Under the same conditions, the yield of degradation products was 63 and 61%, for Mg2Zn5 and Mg8Zn5, respectively. These
results can be related to a larger specific surface area of Mg2Zn5 (74 m2/g) compared to that of Mg
8Zn5
(67 m2/g). Thus, higher adsorption ability of 2,6-DCP
on the composite surface provided efficient degrada-tion (Table 1). Addidegrada-tionally, a higher degree of
aggre-gation estimated for the Mg8Zn5 catalyst may have
been a reason why its photocatalytic activity is lower than that shown by the Mg2Zn5 sample.
Mg5Zn5 catalyst showed a higher photocatalytic activity (79.5%) in the degradation of 2,6-DCP. Pseudo-first order kinetic equation can be used to explain the sequence of the photocatalytic reaction. First order kinetic rate k (min–1) for 2,6-DCP
degra-dation can be calculated by plotting vs time (t)
(Fig. 6). A higher rate constant means more efficient degradation (Table 1) [17]. Figure 7 shows UV-vis
0
lnC
C
Fig. 4. PL spectra of ZnO (1) and MgO/ZnO composites: (2) Mg2Zn5, (3) Mg8Zn5, (4) Mg5Zn5.
200 100 600 400 350 300 Intensity, a.u. Wavelength, nm 550 500 450 400 300 1 2 3 –100 0 1100 1000 900 800 700 600 500 1200 4 384 421 460 484 531
Fig. 5. Degradation kinetics of ZnO (1) and MgO/ZnO
composites: (2) Mg2Zn5, (3) Mg8Zn5, (4) Mg5Zn5. 100 80 60 40 20 0 20 80 100 Degradation, % Time, min 40 60 4 2 3 1
Fig. 6. Photocatalytic kinetics of ZnO (1) and the
as-pre-pared MgO/ZnO composites: (2) Mg2Zn5, (3) Mg8Zn5,
(4) Mg5Zn5. 1.6 1.4 0.4 0.2 0 20 80 100 ln(C0/C) Time, min 40 60 4 2 3 1 1.2 1.0 0.8 0.6 y = 0.0142x + 0.2781 R2 = 0.9844 y = 0.0087x + 0.2683 R2 = 0.9704 y = 0.0051x + 0.5325 R2 = 0.8445 y = 0.0048x + 0.0767 R2 = 0.9623
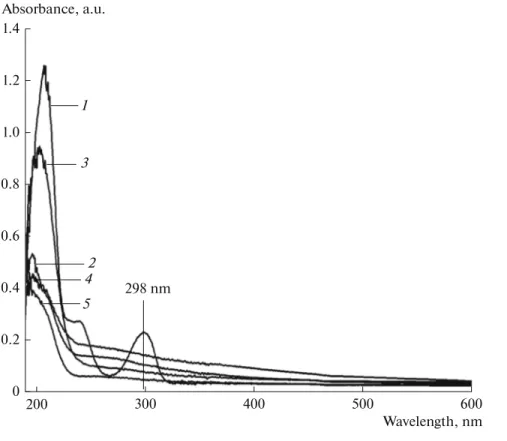
spectra of 2,6-DCP decomposition 1registered at dif-ferent time intervals. After 90 min, there is a remark-able decrease in the absorbance that confirms the effective decomposition of 2,6-DCP in the presence of the Mg5Zn5 catalyst.
Interestingly, the BET surface area of Mg5Zn5 was
found to be smaller (57 m2/g) than that of Mg
2Zn5 and
Mg8Zn5 composites. It can be assumed that positive
results obtained from the photocatalytic activity of Mg5Zn5 catalyst are not due to the surface area of the
catalysts. The band gap value of MgO was estimated to be higher than that of ZnO. In other words, the con-duction and valence band values are between the MgO band offsets (Fig. 8) [18]. The photocatalytic perfor-mance of Mg5Zn5 can be associated with the crystallite
defects as explained by the following argumentation. (i) The 2,6-DCP molecules adsorbed on the cata-lyst surface and also the electrons in the valence band (VB) of ZnO were excited to its defect level, which exhibited extra holes ( in the ZnO and conduction band (CB) level. The oxygen vacancies that lie below the composite surface can capture a hole in the defect level to be transformed into species
h ) +
( )
V0( )
h+( )
V0 +[13]. This species could catch an electron to form oxygen vacancy .
(ii) The photoexcited electrons in the defect level of ZnO can also be transferred to its CB to form
superox-0
V+
( )
OvFig. 7. UV-vis spectra of 2,6-DCP solutions using Mg5Zn5 catalyst at different degradation times, min: (1) 0, (2) 15, (3) 30, (4) 60, (5) 90. 1.4 0.6 0.4 0.2 0 600 500 400 300 200 Absorbance, a.u. Wavelength, nm 0.8 1.2 1.0 1 2 3 4 5 298 nm
Fig. 8. Schematic illustration of photocatalytic mechanism of Mg5Zn5 composite. Defect level ZnO e–e– e– e– h+ h+h+ e–+O2 O2 – h+ + V 0 V0+ h+ +OH– OH–
ide radicals. Additionally, the photogenerated holes in the VB level of ZnO are able to produce hydroxide rad-icals, which decompose 2,6-DCP molecules.
(iii) The migrating electrons of ZnO in the defect level and its CB electrons can generate superoxide radicals and photogenerated holes in the VB level of ZnO to produce hydroxide radicals by reacting with and hydroxide, respectively.
The inhibition of the recombination rate of elec-tron-hole pairs results in an efficient degradation in the presence of the Mg5Zn5 catalyst (Fig. 8). Also, the Eg values of each composite are slightly different.
These results indicate that the band gap is hardly a pri-mary factor that affects the photocatalytic perfor-mance of MgO/ZnO composites in the degradation of 2,6-DCP.
( )
• 2 O−( )
• OH 2 O Photocatalytic MechanismIt is well known that active oxidizing species i.e. appears during the light irradiation and that they are responsible for the degradation of dye molecules under study. The photoexcited electrons and the adsorbed O2 on the catalyst surface produce
superoxide radicals and the photogenerated holes, while water is the source of hydroxyl radicals . Isopropanol (IPA), potassium iodide (KI) and ascorbic acid (AA) are used as scavengers to explain the catalytic mechanism for MgO/ZnO composites [19]. Figure 9 shows the degradation of 2,6-DCP in the presence of scavengers. The degree of degradat ion decreased from 79.5% (no scavenger) to 65 and 61% when 1 mmol/L of IPA and KI were used, respec-tively. These results reveal that OH∙ radical plays a minor role in the degradation of 2,6-DCP. To study the role of radical, ascorbic acid (1 mmol/L) was used as a superoxide scavenger [20]. A significant decrease (to 34.5%) in the photodegradation of 2,6-DCP could then be observed (Fig. 8). It can be thus inferred that the superoxide radical plays a major role while the contribution of OH∙ in the photodegra-dation of 2,6-DCP is less significant. The use of superoxide radical markedly inhibited the pho-tocatalytic activity of Mg5Zn5 (Fig. 9).
HRMS Analyses
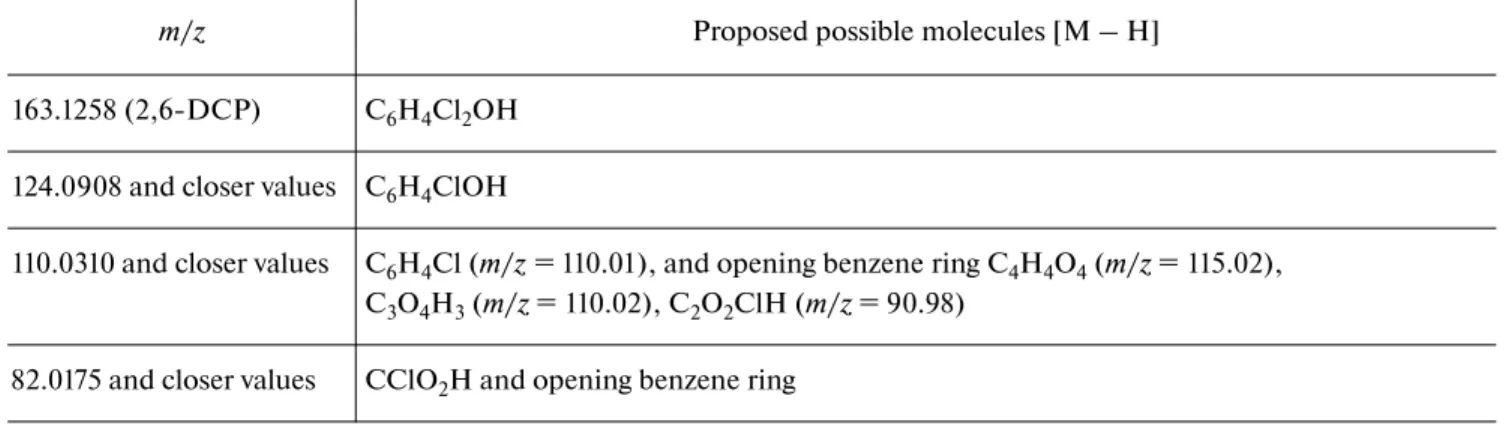
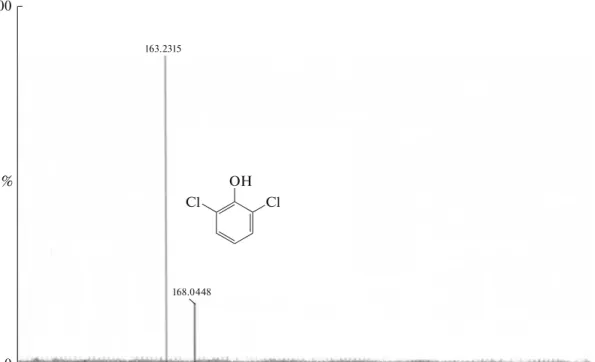
Initial DCP (m/z = 163, Fig. 10a) and 2,6-DCP subjected to photodegradation for 90 min (Fig. 10b) were analyzed by HRMS. The spectrum (b) showed peaks at m/z = 163.2315 and 168.0448 imply-ing that 2,6-DCP was not transformed into hydroqui-none in the presence of MgO/ZnO composites. Fig-ure 10b shows that 2,6-DCP was successfully decom-posed to lower bi-products with m/z of 82.0175, 110.0310 and 124.0908 as summarized in Table 2.
( )( )( )
• • 2 O− h+ OH( )
• 2 O−( )
• OH( )
• 2 O−( )
• 2 O−( )
• 2 O−Fig. 9. Effects of different scavengers on degradation of 2,6-DCP in the presence of Mg5Zn5 composite photo-catalyst. 100 30 20 10 0 Degradation, % No Scavenger 90 80 70 60 50 40 IPA KI AA Oxidative species
Table 2. Proposed degradation byproducts of 2,6-DCP
m/z Proposed possible molecules [M – H]
163.1258 (2,6-DCP) C6H4Cl2OH
124.0908 and closer values C6H4ClOH
110.0310 and closer values C6H4Cl (m/z = 110.01), and opening benzene ring C4H4O4 (m/z = 115.02),
C3O4H3 (m/z = 110.02), C2O2ClH (m/z = 90.98)
CONCLUSIONS
MgO/ZnO composites were synthesized by a co-precipitation method using Mg(NO3) ⋅ 2H2O and
Zn(Ac)2 ⋅ 6H2O. Each sample was calcined at 600°C
for 3 h. MgO content affected the catalytic and optical
properties of ZnO in different ways. SEM images show that all samples were nearly spherical while their mor-phology was unchanged after MgO loading. The Eg
value of pure ZnO (3.44 eV) was lower than that of MgO/ZnO composites because the ZnO structure contained an enhanced concentration of defect sites.
Fig. 10. HRMS results of 2,6-DCP (in the presence of Mg5Zn5 catalyst) (a) and after 90 min contact (b). 100 0 Intensity, % 130 60 55 50 m/z 125 120 115 110 105 100 95 90 85 80 75 70 65 66.0225 80.9521 68.9859 71.0327 82.0175 83.0215 84.0162 85.052290.9802 97.1154 99.0511 100.0285 107.9710 110.0130 115.0289 123.0443 124.0908 127.0015 128.9579 (b) (a) 100 0 Intensity, % % 250 145 140 135 m/z 245 240 235 230 225 220 215 210 205 200 195 190 185 180 175 170 165 160 155 150 163.2315 168.0448 Cl OH Cl O Cl OH Cl OH O HO O O OH O HO OH O Cl OH
Mg5Zn5 composite with a higher concentration of
defects in crystallites was more active in the photocat-alytic degradation (79.5%) than Mg8Zn5 (61.2%) and
Mg2Zn5 (63.5%).
ACKNOWLEDGMENTS
This manuscript is supported by the Mugla Sitki Kocman University coordination of scientific research projects (BAP) 15/139.
REFERENCES
1. Beydoun, D., Amal, R., Low, G., and McEvoy, S., J.
Nanopart. Res., 1999, vol. 1, p. 439.
2. Zhao, X., Li, M., and Lou, X., Adv. Powder Technol., 2014, vol. 25, p. 372.
3. Suwanboon, S., Klubnuan, S., Jantha, N., Amornpit-oksuk, P., and Bangrak, P., Mater. Lett., 2014, vol. 115, p. 275.
4. Vaizogullar, A.I., Theor. Exp. Chem., 2017, vol. 53, p. 31.
5. Klubnuan, S., Amornpitoksuk, P., and Suwanboon S.,
Mater. Sci. Semicond. Process., 2015, vol. 39, p. 515.
6. Zhao, J., Mu, F., Qin L., Jia, X., and Yang, C., Mater.
Chem. Phys., 2015, vol. 166, p. 176.
7. Al-Naser, Q.A.H., Zhou, J., Wang, H., Liu, G., and Wang, L., Opt. Mater., 2015, vol. 46, p. 22.
8. Babu, K.S., Reddy, A.R., and Reddy, K.V., J. Lumin., 2015, vol. 158, p. 306.
9. Suwanboon, S., Amornpitoksuk, P., Bangrak, P., and Muensitd, N., Ceram. Int., 2013, vol. 39, p. 5597. 10. Ohtani, B., J. Photochem. Photobiol., C., 2010, vol. 11,
p. 157.
11. Senger, R. and Bajaj, K., Phys. Rev. B, 2003, vol. 68, p. 1. 12. Kim, H.W., Shim, S.H., and Lee, C., Mater. Sci. Eng. B,
2007, vol. 136, p. 148.
13. Tabib, A., Bouslama, W., Sieber, B., Addad, A., Elhouichet, H., Ferid, M., and Boukherrou, R., App.
Surf. Sci., 2017, vol. 396, p. 1528.
14. Belaissa, Y., Nibou, D., Assadi, A.A., Bellal, C., and Trari, M., J. Taiwan Inst. Chem. Eng., 2016, vol. 68, p. 254.
15. Singh, D.P., Singh, J., Mishra, P.R., Tiwari, R.S., and Srivastava, O.N., Bull. Mater. Sci., 2008, vol. 31, no. 3, p. 319.
16. Suwanboon, P., Amornpitoksuk, S., and Muensit, J.,
J. Ceram. Process. Res., 2010, vol. 11, p. 419.
17. Lyu, S.C., Zhang, Y., Ruh, H., Lee, H.J., Shim, H.W., Suh, E.K., and Lee, C.J., Chem. Phys. Lett., 2002, vol. 363, no. 1, p. 134.
18. Umar, A., Choi, Y.J., Suh, E.K., Al-Hajry, A., and Hahn, Y.B., Curr. Appl. Phys., 2008, vol. 8, no. 6, p. 798.
19. Shirzadi, A. and Ejhieha, A.N., J. Mol. Catal. A.:
Chem., 2016, vol. 411, p. 222.
20. Ye, J., Li, X., Hong, J., Chen, J., and Fan, Q., Mater.