Aysun Avsar
1, A, C, F, Emir Yuzbasioglu
2, A–F, Duygu Sarac
3, D–FThe Effect of Finishing and Polishing Techniques on
the Surface Roughness and the Color of Nanocomposite
Resin Restorative Materials
1 Department of Pedodontics, Ondokuz Mayis University Faculty of Dentistry, Turkey 2 Department of Prosthodontics, Istanbul Medipol University School of Dentistry, Turkey 3 Department of Prosthodontics, Ondokuz Mayıs University, Faculty of Dentistry, Turkey
A – research concept and design; B – collection and/or assembly of data; C – data analysis and interpretation; D – writing the article; E – critical revision of the article; F – final approval of article
Abstract
Background. Rough, poorly polished surfaces contribute to staining, plaque accumulation, gingival irritation and
recurrent caries. Finishing and polishing techniques are critical factors contributing to the longevity of the direct composite resin restorations.
Objectives. The aim of this in vitro study was to evaluate the effects of finishing and polishing systems on surface
roughness of six nanocomposite restorative resins.
Material and Methods. Thirty specimens of each restorative material (n = 180) were placed in a teflon mould
(6 mm in diameter and 3 mm in depth) and cured with a LED curing unit. Six specimens from each of restorative material were randomly assigned to four groups for finishing and polishing (carbide burs, diamond burs, alumin-ium oxide discs, silicon rubber polisher) techniques. Mylar strip formed specimens were served as control group. After finishing and polishing procedures surface roughness was evaluated by a profilometer. The data was analyzed by 2-way analysis of variance and the Tukey HSD test (α = 0.05).
Results. Significant differences were found between the groups in terms roughness (p < 0.001). The control group
and aluminium oxide discs group had the lowest Ra values and were significantly different from other groups (p < 0.001). The roughest surface was obtained with diamond burs followed by silicon rubbers and carbide burs. Overall, the smoothest surfaces were obtained with the use the complete sequence of aluminum oxide discs.
Conclusions. In areas that could not be reached by the aluminum oxide discs, the carbide burs produced
satisfac-tory surface smoothness for the nanocomposite restorative materials. Although mylar matrix strip formed surfaces presents lower surface roughness values, recountouring and polishing of resin restorations are often required in clinical situations. Aluminium oxide discs and carbide finishing burs are suitable for finishing and polishing pro-cedures for nanocomposite restorative resins (Adv Clin Exp Med 2015, 24, 5, 881–890).
Key words: surface roughness, color difference, nanocomposite resins, polishing techniques.
ORIGINAL PAPERS
Adv Clin Exp Med 2015, 24, 5, 881–890
DOI: 10.17219/acem/23971 © Copyright by Wroclaw Medical University ISSN 1899–5276
The clinical use of composite resins has in-creased substantially and they are recommend-ed for restoring all cavity classes over the past few years [45].Various classification systems for resin composites have developed through the years based on particle size. The traditional system includes tra-ditional, small particle, microfilled and hybrid fill-er particles [24]. Nanotechnology is of great intfill-er- inter-est for the development of dental materials. This is particularly true for purpose-designed nano and
microstructures, which can be used to produce low shrinkage dental composites with high wear resis-tance and biocompatibility [2]. Nanotechnology is known as the production and manipulation of mate-rials and structures in the range of about 0.1–100 nm by various physical and chemical methods [4, 40]. Nanofilled resin composites utilize nano-meter-sized particles throughout the resin matrix [40]. Nanohybrids combine nanometer-sized parti-cles with more conventional filler technology. Due
to the reduced dimension of the particles and to a wide size distribution, an increased filler load can be achieved with the consequence of reducing the polymerization shrinkage and increasing the me-chanical properties such as tensile strength, com-pressive strength ad resistance to fracture [4]. Addi-tionally, the small size of the filler particles improve the optical properties of resin composites because their diameter is a fraction of the wavelength of vis-ible light (0.4–0.8 μm), resulting in the human’s eye inability to detect the particles [25].
A smooth surface finish is clinically impor-tant for composite resin restorations, as it deter-mines the esthetics and longevity of the composite resin restorations [11, 36, 45]. Finishing and pol-ishing procedures which refer to gross contouring of the restoration to obtain the desired anatomy, to reduce and smooth the roughness and scratch-es created by finishing instruments, are scratch-essential to periodontal integrity, marginal integrity and wear reduction [18, 34] Also highly polished surfaces minimize the plaque accumulation, gingival irrita-tion, poor esthetics, surface discoloration and sec-ondary caries [36, 42].However, it was stated that it is difficult to achieve a highly polished surface of composite resin restorations due to different hard-nesses of resin matrix and filler particles of com-posite resins [14, 31]. For comcom-posite resins, the smoothest surfaces were produced when the ma-terials were allowed to polymerize against a strip matrix [45, 14, 43]. Despite careful placement of the matrix, removing excess material and re-con-touring restorations is often clinically necessary. This requires some degree of finishing and pol-ishing, which may alter the smoothness obtained with a matrix [14, 43]. The flexibility of the back-ing material in which the abrasive is embedded, the hardness of the abrasive, and the grit size influ-ence surface roughness (Ra) of resin restoration af-ter finishing and polishing procedures [14, 19, 31]. Optical properties of the dental composite resins were influenced by surface changes during restor-ative procedures of finishing and polishing [19, 26]. Color change (ΔE) mathematically expresses the amount of difference between the L*a*b* coor-dinates of different specimens or the same speci-men at different instances [9]. Various studies have reported different thresholds of ΔE values above which the color change is perceptible to the human eye [10, 20, 22, 27, 30, 35, 37]. These values ranged from ΔE equal to 1 [27], between 2 and 3 [35], great-er than or equal to 3.3 [22, 30], and greatgreat-er than or equal to 3.7 [20]. Values of ΔE in the range of 2 to 3 were perceptible, and values from 3 to 8 were moderately perceptible, and values above 8 were markedly perceptible [37]. A ΔE value of 3.7 or less is considered to be clinically acceptable by Johnston
and Kao [20].In general, polished composite resins tend to appear lighter, whiter, and less glossy than the corresponding matrix covered surfaces [15].
The objective of the present study was to eval-uate the effects of four different finishing/polish-ing techniques on the surface roughness and color differences of 3 nanohybrid and 3 nanofilled com-posite resin restorative materials. The research hy-pothesis was that significantly different Ra and ∆E values would be found for different composite res-ins and polishing/finishing techniques.
Material and Methods
The materials used in this study are list-ed in Table 1. Thirty-two disc-shaplist-ed specimens were prepared for each composite resin materi-al (6 × 3 mm), for a totmateri-al of 192 specimens, using a plastic transparent mould with a hole in the cen-ter (6 mm in diamecen-ter and 3 mm in height). The mould was slightly overfilled with composite res-in material, covered on each side with a strip ma-trix and placed between two glass slides. A weight of 2 kg was applied to extrude the excess materi-al. Then the composite resin material was light po-lymerized for 20s with a quartz tungsten halogen polymerizing light (QTH) (Astralis 3; Ivoclar Viva-dent) with an output of 600 mW/cm2. The
speci-mens were polymerized from the two sides. Fol-lowing light curing, specimens were removed from the mold and stored in distilled water at 37°C for 24 h. Specimens of each composite resin were di-vided into 4 groups, each containing 8 specimens.
Before finishing and polishing procedures, the first color measurements of the specimens were made using a small area colorimeter (CR-300; Mi-nolta, Osaka, Japan). Three colorimetric measure-ments were made for each specimen and the mean CIE L*a*b* values were recorded. In order to posi-tion the tip of the colorimeter to the same area of the specimens, a white custom-made mold made of polytetrafluoroethylene was prepared. The col-orimeter was calibrated according to manufactur-er’s instructions, before each measurement period using the white calibration cap (CR-A43, Minolta, Osaka, Japan) supplied by the manufacturer.
After colorimetric evaluation, surface rough-ness of the specimens was measured using a pro-filometer (Mitutoyo Surf Test 402 Analyzer; Mi-tutoyo Corp, Japan). To measure the roughness profile value, the diamond stylus (5-μm tip radi-us) was moved across the surface under a constant load of 3.9 mN. The instrument was calibrated us-ing a standard reference specimen, then set to trav-el at a speed of 0.1 mm/s with a range of 600 μm during testing. This procedure was repeated
3 times for all specimens and the average value was considered to be the first Ra value.
Subsequently, the surfaces of the specimens were grounded with a 1000 grit silicon carbide pa-per (Carbimet; Buehler, Lake Bluff, Ill) in the ex-perimental groups (Table 2). In Group C the spec-imens were polished firstly with 12-fluted then with 30-fluted carbide burs; Group D specimens were polished with fine and extrafine diamond burs; Group A specimens were polished sequen-tially with medium grit (40 μm), fine grit (24 μm), and extra-fine grit (8 μm) aluminum oxide abra-sive discs; and in Group S the specimens were pol-ished firstly with pre-polisher (yellow), then with high gloss polisher (white). To reduce variabili-ty, specimen preparation, finishing and polishing
procedures were carried out by the same operator. After each finishing and polishing step, specimens were flushed with water and air dried before start-ing the next step. At the completion of the finish-ing and polishfinish-ing procedure, specimens were ultra-sonically cleaned (Eurosonic energy; Euronda SpA, Vicenza, Italy) with distilled water and dried with a blast of air for 30 s before the measurements. Di-amond and carbide burs were used with a slow-speed handpiece (NBBW-E; Nsk Nakanishi Inc., Tochigi, Japan) under water cooling for 15 s. The aluminum oxide discs and silicone-based polish-er points wpolish-ere used with a slow-speed hand piece (NBBW-E; Nsk Nakanishi Inc., Tochigi, Japan) ro-tating at approx. 20,000 rpm with water cooling for 30 s. Each bur was applied using light pressure in multiple directions. The aluminum oxide discs and silicon-based polishers were changed after the polishing of each sample, while the diamond and carbide burs and carbide burs were changed every three samples. Subsequently, the specimens were stored in distilled water at 37°C for 24 h.
After finishing and polishing procedures the second color measurements of the specimens were made. The quantitative ΔE values between the first and second measurements of the specimens were calculated with the following formula [15, 22]:
ΔE = [(L*S – L*F)2 + (a* S – a* F)2 +
+ (b* S – b* F)2]½
where (L*F – L*S), (a* F – a* S), and (b* S – b* F) are
the differences in ΔL*, Δa*,Δb* values, respective-ly. F represents the first measurement and S repre-sents the second measurement. The ΔE values were
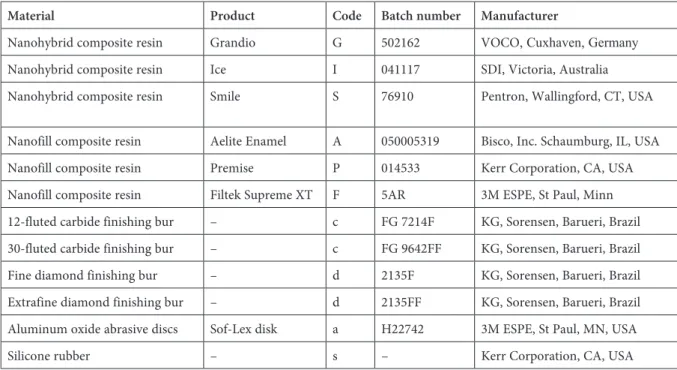
Table 1. Materials used in this study
Material Product Code Batch number Manufacturer
Nanohybrid composite resin Grandio G 502162 VOCO, Cuxhaven, Germany Nanohybrid composite resin Ice I 041117 SDI, Victoria, Australia Nanohybrid composite resin Smile S 76910 Pentron, Wallingford, CT, USA Nanofill composite resin Aelite Enamel A 050005319 Bisco, Inc. Schaumburg, IL, USA Nanofill composite resin Premise P 014533 Kerr Corporation, CA, USA Nanofill composite resin Filtek Supreme XT F 5AR 3M ESPE, St Paul, Minn 12-fluted carbide finishing bur – c FG 7214F KG, Sorensen, Barueri, Brazil 30-fluted carbide finishing bur – c FG 9642FF KG, Sorensen, Barueri, Brazil Fine diamond finishing bur – d 2135F KG, Sorensen, Barueri, Brazil Extrafine diamond finishing bur – d 2135FF KG, Sorensen, Barueri, Brazil Aluminum oxide abrasive discs Sof-Lex disk a H22742 3M ESPE, St Paul, MN, USA Silicone rubber – s – Kerr Corporation, CA, USA
Table 2. Finishing and polishing procedures used in this
study
Group Finishing and polishing procedure
ct (control) untreated
c first 12-fluted then 30-fluted carbide burs were used
d first fine then extrafine diamond burs were used
a medium grit (40 μm), fine grit (24 μm), extra-fine grit (8 μm) aluminum oxide abrasive discs were used, respectively s first pre-polisher (yellow), then high gloss
analyzed statistically by 2-way analysis of variance (ANOVA) with the Tukey multiple comparison tests (α = 0.05).
After colorimetric evaluation, the second Ra values were obtained with the same procedures as previously stated. The Ra mean difference (∆Ra) for each specimen was obtained by subtract-ing the mean first readsubtract-ings from the mean sec-ond readings. Therefore, a positive mean differ-ence in ∆Ra obtained would represent an increase in smoothness and the larger the value, the greater the smoothness. The data was analyzed by 2-way ANOVA followed by a Tukey multiple comparison test (α = 0.05).
To evaluate the effect of polishing and finish-ing techniques on the composite resin surfaces at a microscopic level, an additional 5 specimens were prepared using Aelite Enamel composite res-in sres-ince this composite resres-in showed the high-er diffhigh-erent values among the subgroups in thigh-erms of the polishing and finishing techniques. One of the specimens served as control and had no treat-ment. The surfaces of the 4 specimens were rough-ened with a medium-grit diamond rotary cutting instrument and polished with 1 of the 4 polish-ing and finishpolish-ing techniques as previously de-scribed. Subsequently, these specimens were gold sputtered with a sputter coater (S150B; Edwards, Crawley, England) and examined under a field emission scanning electron microscope (SEM) (JSM-6335F; JEOL, Tokyo, Japan) at 15.0 kV. The
SEM photomicrographs were made with ×500 magnification for visual inspection.
Results
The result of the 2-way ANOVA used to test the surface roughness of the composite resins showed that the type of composite resin, polish-ing techniques, and their interactions were statis-tically significant (p < 0.001) (Table 3). The mean values and standard deviations for surface rough-ness of composites finished and polished by differ-ent methods are summarized in Table 4.
When the Ra values of the groups compared according to the composite resin, it was seen that significant differences were found between the composite resins (p < 0.001). The significance was found between the nanohybrid and the nanofilled composite resins.
When the finishing and polishing techniques were compared, there were no significant differ-ences between the Groups Ct, C, A (p > 0.05). The highest Ra values were obtained with the use of diamond burs (p < 0.001). The control groups for each composite resin showed lower Ra values than the experimental groups and there were no significant differences between the control groups (p > 0.05).
The color change results showed that while the polishing techniques affected the color change
Table 3. Two-way ANOVA results for comparison of surface roughness
Source of variation Sum of squares df Mean square F ratio Sig.
Composite resin 1.361 5 0.272 16.582 0.0002 Polishing technique 17.579 3 5.860 357.091 0.0001 Composite resin × polishing technique 0.206 15 0.014 0.837 0.636
Error 2.757 168 0.016
Total 73.716 192
Table 4. The mean surface roughness values and standard deviations of the groups
c d a s G 0.400 ± 0.07 a 1.120 ± 0.25 b 0.375 ± 0.15 a 0.406± 0.11 a I 0.481 ± 0.14 a 1.045 ± 0.06 b 0.344 ± 0.16 a 0.504 ± 0.16 a S 0.465 ± 0.10 a 1.153 ± 0.15 b 0.320 ± 0.06 a 0.598 ± 0.06 a A 0.279 ± 0.06 a 0.960 ± 0.18 b 0.156 ± 0.06 a 0.314 ± 0.09 a P 0.319 ± 0.15 a 1.009 ± 0.18 b 0.188 ± 0.08 a 0.341 ± 0.09 a F 0.284 ± 0.14 a 0.923 ± 0.13 b 0.181 ± 0.04 a 0.305 ± 0.10 a Groups with same letter are not significantly different (p > 0.05).
(p < 0.001), the type of the composite resin did not effect on the color change of the specimens (p > 0.05). The results of the statistical analysis are presented in Table 5 and the mean ∆E values are presented in Table 6. Diamond burs showed the highest ∆E values.
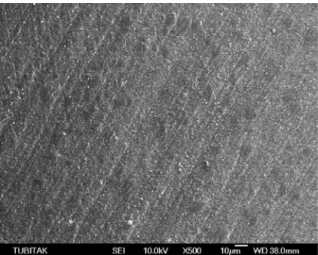
When the SEM photomicrographs were ex-amined, it was seen that the smoothest surface was obtained with control specimen that had no surface treatment (Fig. 1a, 1b). The experimental specimens showed rougher surfaces when com-pared with the control (Fig. 2–5). Diamond burs created the roughest surface among the finishing and polishing techniques (Fig. 3a, 3b).
Discussion
The hypothesis of this study was that the dif-ferent polishing and finishing techniques and the type of the nanocomposite resin affect the surface roughness. The results of this study support the research hypothesis. Significant differences were found in Ra values among the groups (p < 0.001). Surface roughness of the restorations is an impor-tant factor for bacterial adhesion. It was reported that a further reduction in Ra below a threshold level of 0.2 μm had no effect on supra and sub-gingival microbiological adhesion or coloniza-tion [23].The composite materials tested in the
Table 6. The mean ∆E values and standard deviations of the groups
c d a s G 1.855 ± 0.07 a 2.313 ± 0.23 b 1.641 ± 0.05 a 1.711 ± 0.21 a I 1.765 ± 0.08 a 2.329 ± 0.18 b 1.676 ± 0.07 a 1.754 ± 0.21 a S 1.836 ± 0.06 a 2.470 ± 0.08 b 1.616 ± 0.09 a 1.684 ± 0.11 a A 1.758 ± 0.06 a 2.408 ± 0.18 b 1.605 ± 0.06 a 1.744 ± 0.20 a P 1.733 ± 0.07 a 2.279 ± 0.13 b 1.678 ± 0.09 a 1.829 ± 0.20 a F 1.784 ± 0.09 a 2.276 ± 0.13 b 1.628 ± 0.83 a 1.741 ± 0.18 a Groups with same letter are not significantly different (p > 0.05).
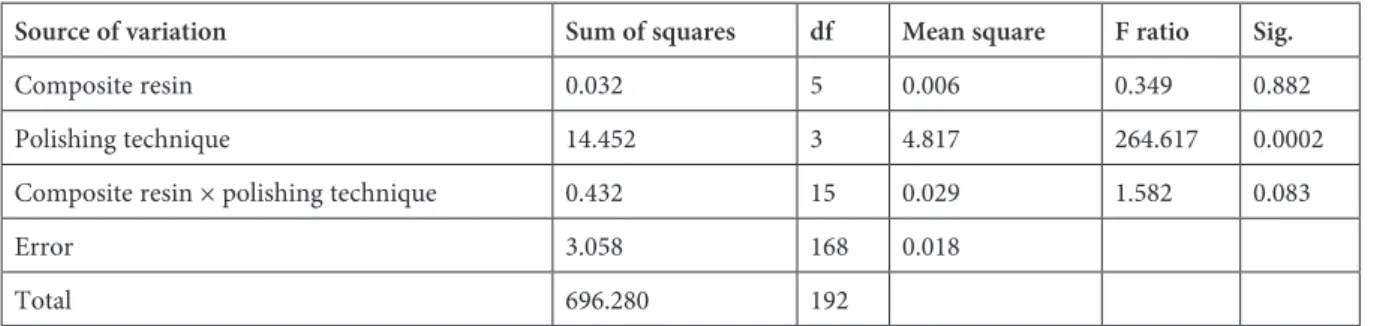
Table 5. Two-way ANOVA results for comparison of color difference
Source of variation Sum of squares df Mean square F ratio Sig.
Composite resin 0.032 5 0.006 0.349 0.882 Polishing technique 14.452 3 4.817 264.617 0.0002 Composite resin × polishing technique 0.432 15 0.029 1.582 0.083
Error 3.058 168 0.018
Total 696.280 192
Fig. 1a. SEM micrographs of control specimen
present study produced Ra values below or near to 0.2 μm before and after finishing and polishing techniques, except the use of diamond burs.
Previous studies have shown that the smooth-est obtainable surface of composite resin rsmooth-estora- restora-tions is achieved by polymerizing the material in direct contact with a smooth polyester matrix sur-face [1, 29, 32, 45].In the present study, the Ra val-ues of the control specimens for all composite res-ins which were polymerized in direct contact with polyester matrix surface were found to be lower than the other groups polished with different pol-ishing techniques. Although the control groups for each restorative material has the lowest Ra values, the surfaces produced were not perfect (Ra val-ue = 0). This was because the surfaces produced were only as good as the matrix strip itself any sur-face imperfections present in the matrix will be reproduced in the surface of the specimens [5].
In this present study, as well as in others [17, 28, 44],
mylar matrix strip formed the smoothest surface.
Nevertheless, resin-rich surface layer needs to be eliminated; thus, finishing is indispensable [16].
For recountouring restorations or removing excess material some abrasive instruments such as flexible discs, finishing burs and etc. are used. Ryba et al. [34] noted that aluminum oxide discs provided a smoother surface than rubber polish-ers. Numerous studies indicate that flexible alumi-num oxide discs produce smoother surfaces than diamond finishing burs, tungsten carbide burs, mounted stones and rubber points when used with polishing pastes [16, 44].
In the present study, aluminum oxide discs cre-ated smoother surfaces than the other finishing and polishing techniques. In a similar study it was re-ported that after polyester matrix group, the lowest Ra values were obtained with the aluminum oxide abrasive disc group and the highest Ra values were obtained with the use of polishing wheels [32].
To be an effective composite finishing system, the cutting particles (abrasive) must be relatively
Fig. 2a. SEM micrographs of the specimen treated with
carbide burs. Original magnification ×100 Fig. 2b. SEM micrographs of the specimen treated with carbide burs. Original magnification ×500
Fig. 3a. SEM micrographs of the specimen treated with
harder than the filler materials [3].Otherwise, the polishing agent will only remove the soft resin ma-trix and leave the filler particle protruding from the surface [7]. According to Weinstein, by systemat-ically decreasing the particle size of the abrasive, a superior surface can be achieved. The grit in the polishing material should be smaller than the parti-cle size of the restorative material that is being pol-ished in order to produce better results [41].
An earlier study showed that aluminum ox-ide disc’s capability of producing smooth surfac-es was related to their ability to cut the filler par-ticle and matrix equally [39]. According to Tate and Powers, the aluminum-oxide discs appear to finish the materials without dislodging the glass particles [38]. The aluminum oxide discs have been shown to produce better surface smooth-ness because they do not displace the composite fillers [6, 26].
In the present study, diamond and carbide burs showed higher Ra values than the other
groups. These instruments are necessary for con-touring anatomically structured and concave sur-faces such as the lingual surface of anterior teeth or the occlusal surfaces of posterior teeth [6, 26]. Jung suggested that finishing diamonds were best suited for gross removal and contouring because of their high cutting efficiency of composite surface, while carbide finishing burs would be best suited for smoothing and finishing as a result of their low cutting efficiency. With hybrid composites, finish-ing diamonds have been shown to produce rough surfaces compared with those produced by carbide burs [21]. Another study also found that finishing diamonds were more efficient in removing materi-al from the composite surface, materi-although they tend-ed to leave a more irregular surface when compartend-ed with a finishing carbide bur [13]. Moreover, stud-ies have reported that using finishing burs alone provided a rough composite surface [8] and the lit-erature [12] shows that diamond burs are respon-sible for the highest surface roughness. Although
Fig. 4a. SEM micrographs of the specimen treated with
aluminum oxide abrasive discs. Original magnifica-tion ×100
Fig. 4b. SEM micrographs of the specimen treated with
aluminum oxide abrasive discs. Original magnifica-tion ×500
Fig. 5a. SEM micrographs of the specimen treated with
diamond burs allow the elimination of materi-al excesses especimateri-ally in regions with difficult ac-cess, they produce a relatively rough surface [12]. According to the authors, if diamond burs are used, the material surface roughness should be reduced or eliminated. In the present study, the diamond bur groups showed the highest surface roughness and this situation was confirmed by SEM photo-micrographs (Fig. 1–5).
The use of tungsten carbide finishing burs cre-ated smoother surfaces and showed the lower Ra values than diamond burs in the study. This re-sult showed that they are not effective to produce smooth surface for resin restorations. Tungsten carbide finishing burs are only recommended for trimming restorations that require only little or no excess removal and contouring, because they are ineffective when a high cutting efficiency is required [21].
Polishability of a resin composite is affected by the filler particle size. Generally, the smaller the av-erage particle size, the easier it will be to polish the resin. The filler content of the composite also af-fects its roughness, as microfilled composites show smoother surfaces than hybrid composites [33]. In the present study, the composite resins showed significantly different surface roughness, especially nanofilled composite resins showed smoother sur-faces than nanohybrid composite resins. As it was stated before nanofilled composite resins contain fillers with size ranging from around 5–100 nm, and the particle size are similar [4, 40]. However, nanohybrid composite resins contain fillers with different particle size, but the majority of the fillers are nanoparticles. For this reason nanofilled com-posite resin groups showed smoother surfaces than nanohybrid composite resin groups.
When the results were investigated in terms of color difference, it was seen that no statistically
differences were between the composite resin ma-terials. The use of a diamond bur showed statisti-cally higher ∆E values (p < 0.001) and no differenc-es were found between the other groups. This effect is thought to be related to the surface morphology. Optical properties of dental composite resins are di-rectly affected by surface roughness [15].As it was stated previously diamond bur groups also showed higher Ra values. An increasingly roughened sur-face will reflect the individual segment of the spec-ular beam at slightly different angles [15].If the
sur-face configuration has a matte finish, there would be an excessive amount of light reflected at a surface level and a reduction of light transmission through the material. Surface texture controls the degree of scattering or reflection of the light striking on the natural tooth or the material [15].The color
differ-ences among 4 composite resin materials and 4 pol-ishing methods tested were found between 1.6 and 2.47 in this study. Although polishing methods re-veal statistically significant color differences, these differences are within a clinically acceptable level, as they are below 3.7 ∆E value.
In this study a limited number of nano-com-posite resins and polishing techniques were used and these are the limitations of this in vitro study.
Within the limitations of this study the follow-ing conclusions were drawn;
1. The smoothest surfaces were obtained with control groups which were polymerized in direct contact with polyester matrix.
2. Diamond burs showed the highest surface roughness with all composite resin materials.
3. Nanofilled composite resin materials showed smoother surface than nanohybrid com-posite resin materials.
4. While the color difference was not affected by the type of the composite resin, surface treat-ments increased the color differences.
References
[1] Baseren M: Surface roughness of nanofill and nanohybrid composite resin and ormocer-based tooth-colored
restorative materials after several finishing and polishing procedures. J Biomater Appl 2004, 19, 121–134.
[2] Bayne SC, Heymann HO, Swift EJ: Update on dental composite restorations. J Am Dental Assoc 1994, 125,
687–701.
[3] Berastegui E, Canalda C, Brau E, Miquel C: Surface roughness of finished composite resins. J Prosthet Dent 1992,
68, 742–749.
[4] Beun S, Glorieux T, Devaux J, Vreven J, Leloup G: Characterization of nanofilled compared to universal and
microfilled composite. Dent Mater 2005, 23, 51–59.
[5] Borges AB, Marsillo AL, Pagani C, Rodrigues JR: Surface roughness of packable composite resins polished with
various systems. J Esthet Restor Dent 2004, 16, 42–47.
[6] Bouvier D, Duprez JP, Lissac M: Comparative evaluation of polishing systems on the surface of three aesthetic
materials. J Oral Rehabil 1997, 24, 888–894.
[7] Chandler HH, Bowen RL, Poffenbarger GC: Method for finishing composite restorative materials. J Am Dental
Assoc 1971, 83, 344–347.
[8] Chen RC, Chan DC, Chan KC: A quantitative study of finishing and polishing techniques for a composite.
[9] Chung KH: Effects of finishing and polishing procedures on the surface texture of resin composites. Dent Mater
1994, 10, 325–330.
[10] Douglas RD, Brewer JD: Variability of porcelain color reproduction by commercial laboratories. J Prosthet Dent
2003, 90, 339–346.
[11] Dunkin RT, Chambers DW: Gingival response to class V composite resin restorations. J Am Dent Assoc 1983,
106, 482–484.
[12] Eide R, Tveit AB: Finishing and polishing glass–ionomer cements. Acta Odont Scand 1990, 48, 409–413. [13] Ferracane JL, Condon JR, Mitchem JC: Evaluation of subsurface defects created during the finishing of
compos-ites. J Dent Res 1992, 71, 1628–1632.
[14] Filho AN, D’Azevedo MTFS, Nagem HD, Marsola FP: Surface roughness of composite resin after finishing and
polishing. Braz Dent J 2003, 14, 37–41.
[15] Gross MD, Moser JB: A colorimetric study of coffee and tea staining of four composite resins. J Oral Rehabil 1977,
4, 311–322.
[16] Hoelscher DC, Neme AM, Pink FE, Hughes PJ: The effect of three finishing systems on four esthetic restorative
materials. Oper Dent 1998, 23, 36–42.
[17] Hondrum SO, Fernandez R Jr: Contouring, finishing, and polishing Class 5 restorative materials. Oper Dent
1997, 22, 30–36.
[18] Jefferies SR: The art and science of abrasive finishing and polishing in restorative dentistry. Dent Clin North Am
1998, 42, 613–627.
[19] Jefferies SR, Barkmeier WW, Gwinnett AJ: Three composite finishing systems: a multisite in vitro evaluation.
J Esthet Dent 1992, 4, 181–185.
[20] Johnston WM, Kao EC: Assessments of appearance match by visual observation and clinical colorimetry. J Dent
Res 1989, 68, 819–822.
[21] Jung M: Surface roughness and cutting efficiency of composite finishing instruments. Oper Dent 1977, 22, 98–104. [22] Kim HS, Um CM: Color differences between resin composites and shade guides. Quintessence Int 1996, 27, 559–567. [23] Lee YK, Lim BS, Kim CW: Effect of surface conditions on the color of dental resin composites. J Biomed Mater
Res 2002, 63, 657–666.
[24] Lutz F, Phillips RW: A classification and evaluation of composite resin systems. J Prosthet Dent 1983, 50, 480–488. [25] Mitra SB, Wu D, Holmes BN: An application of nanotechnology in advanced dental materials. J Am Dent Assoc
2003, 134, 1382–1390.
[26] Obregon A, Goodkind RJ, Schwabacher WB: Effects of opaque and porcelain surface texture on the color of
ceramometal restorations. J Prosthet Dent 1981, 46, 330–340.
[27] O’Brien WJ, Boenke KM, Groh CL: Coverage errors of two shade guides. Int J Prosthodont 1991, 4, 45–50. [28] Ozgünaltay G, Yazici AR, Görücü J: Effect of finishing and polishing procedures on the surface roughness of new
tooth-coloured restoratives. J Oral Rehabil 2003, 30, 218–224.
[29] Quirynen M, Bollen CM, Papaioannou W, Van Eldere J, van Steenberghe D: The influence of titanium
abut-ment surface roughness on plaque accumulation and gingivitis: short term observations. Int J Oral Maxillofac Implants 1996, 11, 169–178.
[30] Ragain JC, Johnston MW: Color acceptance of direct dental restorative materials by human observers. Color Res
Appl 2000, 25, 278–285.
[31] Reis AF, Giannini M, Lovadino JR, Dias CTDS: The effect of six polishing systems on the surface roughness of
two packable resin-based composites. Am J Dent 2002, 15, 193–197.
[32] Roeder LB, Powers JM: Surface roughness of resin composite prepared by single-use and multi-use diamonds. Am
J Dent 2004, 17, 109–112.
[33] Roeder LB, Tate WH, Powers JM: Effect of finishing and polishing procedures on the surface roughness of
pack-able composites. Oper Dent 2000, 25, 534–543.
[34] Ryba TM, Dun NWJ, Murchison DF: Surface roughness of various packable composites. Oper Dent 2002, 27,
243–247.
[35] Seghi RR, Hewlett ER, Kim J: Visual and instrumental colorimetric assessments of small color differences on
translucent dental porcelain. J Dent Res 1989, 68, 1760–1764.
[36] Shintani H, Satou N,Yukihiro A,Satou J,Yamane I,Kouzati T,Andou T, Kai M, Hayashihira H, Inoue T: Water
sorption, solubility and staining properties of microfilled resins polished by various methods. Dent Mater J 1985, 4, 54–62.
[37] Stober T, Gilde H, Lenz P: Color stability of highly filled composite resin materials for facings. Dent Mater 2001,
17, 87–94.
[38] Tate WH, Powers JM: Surface roughness of composites and hybrid ionomers. Oper Dent 1996, 21, 53–58. [39] Van Dijken JW, Ruyter IE: Surface characteristics of posterior composites after polishing and toothbrushing. Acta
Odont Scand 1984, 45, 337–346.
[40] Venhoven BAM, de Gee AJ, Werner A, Davidson CL: Influence of filler parameters on the mechanical coherence
of dental restorative resin composites. Biomaterials 1996, 17, 735–740.
[41] Weinstein AR: Anterior composite resins and veneers: treatment planning, preparation, and finishing. J Am Dent
Assoc 1988, 117, 38–45.
[42] Weitman RT, Eames WB: Plaque accumulation on composite surfaces after various finishing procedures. J Am
Dent Assoc 1975, 91, 101–106.
[44] Yap AUJ, Lye KW, Sau CW: Surface characteristics of tooth-colored restoratives polished utilizing different
pol-ishing systems. Oper Dent 1997, 22, 260–265.
[45] Yap AUJ, Yap SH, Teo CK, Ng JJ: Finishing/Polishing of Composite and Compomer Restoratives: Effectiveness
of One-step Systems. Oper Dent 2004, 29, 275–279.
Address for correspondence:
Emir Yuzbasioglu
Department of Prosthodontics
Istanbul Medipol University School of Dentistry Ataturk Bulvari No. 27
Unkapani-Fatih 34083 Istanbul Turkey
E-mail: [email protected] Conflict of interest: None declared Received: 5.03.2014
Revised: 1.05.2014 Accepted: 7.07.2014