Correspondence (İletişim adresi): Dr. Demet Karadağ. Ufuk Üniversitesi Tıp Fakültesi, Radyoloji Anabilim Dalı, 06520 Ankara. Tel: 0312 - 204 40 00 Fax (Faks): 0312 - 287 23 90 e-mail (e-posta): [email protected]
© Trakya Üniversitesi Tıp Fakültesi Dergisi. Ekin Tıbbi Yayıncılık tarafından basılmıştır. Her hakkı saklıdır. © Medical Journal of Trakya University. Published by Ekin Medical Publishing. All rights reserved.
The Value of Computed Tomography in
Evaluation of Internal Nasal Valve Angle
Internal Nasal Valv Açısının Değerlendirilmesinde Bilgisayarlı Tomografinin Yeri
Kaan Güçlü BERİAT, Demet KARADAĞ,
1Sinan KOCATÜRK
Departments of Otorhinolaryngology and 1Radiology, Medical Faculty of Ufuk University, Ankara
Submitted / Başvuru tarihi: 25.01.2009 Accepted / Kabul tarihi: 31.03.2009
Objectives: This study was performed in order to
determine the value of tomographic evaluation in mea-surement of the internal nasal valve angle.
Patients and Methods: Thirty-one patients were
examined by nasal endoscopy and computerized tomography. In each case, nasal valve angle were measured using nasal endoscopy and computed tomography (CT) images. Computed tomography measurements obtained from classic coronal and nasal base view (NBV) sections to determine the nasal valve angle were compared with the measure-ments obtained from nasal endoscopic examination images.
Results: When the endoscopic versus the coronal
tomographic measurements and the coronal tomo-graphic versus NBV images measurements were com-pared, statistically significant differences were found. No statistically significant difference was observed between the endoscopic and NBV images measure-ments.
Conclusion: The results of the study indicate that
tomographic images obtained through NBV technique provide accurate measurements of nasal valve angle. Thus, this technique may be choice of preference in the evaluation of nasal and paranasal areas in select-ed patients. However, traditional coronal tomographic imaging is not a proper method for determination of the nasal valve angle alone because of it’s cost and side effects.
Key words: Nasal valve angle; computed tomography; nasal
endoscopy.
Amaç: Bu çalışmada internal nasal valve açısının
ölçü-münde tomografik değerlendirmenin yeri araştırılmıştır.
Hastalar ve Yöntemler: Otuz bir hasta nasal
endos-kopi ve bilgisayarlı tomografi (BT) ile değerlendirildi. Her olguda nasal valv açısı, nasal endoskopi ve BT görüntüleri kullanılarak ölçüldü. Nasal valve açısının değerlendirilmesi amacı ile klasik koronal ve nasal tabana paralel kesitler üzerinden yapılan ölçümler ile nasal endoskopik muayene görüntüleri üzerinden yapılan ölçüm sonuçları birbirleri ile karşılaştırılmış-tır.
Bulgular: Endoskopik ve klasik koronal BT
kesit-lerinden yapılan açı ölçümleri ve her iki tomografik değerlendirme yöntemi ile elde edilen ölçüm sonuçları karşılaştırıldığında istatistiksel olarak anlamlı farklılık bulunmuştur. Nasal tabana paralel kesit görüntüleri üzerinden yapılan ölçüm sonuçları ve endoskopik yön-tem ile yapılan ölçümler istatistiksel olarak benzerlik göstermektedir.
Sonuç: Elde ettiğimiz sonuçlar nasal tabana paralel
elde olunan tomografik görüntülerin nasal valv açısını doğru değerlendirmeye olanak sağladığını göstermek-tedir. Bu sonuç, farklı amaçlarla nasal ve paranasal bölgenin değerlendirmesinin yapılacağı hastalarda bu tomografik tekniğin tercih edilme sebebi olabilir. Tomografik görüntülemenin maliyeti ve yan etkileri düşünüldüğünde ise BT’nin sadece nasal valve açısı-nın değerlendirilmesi amacı ile kullanılmasıaçısı-nın uygun bir yöntem olmadığı açıktır.
Anahtar sözcükler: Nasal valv açısı; bilgisayarlı tomografi; nasal
The internal nasal valve, the narrowest part of the nose, consists of the caudal border of the upper lateral carti-lage, the nasal septum, and the soft tissue surrounding the piriform aperture. It has also been termed as the limen vestibule, the liminal valve, the os internum, the ostium internum, the limen nasi, the limen vestibule, the luminal chink, the nasal valve, the valve area, the valve region, and the flow-limiting segment.[1,2]
The internal nasal valve angle is defined as the angle between superior cartilaginous septum and upper lat-eral cartilage. While normal internal nasal valve angle ranges from 10° to 15° in Caucasian people (leptorrhine nose), it is more than this in Asian and African people (plathyrine nose).
In the literature, computed tomography (CT) has been proposed for the evaluation of the nasal valve area.
[3-5] There are some advantages of CT scan; the
cross-sec-tional area of the airway at any position along its length can be determined and details of hard- and soft-tissue anatomy can be detected with CT imaging. Poetker et al.[5] showed that NBV CT images may be a valuable
new tool that can be used to evaluate the nasal valve objectively and to provide the clinician with valuable anatomical information.
However, optimal assessment of the internal nasal valve angle is not possible on the traditional coronal planes because depending on the scan planes, the angle may be underestimated. Moreover, the traditional coro-nal planes and anterior rhinoscopy findings are weakly correlated. On the other hand, Cakmak et al.[6] showed
a higher correlation between the findings of acoustic rhinometry and coronal CT images perpendicular to the acoustic axis, which is the pathway of nasal airflow.
All previous studies have evaluated nasal valve angle with CT and acoustic rhinometry.[6-8] In this study, the nasal
valve angle was evaluated through two tomographic meth-ods, using a scan plane perpendicular to the acoustic axis
and the traditional coronal scene plane, and the measure-ments of the nasal valve angles via nasal endoscopic exami-nation were presented. Poetker et al.[5] claimed that nasal
endoscopy is subject to examiner variability and therefore lack objectivity. We aimed to evaluate and compare with each method used widely in otolaryngology practice.
PATIENTS AND METHODS
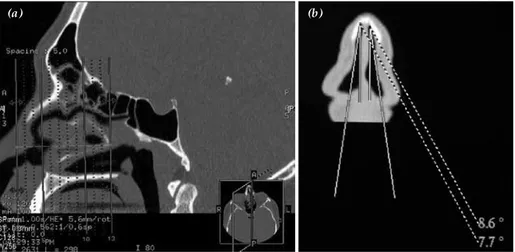
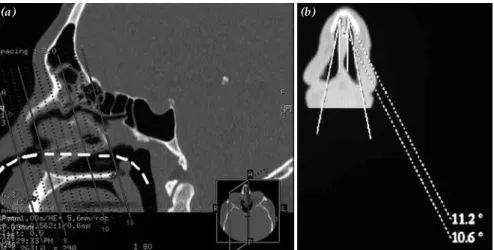
The patients were selected randomly. Patients with significant prior facial trauma were excluded from the study. Thirty-one patients were examined on a 16-channel multislice CT (Lightspeed 16 GE Healthcare, Milwaukee, Wisconsin, USA). All the patients under-went a routine paranasal CT evaluation with a slice thickness of 0.6 mm in bone algorithm. Axial slices were obtained from the top of the frontal sinuses to the bottom of maxillary incisors. The acquired axial data were sent to a commercially available workstation (GE Medical Systems) where the axial sections were refor-matted in the standard coronal plane and in NBV at 1.0 mm intervals with a slice thickness of 0.5 mm. The plane of the standard coronal reformatted images was perpen-dicular to the hard palate, and the reformatted images of the NBV were obtained perpendicular to the estimated acoustic axis (Figs. 1, 2). The reformatted coronal images were obtained perpendicular to anterior aspect of nasal valve angle. Measurements were done in accordance with the above-described method.
Nasal endoscopic examination was performed on all of the patients with same endoscopic devices. A 0° rigid endoscope of 4 mm (Storz Endoscopic Systems) was used for the endoscopic examinations. Nasal endo-scopic examination films were recorded on DVDs with a video recorder device. Video films and all scenes were scanned and the nasal valve angles were identified in endoscopic film scenes (Fig. 3). Nasal valve angle images were arranged to measure the nasal valve angle, and the angles were calculated with Adobe Photoshop.
Fig. 1. (a) Sagittal CT scan showing re-formation plane of traditional coronal images. (b) The nasal valve angle is measured on reformatted image of traditional coronal image.
The internal nasal valve angles of both nasal cavities were assessed by traditional coronal paranasal image, reformation plane of nasal base view image and nasal endoscopic examination image. The results for both cavities were compared. SPSS package program for windows was used for statistical analyses. Anderson-Darling test was performed for checking the normal distribution congruity of the available data. The statis-tical analyses of the right nasal valve angle measure-ments were performed using the parametric one-way ANOVA for repeated measurements test, while the left nasal valve angle measurements were analysed by the non-parametric Friedman two-way analysis of variance test. For right nasal cavity Paired sample t test with Bonferroni adjustment and for left nasal cavity Wilcoxon T-test with Bonferroni adjustment were performed.
Bland-Altman plot was used to represent the aggre-ment of each of the method (MedCalc-Version 10.3.0.0). Cronbach’s Alfa reliability was used to analyze the reli-ability of the measurement. To exclude any systematic bias of the data, the level of agreement between each measurement was examined by calculating the Bland-Altman limits of agreement.
RESULTS
The study was conducted with 31 patients. Mean nasal valve angles of right/left nasal cavities with the endoscopic, the coronal tomographic, and the perpen-dicular tomographic measurements were 10.37/9.75, 8.63/7.73, and 10.66/9.10 respectively. Anderson-Darling test was performed to check the normal dis-tribution congruity of the available data. According to the results of analysis, data set for the right nasal valve angles was shown to fit the normal distribution curve, while the data set for the left nasal valve angles did not. Because of this finding, the statistical analy-ses of the right nasal valve angle measurements were performed using the parametric one-way ANOVA for repeated measurements test, while the left nasal valve angle measurements were analysed by the non-parametric Friedman two-way analysis of variance test. When the data set for the right nasal valve angles was analysed, a statistically important difference was documented among the various measurement tech-niques employed (p=0.000<0.05). So it was concluded that, at least one of the employed measurement tech-niques differed from the others. In order to find the origin of this statistical difference, Paired sample t test with Bonferroni adjustment was employed and while the endoscopic versus the coronal tomographic measurements, and the coronal tomographic versus the perpendicular tomographic measurements were found to display statistically significant differences (p=0.000<0.05 and p=0.000<0.05, respectively). No sta-tistically significant difference was observed between
Fig. 3. Endoscopic image of the nasal valve and its angle measure-ment.
Fig. 2. (a) Sagittal CT scan shows re-formation plane of perpendicular to estimated nasal airflow axis. (b) The nasal valve angle is shown on nasal base view.
endoscopic and perpendicular tomographic measure-ments (p=1.000>0.05). Friedman two-way analysis of variance test was used to analyse the potential differ-ences among the various techniques employed to mea-sure the left nasal valve angles, and a significant differ-ence among the three different techniques was docu-mented (p=0.003<0.05). This finding concluded that, at least one of the measurement techniques displayed a statistically important difference from the others. A non-parametric test, namely, the Wilcoxon T-test with Bonferroni adjustment for paired samples was employed to document the origins of this difference. The results of the Wilcoxon T-test showed that, for the measurement of the left nasal valve angles, there were significant differences between the endoscopic versus the coronal tomographic, and the coronal tomographic versus the perpendicular tomographic measurements (p=0.001<0.05 and p=0.002<0.05, respectively), while no statistically significant difference was observed between the endoscopic and the perpendicular tomo-graphic measurements (p=1.000>0.05).
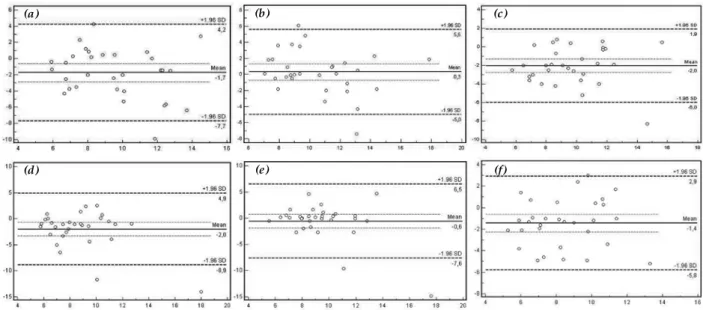
The reliabilities of the measurements were sufficient. Cronbach’s Alfa reliability coefficient was found to be 0.79 and 0.63 for right and left nasal valve angle mea-surements. Bland-Altman plots with 95% limits of agree-ment in nasal valve angle measureagree-ments are shown for each measurement method (Fig. 4).
DISCUSSION
Nasal valve area which is the narrowest segment of nasal airway, consists of the caudal end of the upper lateral cartilage, cartilaginous nasal septum, piriform aperture, floor of the nose, and head of the inferior turbi-nate.[9,10] Nasal valve which is a portion of the nasal valve
area, has the highest airway resistance.[10] Nasal valve
angle is the angle between the upper lateral cartilage and the nasal septum. According to anatomical stud-ies, in the Caucasian nose, this angle characteristically ranges from 10° to 15°.[9]
Improving or correcting nasal valve angle is a com-mon procedure acom-mong surgeons who perform func-tional rhinoplasties. In nasal surgery, nasal valve angles which renders the nasal valve angle and the most important area of the nasal cavity for surgeons have to be protected or corrected.
First step in the evaluation of nasal valve collapse is anterior rhinoscopy with a nasal speculum and the Cottle maneuver.
Because of examiner variability and thus, lack of objectivity in all of these methods, CT imaging has been proposed to obtain necessary anatomical information. However, conventional coronal scans cannot be per-formed at the optimal angle and therefore, cannot be used to evaluate the nasal valve reliably.
Nasal base view may provide an accurate assess-ment method of the nasal valve angles, as it was in our study because the measured angles of the nasal valve in the perpendicular to nasal airflow axis were within the normal range of 10°-15°.
Computed tomography is a safe, noninvasive method in evaluating nasal valve area. It provides high-quality reformatted images in any plane, from which the nasal valve angel can be accurately determined. Furthermore, with the perpendicular to nasal airflow axis, a more focused view of the nasal valve with less soft tissue arti-fact can be obtained and it will more closely represent
(a) (d) (b) (e) (c) (f)
Fig. 4. (a) Bland-Altman diagrams show the agreement between the measurements of the right nasal endoscopy-coronal CT images, (b) nasal endoscopy-perpendicular CT images, (c) coronal CT-perpendicular CT images; (d) the left nasal endoscopy-coronal CT images, (e) nasal endoscopy-perpendicular CT images, (f) coronal CT-perpendicular CT images.
the view of the nasal valve region seen by the examiner in the clinic and operating room settings. Nevertheless, CT has some limitations. It is not cost effective and leads to radiation exposure.
As well as septal deviations and turbinate hyper-trophy, irregularities of the nasal valve often result in an obstruction of nasal breathing. In such cases, CT imaging does not provide three dimensional and complete description of this region. Thus, it may lead to misdiagnoses and failures in surgical treatments of impaired nasal breathing.[11] Currently there is no
reliable examination method exists for the evaluation of the nasal respiratory function in the region of the nasal valve area where complex physiological correla-tions occur.[12]
There have been a few important studies evaluat-ing nasal valve area with acoustic rhinometry and CT.[6,8,13] In a more recent study, Cakmak et al.[6]
compared CT nasal valve area measurements with acoustic rhinometry and showed that a significant correlation between CT-derived cross-sectional areas obtained perpendicular to the acoustic axis and acous-tic rhinometry.
In this study, we found a significant correlation between nasal endoscopy and reformation plane of nasal base image results of nasal valve angle. However, nasal endoscopic evaluation method is easy to access with no side effects and it is a cost-effective method for the examination of the internal nasal valve angle. In addition, nasal endoscopy provides an opportunity to see the entire nasal structures, along with their relations with each other on three dimen-sional images.
REFERENCES
1. Bridger GP. Physiology of the nasal valve. Arch Otolaryngol 1970;92:543-53.
2. Bridger GP, Proctor DF. Maximum nasal inspiratory flow and nasal resistance. Ann Otol Rhinol Laryngol 1970;79:481-8.
3. Montgomery WM, Vig PS, Staab EV, Matteson SR. Computed tomography: a three-dimensional study of the nasal airway. Am J Orthod 1979;76:363-75.
4. Kassel EE, Cooper PW, Kassel RN. CT of the nasal cavity. J Otolaryngol 1983;12:16-36.
5. Poetker DM, Rhee JS, Mocan BO, Michel MA. Computed tomography technique for evaluation of the nasal valve. Arch Facial Plast Surg 2004;6:240-3.
6. Cakmak O, Coşkun M, Celik H, Büyüklü F, Ozlüoğlu LN. Value of acoustic rhinometry for measuring nasal valve area. Laryngoscope 2003;113:295-302.
7. Hilberg O, Jackson AC, Swift DL, Pedersen OF. Acoustic rhinometry: evaluation of nasal cavity geometry by acoustic reflection. J Appl Physiol 1989;66:295-303.
8. Min YG, Jang YJ. Measurements of cross-sectional area of the nasal cavity by acoustic rhinometry and CT scanning. Laryngoscope 1995;105:757-9.
9. Kasperbauer JL, Kern EB. Nasal valve physiology. Implications in nasal surgery. Otolaryngol Clin North Am 1987;20:699-719.
10. Cole P, Roithmann R. The nasal valve and current technol-ogy. Am J Rhinol 1996;10:23-31.
11. Ricci E, Palonta F, Preti G, Vione N, Nazionale G, Albera R, et al. Role of nasal valve in the surgically corrected nasal respiratory obstruction: evaluation through rhinomanom-etry. Am J Rhinol 2001;15:307-10.
12. Miman MC, Deliktaş H, Ozturan O, Toplu Y, Akarçay M. Internal nasal valve: revisited with objective facts. Otolaryngol Head Neck Surg 2006;134:41-7.
13. Gilain L, Coste A, Ricolfi F, Dahan E, Marliac D, Peynegre R, et al. Nasal cavity geometry measured by acoustic rhinom-etry and computed tomography. Arch Otolaryngol Head Neck Surg 1997;123:401-5.