Original
Article
Changes in Aortic Pulse Wave Velocity and the
Predictors of Improvement in Arterial Stiffness
Following Aortic Valve Replacement
Emir Cantürk, MD,1 Beytullah Çakal, MD,2 Og˘uz Karaca, MD,2 Onur Omaygenç, MD,2 Salih Salihi, MD,3 Arda Özyüksel, MD,4 and Atıf Akçevin, MD4
Background: The interaction between valvular aortic stenosis (AS) and arterial stiffness, as well as the impact of aortic valve replacement (AVR) on arterial stiffness, remains unclear. In this study, we aimed to evaluate the degree of AS severity on non-invasive pulse wave velocity (PWV) measurements. We also searched whether the AVR procedure favorably affects PWV. Methods: In all, 38 patients undergoing AVR for chronic AS were included. The degree of aortic stiffness was measured with PWV at both baseline and 6 months after AVR. Improvement in aortic stiffness was defined as the absolute decrease in PWV at 6 months compared to the baseline value.
Results: The study population had a mean age of 59 ± 16 years, mean aortic gradient of 47.1 ± 6.4 mmHg, and mean aortic valve area (AVA) index of 0.45 ± 0.11 cm²/m². Baseline PWV values correlated positively with the mean aortic gradient (r = 0.350, p = 0.031) and negatively with the AVA index (r = −0.512, p = 0.001). The mean PWV improved in 20 patients (53%) and worsened in 18 patients (47%). The baseline New York Heart Association (NYHA) class (odds ratio [OR] = 1.023, 95% confidence interval [CI] = 1.005–1.041, p = 0.041) and AVA index (OR = 1.040, 96% CI = 1.023–1.057, p = 0.028) emerged as the independent predictors of improvement in PWV following AVR.
Conclusion: The severity of AS was significantly associated with baseline PWV. In gen-eral, the mean PWV did not change with AVR. Baseline NYHA class and the AVA index independently predicted PWV improvement following AVR. Since the change in PWV after AVR was polarized based on the patients’ characteristics, such as preoperative NYHA functional class or AVA index, further studies are needed to confirm clinical significance of PWV change following AVR in severe AS patients.
Keywords: aortic stiffness, aortic stenosis, pulse wave velocity 1Department of Cardiovascular Surgery, Dragos Hospital, Bezm-i
Alem University, Istanbul, Turkey
2Department of Cardiology, Istanbul Medipol University, Istanbul, Turkey
3Department of Cardiovascular Surgery, Okan University, Istanbul, Turkey
4Department of Cardiovascular Surgery, Istanbul Medipol Univer-sity, Istanbul, Turkey
Received: March 29, 2017; Accepted: July 28, 2017
Corresponding author: Arda Özyüksel, MD. Department of Car-diovascular Surgery, Istanbul Medipol University, Medipol Mega Hospital, TEM Avrupa Otoyolu Göztepe Çıkıs¸ı, No: 1; 34214, Bag˘cılar, I˙stanbul, Turkey
Email: [email protected]
©2017 The Editorial Committee of Annals of Thoracic and
Cardiovascular Surgery. All rights reserved.
Introduction
Aortic stenosis (AS) is the most common form of val-vular heart disease in the developed countries. Since aor-tic elasaor-ticity diminishes in these relatively old patients who have cardiovascular risk factors for atherosclerosis, the stiffness of aorta increases producing higher velocity flow which can be measured by invasive and non-invasive methods.1)
Pulse wave velocity (PWV) is the gold standard assessment tool for arterial stiffness, providing infor-mation about functional elastic property and structural unity of the vessel wall. Higher PWV measure, which
reflects atherosclerosis and coronary artery calcification, is found to be an independent risk factor for all-cause and cardiovascular mortality in patients with hyperten-sion, diabetes, and renal disease.2–6)
Currently, AS should not be considered as an isolated aortic valve disease but rather a mixed disease in which the leading players are the left ventricle (LV; ability to adapt to the increased afterload), the valve (severity of valvular disease), and reduced arterial compliance.7) Hence, surgi-cal treatment of AS may account for the improvement in aortic distensibility by reducing compensated pathological hypertrophy (maximal wall thickness >12 mm in the inter-ventricular septum), left inter-ventricular pressure overload, preventing worsening left ventricular function which are the determinants of impaired aortic stiffness.
AS with chronic pressure overload result with com-pensatory remodeling, myocardial hypertrophy, and reduced end-systolic wall stress. Impairment of arterial compliance with elevated LV diastolic pressure and reduced arterial blood pressure (BP) leads to subendo-cardial ischemia while LV ejection fraction (EF), which is mostly maintained with mid-wall myocardial fibers, does not alter until these compensatory mechanisms failed.8,9) Both valvular disease and reduced vascular compliance lead substantial increase in left ventricular workload. For this reason, diastolic dysfunction occurs early phase of valvular disease compared with patients without impaired arterial stiffness. Decreased arterial compliance is found to be directly associated with a sig-nificant decrease in LV diastolic performance and an increase in LV filling pressure irrespective of AS sever-ity, LV EF, or the degree of LV hypertrophy in early phase of aortic valvular disease.7,10)
The relation between AS and PWV remains unclear since rare studies have investigated such a relation. Liu and colleagues reported significant association between AS severity and high PWV values.11) However, despite this finding, Celik et al. and Kidher et al. did not address such a relation between AS severity and high PWV values.12,13)
The objectives of this study were first to evaluate the degree of AS severity on non-invasive PWV, whether aortic valve replacement (AVR) favorably affects PWV and predictors of PWV improvement after AVR.
Materials and Methods
In all, 38 patients diagnosed with severe AS who underwent surgical AVR were examined prospectively at the preoperative period and at the 6th month after the
surgery between November 2014 and May 2016 at Istanbul Medipol University Hospital. All patients gave informed consent before inclusion. Clinical history and examination including New York Heart Association (NYHA) functional classification and detailed echocar-diographic assessment were determined preoperatively and 6-month postoperatively following AVR.
Exclusion criteria which might significantly affect the measurement of PWV were defined as follows: anemia (hemoglobin [Hb] <10 g/dL), chronic kidney disease, reduced LV systolic function (EF <45%), severe aortic regurgitation, and aortic dissection.
PWV measurement method
All participants avoided alcohol, coffee, and tobacco for at least 2 hours prior to measurement. They were all rested for 10 minutes in a quiet, temperature-controlled room (22–25°C) before measurement. Brachial BP and heart rate were measured using The ARC Solver method (Austrian Institute of Technology, Vienna, Austria).14) This device is a commercially available brachial oscil-lometric 24-hour ambulatory BP monitor with Food and Drug Administration and Conformité Europé enne approval.15–17) It provides estimates of central systolic and diastolic BP and augmentation index (AIX) using a vali-dated oscillometric device (Mobil-O-Graph NG 24 hour PWA, IEM, Germany) to record pressure waves and the application of a general transfer function. The recordings are carried out at diastolic pressure level for approxi-mately 10 seconds using a conventional BP cuff for adults available in two sizes (24–34 and 32–42 cm) and a high fidelity pressure sensor (MPX5050, Freescale Inc., Tempe, AZ, USA). The sensor is connected to a 12-bit A/D converter by means of an active analog band bass filter (0–25 Hz). After digitalization, the signal process-ing is performed usprocess-ing a three-level algorithm. In the first step, the single pressure waves are verified for their plau-sibility by testing the position of minima and the corre-sponding wavelengths. During the second stage, all single pressure waves are compared with each other to recog-nize artifacts. Thereafter, an aortic pulse wave is gener-ated by the means of a generalized transfer function. Finally, the coherence of the measured parameters is ver-ified and displayed within the Mobil-O-Graph NG soft-ware package that also allows visual inspection to unveil consistently recorded intrinsic waveform distortion man-ually. The entire process takes between 2 and 3 minutes. Preoperative and at sixth month after AVR, PWV values were recorded assessed with ARC Solver method.
Statistical analysis
Statistical analyses were conducted using SPSS (version 17.0, SPSS Inc., Chicago, IL, USA). Data were expressed as mean ± standard deviation for con-tinuous variables and percentage for categorical vari-ables. Statistical significance was defined as a p value <0.05 for all comparisons. Shapiro–Wilk test was used to test for normal distribution. Continuous variables were compared using Student’s t-test for independent samples that showed normal distribution, whereas the Mann–Whitney U-test was used for non-normally dis-tributed samples based on the improvement or worsen-ing of PWV. Associations of the categorical variables between two groups were tested using Chi-square test. Statistically significant (p <0.05) variables in the uni-variate analysis were tested in the multiuni-variate model. Comparison of the preoperative and postoperative hemodynamic parameters in the study population was performed using the paired samples t-test. Pearson cor-relation analyses were used to test the cor-relationship between the baseline PWV and 1) the mean aortic gra-dient, 2) AVA, and 3) AVA index. The correlation between the baseline AVA index and the change in PWV were analyzed with the same method. The results of the correlations were shown on separate scatter-dot graphs with the corresponding r and p values. Univari-ate and multivariUnivari-ate logistic regression analyses were performed to define the independent predictors of improvement in arterial stiffness. Age, baseline NYHA class, baseline LV hypertrophy, concomitant coronary artery bypass grafting (CABG), Bentall procedure, and baseline AVA index were the independent variables, whereas the absolute decrease in PWV at 6 months of AVR was the dependent variable of the model. Results of the regression analyses were expressed as the p value and odds ratio (OR) in confidence interval (CI) of 95%.
Results
Descriptive results
Between November 2014 and May 2016, 38 patients (28 males) with a mean age of 59.0 ± 16.1 years were included in this study. No mortality or cerebrovascular events were recorded during the follow-up period. Baseline clinical characteristics, echocardiographic data of the study population, and comparison based on improvement in PWV after AVR are presented in Table 1. In all, 12 patients (31%) had concomitant CABG, 22 patients (58%) were hypertensive and 12
(42%) patients had diabetes mellitus. In all, 15 out of 38 patients underwent aortic root replacement (Bentall) procedure. PWV-high and PWV-improved groups were not significantly different with respect to the use of angiotensin-converting enzyme inhibitors, angiotensin II receptor blockers, β-blockers, statins, or aspirin.
PWV changes after AVR
Mean aortic gradient of 47.1 ± 6.4 mmHg, and mean aortic valve area (AVA) index of 0.45 ± 0.11 cm²/m² were recorded preoperatively. Baseline PWV values (9.07 ± 1.28) correlated positively with the mean aortic gradient (r = 0.350, p = 0.031) and negatively with AVA (r = −0.475, p = 0.003) and AVA index (r = −0.512, p = 0.001) (Fig. 1A). We detected a linear correlation with PWV change (defined as baseline PWV − postoperative PWV) and baseline AVA index (Fig. 1B) Time courses of preop-eratively and postoppreop-eratively hemodynamic parameters are shown in Table 2. The mean PWV improved in 20 patients (53%) and worsened in 18 patients (Fig. 2A), whereas the overall PWV did not statistically change following AVR (baseline 9.06 ± 1.28 m/sec vs. follow-up 8.44 ± 1.81 m/sec, p = 0.332) (Table 2). NYHA class of PWV improved patients was significantly lower than that of PWV-high group during follow-up (p = 0.009) (Fig. 2A). Aortic stiffness improved group had better baseline AVA index values compared that of worsened group (p <0.001) (Fig. 2B). There were no significant dis-tinction between the PWV-high and PWV-improved groups in terms of age, gender, and coronary artery dis-ease. Left ventricular hypertrophy was associated with higher PWV values (p: 0.023). In all, 15 patients under-went concomitant Bentall procedure, 11 of which had PWV improvement during follow-up compared with four patients in PWV high group (p = 0.012). Lower PWV values were detected in younger patients (p = 0.016). Patients with improved PWV values have also lower rates of concomitant CABG (p = 0.038), and lower baseline AVA indices (p < 0.001). Multiple logistic regression analysis confirmed these findings that baseline NYHA class (OR = 1.023, 95% CI = 1.005–1.041, p = 0.041) and AVA index (OR = 1.040, 96% CI = 1.023–1.057, p = 0.028) were independent predictors of improvement in PWV following AVR (Table 3).
Discussion
Studies investigating the relationship between AS and PWV are lacking in the literature.12,14) PWV has a strong
definitive conclusion pointing out association between arterial stiffness and AS.
Limited number of studies has evaluated aortic stiffness following AVR. Two studies investigated the impact of AVR for severe AS on aortic stiffness assessed by echo-cardiography; however, only Kidhera et al. used PWV as an arterial stiffness index, which is the gold standard index of aortic stiffness.13,20,21) One study (n = 31 patients) revealed that aortic root distensibility and aortic root stiffness index improved 6-month postoperatively to val-ues similar to preoperative after transit deterioration.20) The second study (n = 12 patients) demonstrated that AVR in patients with AS was related with progressive improvement in similar 1-year aortic stiffness values comparable to that matched controls. Since the above aforementioned studies did not use PWV, our study is of clinical importance supporting the results of Kidhera et al., which found AVR has no effect on aortic stiffness
Table 1 Baseline clinical characteristics of the study population and comparison based on improvement in PWV following AVR Overall population (n = 38) PWV worsened (n = 18) PWV improved (n = 20) p Age (years) 59.0 ± 16.1 62.8 ± 12.1 55.6 ± 18.4 0.016 Gender, n (male %) 28 (74) 12 (67) 16 (80) 0.365 BSA (m²) 1.85 ± 0.18 1.90 ± 0.16 1.81 ± 0.19 0.197 NYHA Class 2.3 ± 0.8 2.7 ± 0.7 2.1 ± 0.8 0.009 NYHA III-IV, n (%) 19 (50) 13 (72) 6 (30) 0.008 Hypertension, n (%) 22 (58) 10 (56) 12 (60) 0.382 Diabetes, n (%) 16 (42) 7 (39) 9 (45) 0.263 Atrial fibrillation, n (%) 10 (26) 6 (33) 4 (20) 0.165 Medication, n (%) β-blocker 19 (50) 10 (56) 9 (45) 0,856 ACE/ARB 16 (42) 9 (45) 7 (39) 0.263 Statin 8 (21) 3 (17) 5 (25) 0.154 Aspirin 25 (66) 11 (61) 14 (70) 0.564
Coronary artery disease, n (%) 20 (53) 11 (61) 9 (45) 0.112
Bicuspid aortic valve, n (%) 13 (34) 7 (39) 6 (30) 0.654
Concomitant CABG, n (%) 12 (31) 8 (44) 4 (20) 0.038
Bentall procedure, n (%) 15 (39) 4 (22) 11 (55) 0.012
LVEF (%) 58.0 ± 6.7 57.8 ± 6.4 58.1 ± 7.1 0.445
LV hypertrophy, n (%) 24 (63) 14 (78) 10 (50) 0.023
Ascendan aort diameter (mm) 42.1 ± 7.4 41.0 ± 6.7 43.3 ± 7.1 0.246
Max. aortic gradient (mmHg) 72.7 ± 11.9 76.5 ± 14.2 69.2 ± 8.4 0.072
Mean aortic gradient (mmHg) 47.1 ± 6.4 47.3 ± 7.0 46.8 ± 5.8 0.121
AVA (cm²) 0.82 ± 0.15 0.72 ± 0.13 0.91 ± 0.11 <0.001
AVA index (cm²/m²) 0.45 ± 0.11 0.38 ± 0.08 0.51 ± 0.09 <0.001
Baseline PWV (m/sec) 9.07 ± 1.28 9.65 ± 1.37 8.53 ± 0.94 0.005
Follow-up PWV (m/sec) 9.24 ± 1.81 10.76 ± 1.31 7.88 ± 0.84 <0.001
Values are shown as n (%) for categorical variables and means ± standard deviation for continuous variables. AVR: aortic valve replacement; BSA: body surface area; CABG: coronary artery bypass graft; CPB: cardiopulmonary bypass; PWV: pulse wave velocity; NYHA: New York Heart Association; LVEF: left ventricular ejection fraction; AVA: aortic valve area; ACEi: angiotensin-converting enzyme inhibitor; ARB: angiotensin II receptor blockers
correlation with indicators of coronary atherosclerosis and calcification.18) It is predictable for patients with increased aortic calcification to have increased PWV values. Liu and colleagues found both the AV pressure gradient and the severity of calcification were strongly correlated with PWV studied in 30 patients.11) By con-trast, Celik et al. and Kidher et al. did not address such a relation between severity of AS as assessed by aortic mean gradient, aortic valve peak gradient, and AVA.12,19 Our study indicates that PWV values correlated posi-tively with mean aortic gradient and negaposi-tively with the AVA index preoperatively consistent with the results of study of Liu et al.11) By indicating this relation, our study advocates that AS and aortic stiffness are reflective of distinct spectrum of the same atherosclerotic disease. Unfortunately, due to relatively small sample size and different methodological assessments between our and previous studies, a larger study is needed to make a
postoperatively. Since AVR involves aortotomy and inflict a trauma upon aortic wall with damage of the vasa vasorum, this may hedge the expected benefit of AVR on PWV improvement. The removal of the periaortic fat (containing the vasa vasorum) from the ascending aorta in animal studies has been resulted with worse aortic dis-tensibility due to ischemic medial necrosis and altered fiber structure.22) Surgical trauma to the aortic wall via cannulation, cooling, clamping, incising, and then sutur-ing, all of which disrupts the aortic wall continuity may also countervail the favorable effects of AVR on PWV improvement. Combined CABG and AVR procedure which nearly doubles the operative mortality rate also resulted worsened PWV values compared to isolated
AVR group in our study supporting the arguments dis-cussed above.
Preoperative better functional status prior to aortic surgery has better short- and long-term postoperative mortality.23) Functional status assessed by NYHA classi-fication is the most popular, validated variable used in risk evaluation models for prediction of survival, clinical outcomes in heart failure, AVR, AS patients.24,25) Again, there is only one study investigating the relationship between preoperative and postoperative NYHA class, with preoperative PWV values.13) In this study, preoper-ative PWV-normal patients scored significantly improved NYHA class compared with PWV-high patients postop-eratively. In our study, preoperative determination of
Fig. 1 (A) Scatter-dot graph indicating correlation between baseline PWV values and mean aortic gradient, AVA,
and AVA index. Values are shown as correlation coefficients (r); correlation is significant at the 0.05 level. (B) Scatter-dot graph showing the linear correlation between the baseline AVA index values and the change in aortic stiffness (defined as baseline PWV − postoperative PWV) in patients undergoing aortic valve replacement. Values are shown as correlation coefficients (r); correlation is significant at the 0.05 level. AVA: aortic valve area; PWV: pulse wave velocity
Fig. 2 (A) Distribution of NYHA functional classification for aortic stiffness worsened and aortic
stiffness improved groups. (B) Comparison of the mean AVA index values of the study pop-ulation based on worsening or improvement in aortic stiffness following aortic valve replace-ment demonstrated with a box-plot graphic. AVA: aortic valve area; NYHA: New York Heart Association; PWV: pulse wave velocity
Table 2 Comparison of the preoperative and postoperative hemodynamic parameters assessed with the non-invasive ARC Solver method
Before AVR After AVR p value
Systolic BP (mmHg) 128.1 ± 21.2 123.3 ± 18.9 0.232
Diastolic BP (mmHg) 77.1 ± 11.8 71.6 ± 10.6 0.116
Pulse pressure (mmHg) 51.2 ± 10.8 52.1 ± 8.5 0.749
Total vascular resistance (mmHg sec/mL) 1.38 ± 0.41 1.12 ± 0.38 0.241
Cardiac output (L/min) 4.3 ± 1.1 5.3 ± 0.8 0.018
Cardiac index (L/min m²) 2.2 ± 0.4 2.9 ± 0.3 0.032
PWV (m/sec) 9.07 ± 1.28 8.44 ± 1.81 0.332
Augmentation index (%) 26.6 ± 4.8 25.8 ± 3.5 0.466
AVR: aortic valve replacement; BP: blood pressure; PWV: pulse wave velocity; ARC: ARC Solver method (Austrian Institute of Technology, Vienna, Austria).
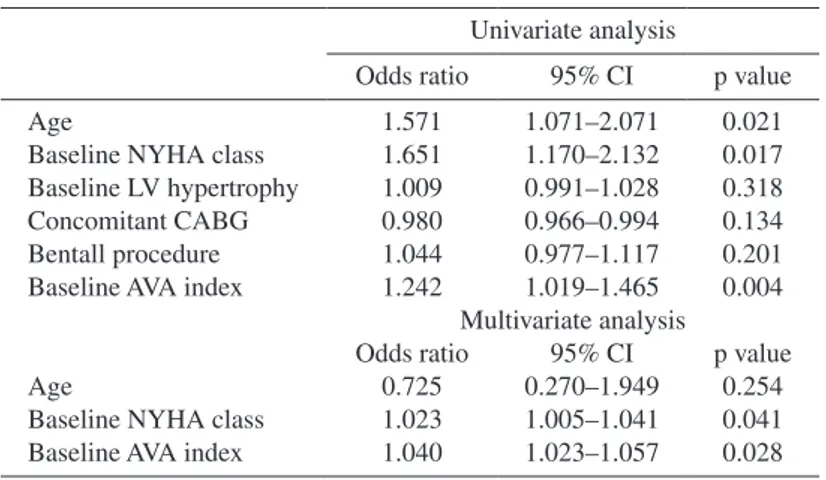
Table 3 Univariate and multivariate logistic regression analyses to predict improvement in arterial stiffness (absolute decrease in PWV) at 6 months after AVR
Univariate analysis
Odds ratio 95% CI p value
Age 1.571 1.071–2.071 0.021
Baseline NYHA class 1.651 1.170–2.132 0.017
Baseline LV hypertrophy 1.009 0.991–1.028 0.318
Concomitant CABG 0.980 0.966–0.994 0.134
Bentall procedure 1.044 0.977–1.117 0.201
Baseline AVA index 1.242 1.019–1.465 0.004
Multivariate analysis
Odds ratio 95% CI p value
Age 0.725 0.270–1.949 0.254
Baseline NYHA class 1.023 1.005–1.041 0.041
Baseline AVA index 1.040 1.023–1.057 0.028
Values are shown as odd ratio (95% CI), values indicate statistically significant values; it is significant at the 0.05 level. PWV: pulse wave velocity; AVR: aortic valve replacement; CABG: coronary artery by-pass grafting; CI: confidence interval; AVA: aortic valve area; LV: left ventricular; NYHA: New York Heart Association
better NYHA class emerged as an independent predictor of improved PWV values following AVR. A possible explanation for this result is that NYHA class is more symptomatic global tool affected by the sum of measure-ment of cardiac and non-cardiac factors rather than sin-gle objective organ or blood measurement which alone could not able to address such a relation with PWV.The increase in collagen and calcium seen in aortic stenotic valve leads, in the arterial vasculature, to a vessel stiffen-ing process.5) Since arterial stiffness and AS share the similar pathologic process, it might be expected as aortic valve stenosis gets worse measured by AVA index, it would result PWV worsening following AVR as shown in our study.
The relatively small sample size of our study may be criticized but the number of patients enrolled in this trial is comparable to that of reported studies mentioned above which may help to justify an assessment about the relationship PWV change following aortic surgery. Second, despite NYHA class has found to be a good predictor of PWV improvement, NYHA classification is a subjective measure to be affected by several confound-ing factors. Some could argue that sixth month follow-up after AVR might be early to conclude such a decision between AVR and PWV whether these findings would have changed during further visits.
As a result, our study demonstrated that AS severity was significantly associated with baseline PWV. Even if PWV improved in some patients following AVR, overall PWV did not change. Baseline NYHA class and AVA index were independent predictors of PWV improve-ment. Further studies are warranted to confirm the clini-cal importance of change in PWV after AVR in severe AS since patients’ background, such as preoperative NYHA functional class or AVA index could polarize the change in PWV after AVR.
Disclosure Statement
None.
References
1) DeLoach SS, Townsend RR. Vascular stiffness: its measurement and significance for epidemiologic and outcome studies. Clin J Am Soc Nephrol 2008; 3: 184-92.
2) Benetos A, Adamopoulos C, Bureau JM, et al. Deter-minants of accelerated progression of arterial stiffness
in normotensive subjects and in treated hypertensive subjects over a 6-year period. Circulation 2002; 105: 1202-7.
3) Cruickshank K, Riste L, Anderson SG, et al. Aortic pulse-wave velocity and its relationship to mortality in diabetes and glucose intolerance: an integrated index of vascular function? Circulation 2002; 106: 2085-90. 4) Guerin AP, Blacher J, Pannier B, et al. Impact of aortic
stiffness attenuation on survival of patients in end-stage renal failure. Circulation 2001; 103: 987-92. 5) Laurent S, Cockcroft J, Van Bortel L, et al. Expert
con-sensus document on arterial stiffness: methodological issues and clinical applications. Eur Heart J 2006; 27: 2588-605.
6) Reference Values for Arterial Stiffness’ Collaboration. Determinants of pulse wave velocity in healthy peo-ple and in the presence of cardiovascular risk factors: ‘establishing normal and reference values’. Eur Heart J 2010; 31: 2338-50.
7) Weisz SH, Magne J, Dulgheru R, et al. Carotid artery and aortic stiffness evaluation in aortic stenosis. J Am Soc Echocardiogr 2014; 27: 385-92.
8) Boutouyrie P, Tropeano AI, Asmar R, et al. Aortic stiffness is an independent predictor of primary cor-onary events in hypertensive patients: a longitudinal study. Hypertension 2002; 39: 10-5.
9) Briand M, Dumesnil JG, Kadem L, et al. Reduced sys-temic arterial compliance impacts significantly on left ventricular afterload and function in aortic stenosis: implications for diagnosis and treatment. J Am Coll Cardiol 2005; 46: 291-8.
10) Ros¸ca M, Magne J, Ca˘lin A, et al. Impact of aortic stiffness on left ventricular function and B-type natri-uretic peptide release in severe aortic stenosis. Eur J Echocardiogr 2011; 12: 850-6.
11) Liu PY, Tsai WC, Lin CC, et al. Invasive measure-ments of pulse wave velocity correlate with the degree of aortic valve calcification and severity as-sociated with matrix metalloproteinases in elderly patients with aortic valve stenosis. Clin Sci 2004; 107: 415-22.
12) Celik S, Durmus¸ I, Korkmaz L, et al. Aortic pulse wave velocity in subjects with aortic valve sclerosis. Echocardiography 2008; 25: 1112-6.
13) Kidher E, Harling L, Sugden C, et al. Aortic stiffness is an indicator of cognitive dysfunction before and after aortic valve replacement for aortic stenosis. Interact Cardiovasc Thorac Surg 2014; 19: 595-604.
14) Wassertheurer S, Kropf J, Weber T, et al. A new oscil-lometric method for pulse wave analysis: comparison with a common tonometric method. J Hum Hypertens 2010; 24: 498-504.
15) Franssen PM, Imholz BP. Evaluation of the Mobil-O-Graph new generation ABPM device using the ESH criteria. Blood Press Monit 2010; 15: 229-31.
16) Jones CR, Taylor K, Chowienczyk P, et al. A valida-tion of the Mobil O Graph (version 12) ambulatory
blood pressure monitor. Blood Press Monit 2000; 5: 233-8.
17) Weber T, Wassertheurer S, Rammer M, et al. Valida-tion of a brachial cuff-based method for estimating central systolic blood pressure. Hypertension 2011; 58: 825-32.
18) Tillin T, Chambers J, Malik I, et al. Measurement of pulse wave velocity: site matters. J Hypertens 2007; 25: 383-9.
19) Kidher E, Harling L, Ashrafian H, et al. Aortic stiff-ness as a marker of cardiac function and myocardial strain in patients undergoing aortic valve replacement. J Cardiothorac Surg 2014; 9: 102.
20) Barbetseas J, Alexopoulos N, Brili S, et al. Changes in aortic root function after valve replacement in patients with aortic stenosis. Int J Cardiol 2006; 110: 74-9. 21) Nemes A, Galema TW, Geleijnse ML, et al. Aortic
valve replacement for aortic stenosis is associated with
improved aortic distensibility at long-term follow-up. Am Heart J 2007; 153: 147-51.
22) Stefanadis C, Vlachopoulos C, Karayannacos P, et al. Effect of vasa vasorum flow on structure and func-tion of the aorta in experimental animals. Circulafunc-tion 1995; 91: 2669-78.
23) Piérard S, de Meester C, Seldrum S, et al. Impact of preoperative symptoms on postoperative survival in severe aortic stenosis: implications for the timing of surgery. Ann Thorac Surg 2014; 97: 803-9.
24) Chyu J, Fonarow GC, Tseng CH, et al. Four-variable risk model in men and women with heart failure. Circ Heart Fail 2014; 7: 88-95.
25) Holland R, Rechel B, Stepien K, et al. Patients’ self- assessed functional status in heart failure by New York Heart Association class: a prognostic predictor of hos-pitalizations, quality of life and death. J Card Fail 2010; 16: 150-6.