The Feasibility of a Cloud-Based Low-Cost Environmental Monitoring System Via Open Source
Hardware in Greenhouses
Ali ÇAYLI 1, Adil AKYÜZ 2, A. Nafi BAYTORUN 3, Sait ÜSTÜN 2, Ali Selçuk MERCANLI 4
1Kahramanmaras Sutcu Imam University, Turkoglu MYO, Kahramanmaras, 2Kahramanmaras Sutcu Imam University, Faculty of
Agriculture, Kahramanmaras, 3Cukurova University, Faculty of Agriculture, Adana, 4Kahramanmaras Sutcu Imam University, Department
of Informatics, Kahramanmaras, Turkey : [email protected]
ABSTRACT
One of the most critical parameters in agricultural production is environmental conditions. It is of vital importance to ensure and monitor suitable climatic conditions for various controlled agricultural structures and production systems such as greenhouses. To this aim, most data monitoring systems cannot be efficiently used due to high cost and insufficient technical knowledge. It is possible to design low-cost and scalable monitoring, control and data acquisition systems via open source hardware in order to monitor climatic data for agricultural practices in small enterprises and rural areas. In this study, a low-cost system designed via open source hardware was tested under real conditions. Temperature and relative humidity were measured via the sensors in the system and sent to a data server through a wireless network. In addition, collected data was compared to reference devices for statistical analysis. The results suggest that these low-cost systems, which are designed via open source hardware, can be used as a data collection and decision support system by agricultural enterprises. DOI:10.18016/ ksudobil.341513 Article History Received : 03.10.2017 Accepted : 07.01.2018 Keywords
Open source hardware, Data acquisition, Data logger, Sensors, Decision support, Greenhouses Research Article
Açık Kaynaklı Donanım ile Bulut Tabanlı ve Düşük Maliyetli Bir Çevre Koşulları İzleme Sisteminin
Seralarda Uygulanabilirliği
ÖZET
Tarımsal üretimi etkileyen en önemli parametre çevre koşullarıdır. Uygun iklim koşullarının sağlanması ve bu koşulların takip edilmesi özellikle kontrollü üretim yapıları olan seralar başta olmak üzere birçok tarımsal yapılarda ve üretim sistemlerinde hayati önem arz etmektedir. Bu amaçla kullanılan birçok veri izleme sistemi, yüksek maliyet ve yeterli teknik bilgi olmadığından yaygın bir şekilde kullanılamamaktadır. Özellikle küçük işletmelerde ve kırsal bölgelerde, tarımsal faaliyetler için hayati öneme sahip iklim verilerinin izlenmesi amacıyla, açık kaynak donanımlar ile düşük maliyetli ve ölçeklenebilir izleme, kontrol ve veri toplama sistemleri tasarlanması mümkün olabilmektedir. Bu çalışmada açık kaynak donanımlarla düşük maliyetle tasarlanan sistem, gerçek koşullarda test edilmiştir. Tasarlanan bu sistemde sıcaklık ve oransal nem değerleri sensörler ile ölçülerek kablosuz bir ağ üzerinden veri sunucusuna aktarılmıştır. Ayrıca bu veriler referans cihazlarla karşılaştırılarak istatistiksel olarak değerlendirilmiştir. Elde edilen sonuçlar, açık kaynak donanımlar ile tasarlanan düşük maliyetli bu tür sistemlerin tarımsal işletmelerde veri toplama-izleme ve karar destek sistemi olarak kullanılabileceği göstermiştir.
Makale Tarihçesi
Geliş Tarihi : 03.10.2017 Kabul Tarihi : 07.01.2018
Anahtar Kelimeler
Açık kaynak donanım, Veri toplama, Veri kaydedici, Sensörler, Karar destek, Seralar Araştırma Makalesi
To Cite : Çaylı A, Akyüz A, Baytorun AN, Üstün S, Mercanlı AS 2018. The Feasibility of a Cloud-Based Low-Cost Environmental
Monitoring System Via Open Source Hardware in Greenhouses. KSÜ Tarım ve Doğa Derg 21(3): 323-338. DOI:10.18016/ ksudobil.341513
RMSE root mean square error ANOVA one-way analysis of variance RPI raspberry pi development board PWM pulse width modulation
RTC real time clock
FCM Firebase Cloud Messaging
INTRODUCTION
Crop amount and quality are directly influenced by environmental conditions. Seeding-planting and harvest time vary in different geographical locations. Studies on plant growth and determination of their reactions during and prior to growth require using total degree-days and measuring related data in the nearby area (Bonhomme, 2000). Insufficient temperature leads to low-quality and inefficient harvest. For instance, although tomato is one of the most resistant vegetables against low temperatures compared to other greenhouse plants, its growth slows down under 10°C, and it freezes at 0°C. Growers must provide suitable climatic conditions for agricultural production in their greenhouses for healthier, quality and high yield (Von Zabeltitz, 2011). Greenhouse micro-climate modelling bears utmost importance for an optimal indoor environment at different stages of plant growth. An efficient thermal model must developed in order to calculate solar radiation input as well as total thermal conductivity coefficient and greenhouse energy and mass balance (Sethi ve ark., 2013).
The potential of mathematical models are widely acknowledged in order to analyze the interaction and components of natural systems, to predict changes and uncertainties in results and to encourage communication between scientists, administrators and groups from different backgrounds (Bellocchi ve ark., 2010). For a successful model, the data to be used in modelling must fully represent the field of activity. However, studies are often conducted based on the data obtained from official weather stations in the related region. These regional data may not fully represent regional values. In addition, it is difficult to obtain from official stations, and analyze and process data. Nevertheless, it is inevitable to use official data in order to measure long term climatic values.
In a study on various decision support system automations used in agriculture, (Bhimanpallewar ve Narasingrao, 2015) reported that existing systems lead to high costs and that these systems are not feasible and user-friendly for growers in India.
Rapid developments in electronics technology paved the way for various low-cost sensing, monitoring and control systems (Fisher ve Gould, 2012). Thanks to these developments, sensor sizes become smaller and thus low-cost talented machines that can interact with their environment are more widely used. These devices are now more accessible in various commercial markets. There are numerous commercial data collection
products under different brands in the market. Open source philosophy was first introduced by Richard Stallman under GNU project in 1984 and, similar to software, hardware were licensed as open source in the upcoming years. The term “free software” started to be used instead of open source software in 1998 (Stallman ve Gay, 2009). In the same year, Open Source Initiative was founded in order to offer services for public interest in the field of open source (opensource.org). Open source hardware have been used in various fields in recent years. Open source hardware is defined by oshwa.org (2016) as a hardware “whose design is made publicly available so that anyone can study, modify, distribute, make, and sell the design or hardware based on that design”.
Developed by Raspberry Pi foundation in the UK, Raspberry Pi (RPI) is a low-cost and small-sized computer which can be used with a standard keyboard and mouse and connected to a monitor or TV (Pi, 2016). Debian and Arch Linux offered by the foundation can be used as an operating system as well as Microsoft Windows 10 in the new version hardware. Arduino project was initiated in Ivrea, Italy in 2005 in order to develop simple and handy boards. It is widely used and its circuit design was licensed as “Creative Commons
Attribution-Share Alike”
(https://creativecommons.org/licenses/by-sa/2.5/). Thus, besides the company which produces it under open source license, anyone can modify and re-design this board and offer it as a new product.
A low-cost open source hardware development platform, Arduino offers a great potential for the improvement of data collection, automation and control abilities in scientific research due to its low cost (Fisher ve Gould, 2012). Unlike old hardware, it is possible to easily and rapidly develop micro-processor systems via open source hardware (Faugel ve Bobkov, 2013). Before development boards such as Arduino became widespread, some studies had been carried out on low-cost data collection devices (Dedrick ve ark., 2000; Riley ve ark., 2006). However, technical know-how and experience are necessary to design circuits and develop software for this kind of systems. Micro-controller-based circuits that are developed via new sensor technology offer various advantages for agricultural practices (Fisher ve Kebede, 2010). Open hardware development platform is widely used in various fields such as agricultural practices and natural sources as a data collection, monitoring and logging system (Buechley ve Eisenberg, 2008; Zhang ve ark., 2009; Bergmann ve ark., 2010; Fisher ve Kebede, 2010; Gordon ve ark., 2010; Hicks ve ark., 2011).
Open hardware were used in scientific studies in various fields such as data collection via unmanned aerial vehicle (Polo ve ark., 2015), biomedicine (Kornuta ve ark., 2013), pharmacology (Thomson ve White, 2014), monitoring radiation levels in nuclear plants (Gomaa ve
ark., 2013) and construction (Barroca ve ark., 2013) and other disciplines (Mai ve ark., 2013; Sáiz, Mai, Hauser, ve ark., 2013; Sáiz, Mai, López, ve ark., 2013). This kind of systems can be combined with wireless sensor networks. Wireless sensor networks can be used in various different practices such as remote control of micro electromechanical systems and remote data collection thanks to their flexibility, error tolerance, high sensing accuracy and quick application capacity (Akyildiz ve ark., 2002).
Data obtained from wireless sensor network-based measurements, which is a part of daily life in modern technology, enable us to understand many environmental parameters in various fields such as urban environment, natural resources and sensitive ecology (Gubbi ve ark., 2013). These technologies offer new solutions for the monitoring of environmental management and agricultural policies and the improvement of agricultural production in impoverished rural areas (Mesas-Carrascosa ve ark., 2015). Furthermore, because they are developed via open source hardware, these low-cost systems can be controlled by different devices through an interface when integrated into computer systems (Koenka ve ark., 2014).
This system aims to determine the performances of
low-cost and open source hardware for the acquisition of climate data necessary for various reasons in agricultural activities. Although commercial systems similar to it are available, they are relatively expensive and inflexible. Another aim is to make this low-cost system accessible to everyone by benefiting from emerging technologies such as open source and free tools.
In this study, a system design is proposed to assist in the acquisition, storage, processing and decision. It was compared with reference devices in order to measure its reliability and accuracy. In addition, the proposed system was integrated cloud-based messaging, and a mobile alarming system was designed.
MATERIAL and METHODS
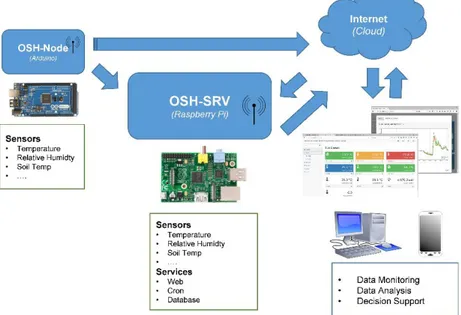
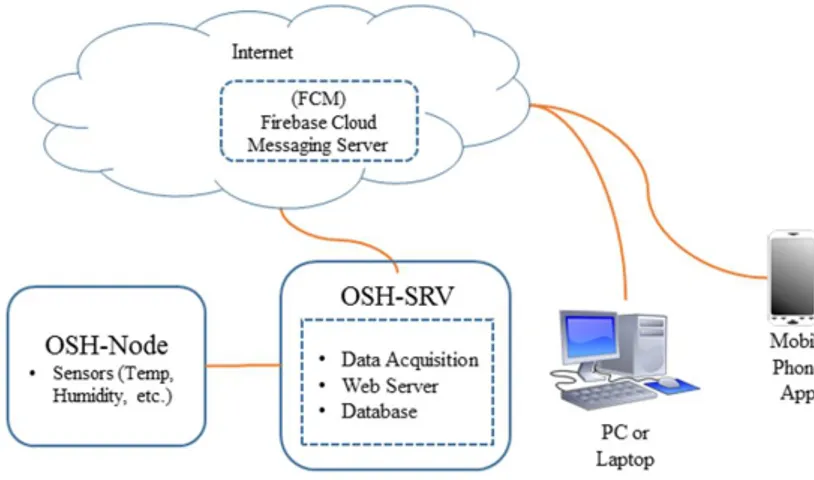
The prototype of a low-cost data acquisition system was developed via open source hardware in this study. This system consists of two components: field node and main station. The main station, Open Source Hardware Server, is called OSH-SRV. The field node which connects and sends data to the main device is called OSH-Node. The data obtained from sensors in the field node are instantly sent to the main station and stored in the database here.
Figure 1 - A model of data acquisition and monitoring system The system is flexible and suitable to expansion. In
addition to devices with different technological features, many field nodes can be added to the system. The data stored on OSH-SRV can be accessed via a web service, local network, internet and all network enabled devices including mobile phones. Thanks to the web-based software developed via open source software tools, various climatic data such as temperature, humidity and soil temperature can be analyzed, and they assist
conducted at 468 m above sea level at Kahramanmaras Sutcu Imam University, Faculty of Agriculture Research Field (37° 35' 20'' N, 36° 48' 12'' E, WGS84) (Figure 2). The region is under typical Mediterranean climate conditions. TFA Nexus (TFA Dostmann GmbH & Co. KG) meteorology station was used as reference. It measures temperature at between -40 °C and 80 °C, at an accuracy of ±1 °C and a sensitivity of 0.1 °C, and measures relative humidity between 0% and 99%, at an
Figure 2 - The research field where the study was conducted The reference device was positioned next to OSH-SRV
and OSH-Node for a measurement under the same conditions. All devices were set to log data in every 5 minutes. The measurement data of OSH-SRV and OSH-Node were obtained via Internet network while the data of reference device were obtained weekly via a laptop computer. Hourly and daily mean values of measurement data were calculated based on Equation 1. 𝑇̅ =∑𝑛𝑖 = 1 𝑇𝑖
𝑛 (1)
Here, 𝑇 ̅represents mean value and Ti is the measurement value.
The daily data obtained from each sensor were compared to reference station data and statistically analyzed. In addition, mean daily values were calculated based on the values measured in every 5 minutes between March 25th and April 30th. These mean values were compared to the data obtained from
the official station data located 7 km away from the research field and statistically analyzed.
Hardware
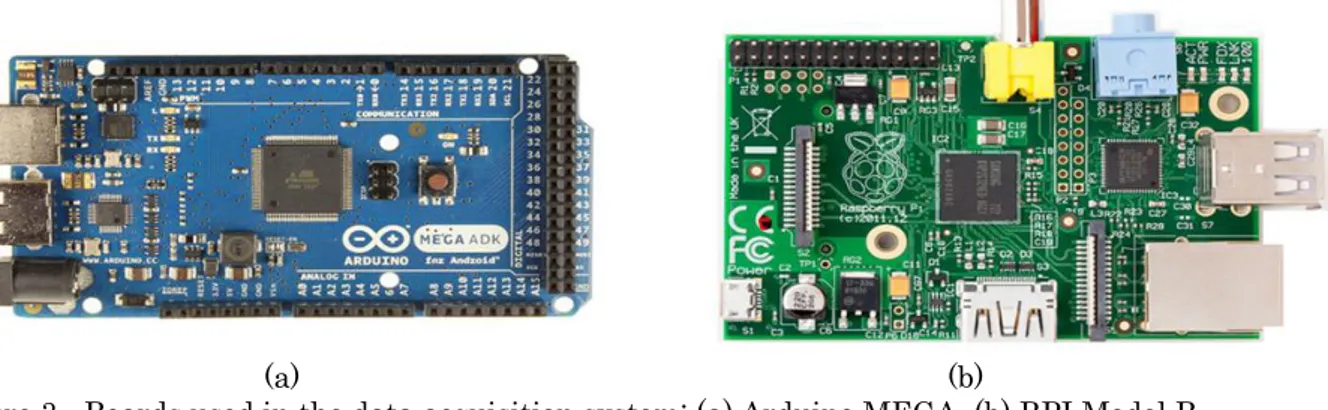
In the system proposed in this study, two different open source hardware development boards, i.e. Raspberry Pi Model B (RPI) (Figure 3(b)) and Arduino Mega 2560 Rev3 (Figure 3(a)), were used. RPI development board is a mini computer with ARM1176JZF-S 700 MHz Broadcom BCM2835 microprocessor and 512 MB RAM, and runs on Linux operating system. It has two USB 2.0 ports, HDMI video, 10/100 RJ45 ethernet and SD card socket. In addition, it can perform UART, I2C and SPI data bus connection thanks to 8 general purpose input-output (GPIO) connection. It requires a power amount of 5.0 volt 700 mA. Various Linux-based operating systems can be used such as Debian GNU/Linux, Arch Linux and RISC OS (Pi, 2016).
(a) (b)
Figure 3 - Boards used in the data acquisition system: (a) Arduino MEGA, (b) RPI Model B Arduino is an open source development board equipped
hardware. It can be booted via open source development software without any additional hardware. The board has an ATMega 2560 (Atmel, 2014) microprocessor and 54 numeric input/output ports. 15 of these ports can be used as pulse width modulation (PWM) at 8-bit resolution. In addition, there are 16 analog inputs at 10-bit resolution on the board. Furthermore, ATMega 2560 has 16 MHz crystal oscillator, USB and power input pot, 256 KB flash disk with an 8 KB booter and 8 KB SRAM. The circuit diagrams of open source hardware belonging to Arduino project can be accessed online on the official website (http://www.arduino.cc). A Java-based software is available on the project website for software development and board loading. C/C++ languages are used as a software development language.
Espressif System ESP8266 Wi-Fi module was used to send the data to the main station. This module has a low-cost 32-bit microprocessor. In addition, it has GPIO SPI/SDIO and I2C/UART and input/output connection ports on it, and it offers Internet connection with a low amount of energy (ESP8266 Datasheet, 2015).
Sensors
Sensors enable us to measure and analyze physical parameters and events by translating them to signals (Dargie ve Poellabauer, 2010). While some of these devices can only translate analog signals, some of them can translate digital signals. In the present study, DHT22 and SI7021 sensors, which emit digital signals by measuring relative humidity and temperature simultaneously, and DS18B20 sensor, which only measures temperature, were used. In addition, TMP36, LM35 and 10 Kohm thermistor, which measure temperature via analog signal emission, were used. Measurement sensitivity and accuracy rates were taken into account in the selection of these sensors.
Temperature sensors
The data were collected by three different digital sensors in this study. The first one is DS18B20 sensor (Maxim Integrated, San Jose, USA), and it can transmit numerous sensor data through a single cable. It measures temperature at between -55 °C and +125 °C, -10 °C and +85 °C, and at an accuracy of ± 0.5 °C. It was used to measure air and soil temperature in this study. Another sensor used for the measurement of air temperature is TMP36 (Analog Devices, Norwood, USA), and it can emit voltage signal in proportion to temperature. It measures temperature at between -40 °C and +125 °C and at an analog accuracy of ± 1 °C at 25 °C. It was designed to measure in °C by the producer. LM35 (Texas Instruments, Dallas, USA) was
used to measure ambient temperature. It can generate linearly changing voltage output based on different ambient temperatures in Kelvin, and measures temperature at between -55 °C and +150 °C and at an accuracy of ± 0.25 °C (LM35 Datasheet, 2016).
A thermistor is a sensor with negative temperature coefficient and operates based on resistance. Temperature is inversely proportional to resistance. Empirical proofs indicate that the thermistor curve used for temperature measurement is significantly consistent with Steinhart-Hart equation (Steinhart ve Hart, 1968).
1
𝑇= 𝐴 + 𝐵 𝑙𝑛(𝑅𝑡) + 𝐶 [𝑙𝑛(𝑅𝑡)]
3 (2)
In the equation above, T is temperature (Kelvin), Rt is thermistor resistance (ohm), and A, B and C are curve constants. The resistance, beta coefficient and temperature measurement range of the thermistor used in the present study are 10 Kohm ±1%, 3950 ±1% and -55 °C to +125 °C, respectively. Temperature values were converted using Equation 2.
Relative humidity sensors
DHT22 (Aosong Electronics Ltd., Guangzhou, China) sensor was used to measure air temperature and ambient relative humidity. It was observed that this sensor, which performs capacitive measurement, yielded reliable and stable results (Fisher ve Gould, 2012). It measures ambient relative humidity at between 0-100%, at a sensitivity of 0.1% and an accuracy of 2-5%. It measures temperature at between -40 °C and +80 °C, at an accuracy of ±0.5 °C and a sensitivity of 0.1 °C (DHT22 Datasheet). SI7021 (Silicon Laboratories Inc. Austin, USA) measures ambient relative humidity at between 0-100% and an accuracy of ±3% (maximum). It measures temperature at between -40 °C and +125 °C and at a maximum accuracy of ±0.4 °C (SI7021 Datasheet, 2015).
Calibration
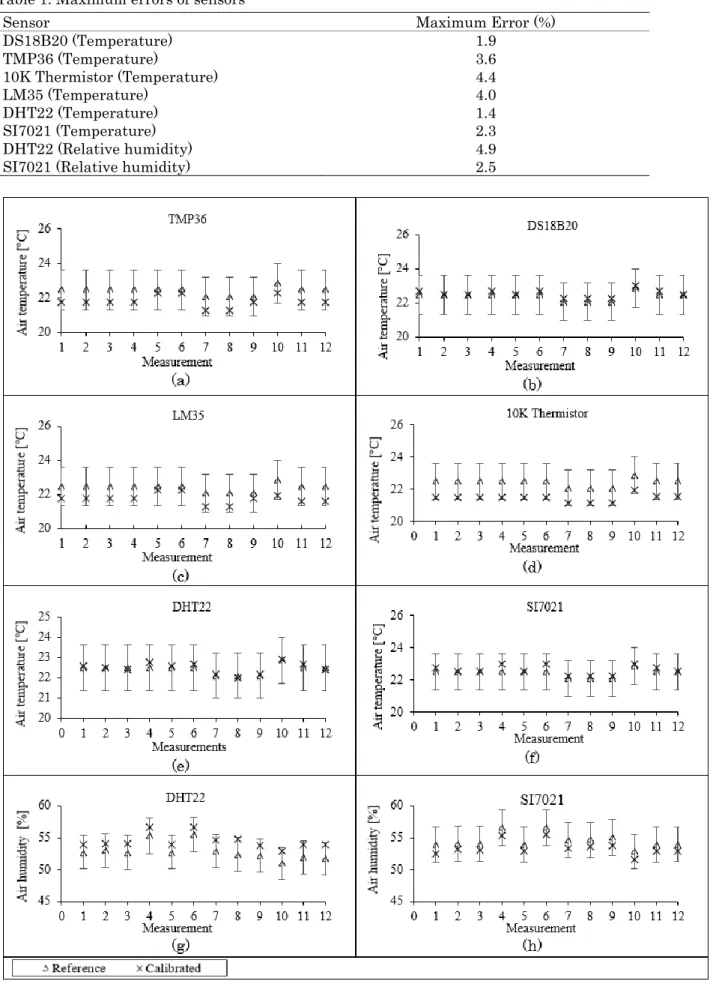
The calibration of sensors was performed by HOBO U12 data logger which can measure temperature at between -20 °C and +70 °C, at an accuracy of ±0.35 °C and a sensitivity of 0.01 °C and measure relative humidity at between 5-95% and an accuracy of ±2.5%. Ten measurement values were taken from the sensors in 10 minutes for calibration and their comparison with reference device is shown in Figure 4.
The maximum error for temperature measurement was the lowest for DHT22 sensor (1.4%) and highest for 10K thermistor (4.4%). The maximum error for relative humidity measurement was the lowest for SI7021 (2.5%) and highest for DHT22 sensor (4.9%). In addition, it was observed that none of the sensors exceeded 5% in terms of maximum error (Table 1).
Table 1. Maximum errors of sensors
Sensor Maximum Error (%)
DS18B20 (Temperature) 1.9 TMP36 (Temperature) 3.6 10K Thermistor (Temperature) 4.4 LM35 (Temperature) 4.0 DHT22 (Temperature) 1.4 SI7021 (Temperature) 2.3 DHT22 (Relative humidity) 4.9
SI7021 (Relative humidity) 2.5
Figure 4 Calibration graphs of sensors: (a) TMP36, (b) DS18B20, (c) LM35, (d) 10K thermistor, (e) DHT22 temperature, (f) SI7021 temperature, (g) DHT22 relative humidity, (h) SI7021 relative humidity
Software development
Java version 1.6.5 and C++ programming language were used to program Arduino development board. MySQL 5.1.7 database was used in order to store data on RPI board. The software designed to obtain data from sensors connected to RPI board in every 5 minutes and send those data to the database was
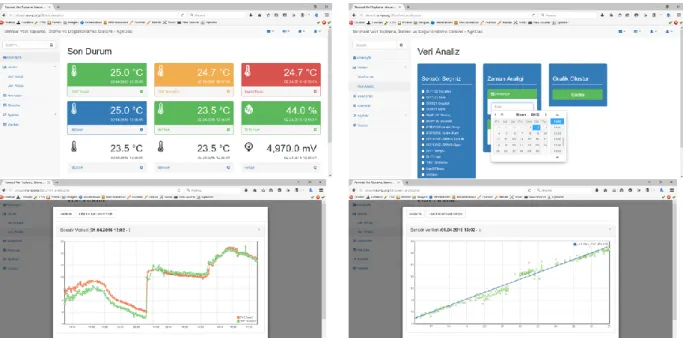
written using Python 2.7 programming language. The software designed to access data via Internet was written using PHP and Java script programming languages. Thus, the data taken from sensors and stored in the database were accessible via Internet. In addition, this software enables the user to access data any time and to create graphs for the analysis of relationships between sensors (Figure 5).
Figure 5 - Data monitoring and analysis software
Other modules
A data logging module (DataLogger Shield) was used on Arduino development board for temporal data references. DS1307 (Maxim Integrated, San Jose, USA) time module on this module is a low-power, full binary coded, decimal clock and calendar with a 56 KB memory. SD card (Secure Digital) was used to store back up data on Arduino development board. The data were logged in this card every 5 minutes along with time information in text csv (comma separated values) format.
The design of data acquisition devices
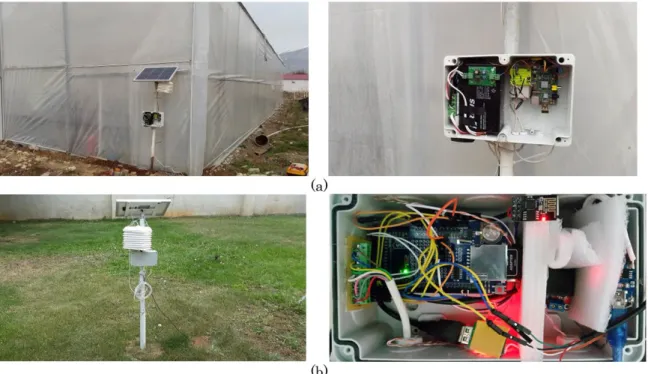
OSH-SRV consists of a RPI development board, a Wi-Fi module, an SD card with an operating system, and DHT22, DS18B20 and SI7021 digital sensors which measure temperature and relative humidity. Power was supplied by a 7000 mAh dry gel battery. A 20 W photovoltaic solar panel was used to charge the battery. Rasbian Jessie GNU/Linux was used as the
operating system. The data taken from the sensors connected to the digital ports of the card were logged in the database in every 5 minutes. Sensors were put in a protective shield that allows air flow in order to prevent exposure to direct sunlight (Figure 6(a)). OSH-Node consists of Arduino MEGA development board, ESP8266 Wi-Fi module, and integrated real time clock (RTC) and SD card module. Power was supplied by two pieces of 2600 mAh 18650 Li-On batteries. A 10 W photovoltaic solar panel was used to charge the batteries. Supporting analog input, this card was connected to TMP36, LM35 and 10K thermistor and DHT22 and DS18B20 digital sensors. Soil temperature was measured via DS18B20 sensors at a depth of 5, 10 and 20 cm (Figure 6(b)).
The costs of the designed system are given in Table 2 and 3. OSH-SRV and OSH-Node cost 76 and 55 US dollars, respectively. Total cost may vary depending on the number of sensors and additional equipment.
Figure 6 - Images of designed data acquisition system: (a) OSH-SRV, (b) OSH-Node Table 2. OSH-SRV circuit elements and costs
Elements Definition Cost ($)
Raspberry pi Development Board 30.0
Wi-Fi Module Wi-Fi Connection 5.6
8 GB SD card Operating system and data storage 3.4 DHT-22 Temperature and Relative Humidity Measurement 5.2 SI7021 Temperature and Relative Humidity Measurement 7.3
DS18B20 Temperature Measurement 1.2
20 W Solar Panel Battery Charging 14.5
7200 mAh Battery Power Supply 8.8
Table 3. OSH-Node circuit elements and costs
Elements Definition Cost ($)
Arduino MEGA Development Board 20.4
ESP8266 Wi-Fi Module Wi-Fi Connection 2.7
8 GB SD card Operating system and data storage 3.4 DHT-22 Temperature and Relative Humidity Measurement 5.2 SI7021 Temperature and Relative Humidity Measurement 7.3
DS18B20 Temperature Measurement 1.2
LM35 Temperature Measurement 1.5
TMP36 Temperature Measurement 1.5
10 K Thermistor Temperature Measurement 0.5
10 W Solar Panel Battery Charging 8.5
2600 mAh Battery Power Supply 2.8
The design of cloud-based alert system
A mobile alarming system was designed via cloud-based messaging system for greenhouse climate parameters. This system comprises of three components as OSH-SRV web software, Google Firebase cloud messaging infrastructure and a mobile application for Android operating system (Figure 7).
OSH-SRV web software operates on RPI. There are two types of users as administrator and standard in the web software. The standard user can view alarming messages and sensor values on the mobile device. On the other hand, the administrator is responsible for the definition of sensors (Figure 8), assigning users to the sensors and definitions of rules.
Figure 7 - OSH-SRV alert system
Figure 8 – Sensor definition screen
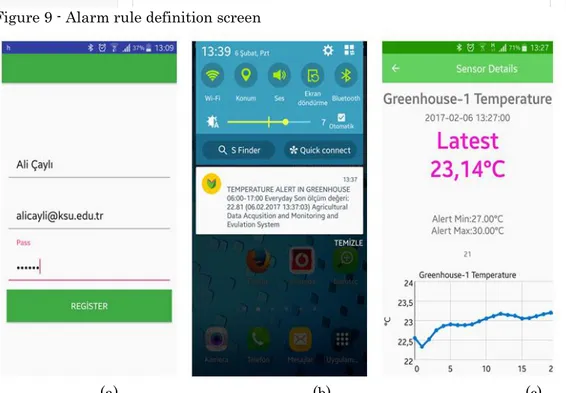
The application must be downloaded on OSH-SRV web server for registration in order to activate the standard user in the system. Name-surname, e-mail address and password are used during the registration. The relevant information is stored by a unique save key in the OSH-SRV database.
The user can create as many alarms as necessary for each sensor in the database interface. Maximum and
minimum values as well as text messages to be sent for these values and starting and ending times can be defined in the alarm rule. The alarm rule screen and variables are shown in Figure 9.
Google Firebase Cloud Messaging server, which is a developing and updated infrastructure, in order to offer services to more than one user and support the communication between components.
Figure 9 - Alarm rule definition screen
(a) (b) (c)
Figure 10 - (a) OSH-SRV mobile registration screen (b) alarm message (c) instant status monitoring The web application coded in php language after the
OSH-SRV server is connected to the Internet was operated via Nginx web server. OSH-Node, on the other hand, transferred data from the local network to the server through WiFi communication protocol. Data transfer was performed via HTTP protocol and POST method. JSON was preferred for data format (Figure 12a, 12b). Therefore, WiFi connection was operated in wlan1 AP (Access Point) and wlan0 STA (Station) modes on OSH-Node. Thanks to AP mode, the connections between OSH-Node and OSH-SRV and between STA mode and OSH-SRV to Internet were created. (Figure 11).
Figure 11 - OSH-SRV network diagram
The data were stored in OSH-SRV database. The communication between OSH-SRV and Android application was performed by FCM service. The sensor values were compared with the defined rules in the system. The system algorithm is shown Figure 13.
Figure 12 - (a) JSON data structure (b) a sample data package
Figure 13 - Cloud-based alert message algorithm
Figure 14 – The position of OSH-Node in the greenhouse The system was tested in the greenhouse located in the study field (Figure 14). The internal temperature and relative humidity values were measured for 30 days in order to determine the stability of the system.
Each cycle of the software for sensor monitoring lasts 5 seconds. Network Time Protocol (NTP) was used to synchronize time reference information. The synchronization was performed with an interval of 50
Δt = 𝑡𝑛+1− 𝑡 (3)
Here, Δt = time intervals, 𝑛 is nth data in the data series, and 𝑡 is the timestamp information. The calculate Δt values were evaluated in accordance with logical equations given in Equ
ation 4, 5 and 6 for three different intervals. For 1 minute-interval; ={ 𝑀𝑖𝑠𝑠𝑖𝑛𝑔 𝑑𝑎𝑡𝑎 𝑖𝑓 Δt > 65 𝐴𝑣𝑎𝑖𝑙𝑎𝑏𝑙𝑒 𝑑𝑎𝑡𝑎 𝑖𝑓 Δt ≤ 65 (4) For 5 minute-interval; ={ 𝑀𝑖𝑠𝑠𝑖𝑛𝑔 𝑑𝑎𝑡𝑎 𝑖𝑓 Δt > 305 𝐴𝑣𝑎𝑖𝑙𝑎𝑏𝑙𝑒 𝑑𝑎𝑡𝑎 𝑖𝑓 Δt ≤ 305 (5) For 15 minute-interval; ={ 𝑀𝑖𝑠𝑠𝑖𝑛𝑔 𝑑𝑎𝑡𝑎 𝑖𝑓 Δt > 905 𝐴𝑣𝑎𝑖𝑙𝑎𝑏𝑙𝑒 𝑑𝑎𝑡𝑎 𝑖𝑓 Δt ≤ 905 (6)
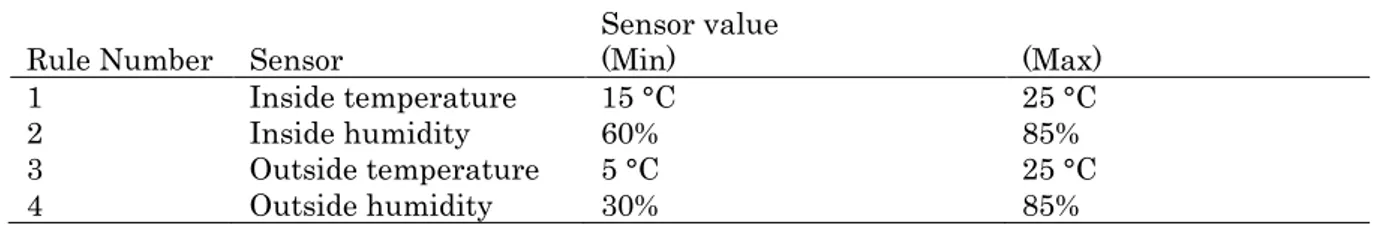
The measurement values in the sensors are compared with alarming rules defined in OSH-SRV web software and the system decides whether it will send a message. The alarming rules for temperature and relative humidity valid for the testing process are given in Table 4.
Table 4. The alarming rules
Rule Number Sensor Sensor value (Min) (Max)
1 Inside temperature 15 °C 25 °C
2 Inside humidity 60% 85%
3 Outside temperature 5 °C 25 °C
4 Outside humidity 30% 85%
If an alarming message is created, the measurement value is logged in the database via sensor id and timestamp, and the message is sent to the mobile devices via FCM infrastructure. The stability of creating alarming message is determined based on whether the alarm message is created when the measurement value exceeds rule value.
RESULTS and DISCUSSION
Low-cost sensors and development boards were compared to TFA weather station, which was selected as the reference device, in order to measure their capacity as a data acquisition and monitoring system. Sensors with the lowest maximum error rate were selected in this comparison. Sensor calibration findings demonstrate that the lowest and highest maximum error rates for temperature measurement belong to DHT22 (1.4%) and 10K thermistor (4.4%), respectively. On the other hand, the lowest maximum error rate for relative humidity measurement belongs to SI7021 sensor (2.5%).
A total of 288 data were obtained following the daily measurements performed in every 5 minutes. These data are shown in Figure 15, and the relationship between the data obtained from two devices was analyzed.
The difference between mean temperatures is 0.05 °C, and root mean square error (RMSE) was calculated as ±0.33 °C. The same value is 0.72% for relative
humidity, and root mean square error (RMSE) is ±1.92%.
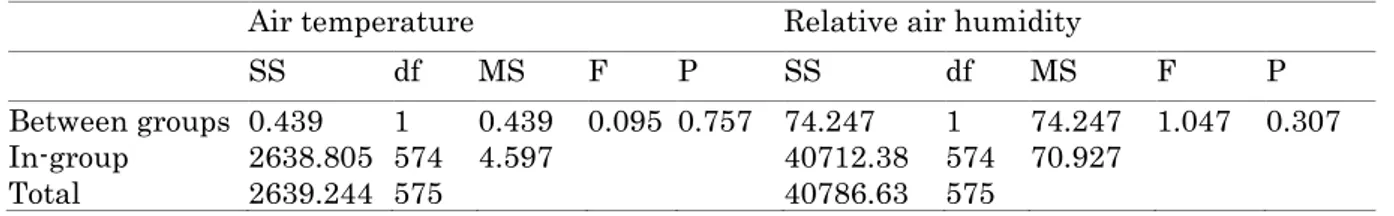
Mean air temperatures were calculated as 10.934 °C ±0.124 °C and 10.879 °C ±0.129 °C, respectively. The difference between two groups in terms of mean values was 0.0552 °C. Mean relative air humidity were calculated as 44.452% ±0.494% and 43.734% ±0.498%, respectively. The difference between two groups in terms of mean values was 0.072. The significance of difference between two groups in terms of mean values was tested via Z-test, and it was found out that the difference between mean values was statistically insignificant (P>0,05). This finding suggests that the performance of the designed system is similar to the reference device. One-way analysis of variance (ANOVA) was performed as a supporting analysis and its results are given in Table 5.
Table 5 indicates that F value is 0.095 for air temperature and 1.047 for relative air humidity. The tabular value at a degree of freedom of 1-576 and at the level of type I error is (F1,576, 0,05=3,86), demonstrating that the variance between groups is statistically significant for both measurement values and that the mean values are the same (P>0,05). Therefore, the difference between the data obtained from two systems is insignificant. These findings suggest that the climatic values obtained from the designed data acquisition system can be safely used.
Figure 15 - Hourly mean temperature and relative humidity measurement values Table 5. One-way analysis of variance results for temperature measurement
Air temperature Relative air humidity
SS df MS F P SS df MS F P
Between groups 0.439 1 0.439 0.095 0.757 74.247 1 74.247 1.047 0.307 In-group 2638.805 574 4.597 40712.38 574 70.927
Total 2639.244 575 40786.63 575
Case study: Cloud-based alert system
The data obtained during the testing process are shown in Figure 16. Some missing data can be noted in the graphs at short intervals, which results from a power cut and insufficient charging in the batteries due to the cloudy weather. If the energy of the system is supplied by an electric adapter as well as solar panels, it will be possible to eliminate the negative
effects of power cuts.
The daily expected and actual number of sensor measurement data at an interval of 1, 5 and 15 minutes are given in Table 6. The success rates of sensor measurement were 95.8%, 98.3% and 99.6%, respectively. The highest data transfer success was obtained during sensor measurement at an interval of 15 minutes.
Table 6. The sensor measurement performance of the system
Interval Available data Missing data Normally required (for 24 hours) Missing data ratio (%)
1 min 1380 60 1440 4.2
5 min 264 24 288 1.7
15 min 90 6 96 0.4
In addition, whether the system created an alarming message when the measurements reach the maximum and minimum values for the defined alarming rules was also tested. It was observed that the system created an alarming message for all measurements exceeding maximum and minimum rule values, which indicates that the system is stabilized in terms of
CONCLUSION
In this study, a low-cost data acquisition and monitoring system was developed via open source hardware and software for agricultural practices. The designed system can be used as a decision support system in many important agricultural practices such as the determination of irrigation schedule, plant 0 2 4 6 8 10 12 14 16 20:00 00:00 04:00 08:00 12:00 16:00 T emp er at u re [ °C] Hour (h)
Air temperature measurements
Reference OSH-SRV 0 10 20 30 40 50 60 70 20:00 00:00 04:00 08:00 12:00 16:00 R el at iv e H u mi d it y [ %] Hour (h)
Relative air humidity measurements
Reference OSH-SRV
stress and monitoring of climatic data in a greenhouse. In addition, the system can be converted to an automation control system with additional modules. Professional systems used for these purposes are costly and do not offer sufficient flexibility. However, the system designed in this study is quite flexible and scalable. It can be used for different agricultural practices with additional sensors. Furthermore, the
data can be constantly accessed on web pages, and the results can be quickly viewed following the data analysis of the system.
In recent years, the development and use of electronic boards have increased rapidly thanks to open source hardware. These systems may offer various advantages in terms of easier data collection, monitoring and analysis in agricultural practices.
(a)
(b)
(c)
(d)
Figure 16. OSH-Node climate data a) internal temperature, (b) internal relative humidity, (c) external temperature, (d) external relative humidity
-10 0 10 20 30 40 50 T emp er at u re [ °C] Hours (h)
Measured Temp Rule #1 Min Rule #1 Max
0 20 40 60 80 100 R el at iv e H u mi d it y [ %] Hours (h)
Measured Hum Rule #2 Min Rule #2 Max
-10 0 10 20 30 T emp er at ur e [º C ] Hours (h)
Measured Temp Rule #3 Min Rule #3 Max
0 20 40 60 80 100 R el at iv e H u mi d it y [ %] Hours (h)
REFERENCES
Buechley L, Eisenberg M (2008). The LilyPad Arduino: Toward Wearable Engineering for Everyone. IEEE
Pervasive Computing, 7, 12-15. doi:
10.1109/MPRV.2008.38
Dargie W, Poellabauer C (2010). Fundamentals of Wireless Sensor Networks. doi: 10.1002/9780470666388
Dedrick RR, Halfman JD, Brooks McKinney D (2000). An inexpensive, microprocessor-based, data logging system. Computers and Geosciences, 26, 1059-1066. doi: 10.1016/S0098-3004(00)00020-0
ESP8266 Datasheet E (2015). ESP8266EX Datasheet. Espressif Systems Datasheet, 1-31.
Faugel H, Bobkov V (2013). Open source hard- and software: Using Arduino boards to keep old hardware running. Fusion Engineering and Design,
88, 1276-1279. doi:
DOI:101016/jfusengdes201212005
Fisher DK, Gould PJ (2012). Open-Source Hardware Is a Low-Cost Alternative for Scientific Instrumentation and Research. Modern
Instrumentation, 1, 8-20. doi:
10.4236/mi.2012.12002
Fisher DK, Kebede H (2010). A low-cost microcontroller-based system to monitor crop temperature and water status. Computers and Electronics in Agriculture, 74, 168-173. doi: 10.1016/j.compag.2010.07.006
Gomaa R, Adly I, Sharshar K, Safwat A, Ragai H. (2013). ZigBee wireless sensor network for radiation monitoring at nuclear facilities. Wireless and Mobile Networking Conference (WMNC), 2013 6th Joint IFIP. Gordon D, Beigl M, Neumann MA. (2010). Dinam: A wireless sensor network concept and platform for rapid development. Networked Sensing Systems (INSS), 2010 Seventh International Conference on. Gubbi J, Buyya R, Marusic S, Palaniswami M (2013). Internet of Things (IoT): A vision, architectural elements, and future directions. Future Generation Computer Systems, 29, 1645-1660. doi: 10.1016/j.future.2013.01.010
Hicks SD, Aufdenkampe AK, Montgomery DS (2011). Sensor Networks, Dataloggers, and Other Handy Gadgets Using Open-Source Electronics for the Christina River Basin CZO. AGU Fall Meeting Abstracts.
Koenka IJ, Saiz J, Hauser PC (2014). Instrumentino: An open-source modular Python framework for controlling Arduino based experimental instruments. Computer Physics Communications, 185, 2724-2729. doi: 10.1016/j.cpc.2014.06.007 Kornuta JA, Nipper ME, Brandon Dixon J (2013).
Low-cost microcontroller platform for studying lymphatic biomechanics in vitro. Journal of
Biomechanics, 46, 183-186. doi:
LM35 Datasheet L (2016). LM35 Precision Centigrade Temperature Sensors (Rev. G). Texas Instruments. Mai TD, Pham TTT, Pham HV, Sáiz J, Ruiz CG,
Hauser PC (2013). Portable Capillary Electrophoresis Instrument with Automated Injector and Contactless Conductivity Detection. Analytical Chemistry, 85, 2333-2339. doi: 10.1021/ac303328g
Mesas-Carrascosa FJ, Verdú Santano D, Meroño JE, Sánchez de la Orden M, García-Ferrer A (2015). Open source hardware to monitor environmental parameters in precision agriculture. Biosystems
engineering, 137, 73-83. doi:
10.1016/j.biosystemseng.2015.07.005
Pi R. (2016). Raspberry Pi Documentation. Retrieved
30.11.2016, from
https://www.raspberrypi.org/documentation/ Polo J, Hornero G, Duijneveld C, García A, Casas O
(2015). Design of a low-cost Wireless Sensor Network with UAV mobile node for agricultural applications. Computers and Electronics in
Agriculture, 119, 19-32. doi:
10.1016/j.compag.2015.09.024
Riley TC, Endreny TA, Halfman JD (2006). Monitoring soil moisture and water table height with a low-cost data logger. Computers and Geosciences, 32, 135-140. doi: 10.1016/j.cageo.2005.05.009
Sáiz J, Mai TD, Hauser PC, Garcia-Ruiz C (2013). Determination of nitrogen mustard degradation products in water samples using a portable capillary electrophoresis instrument.
Electrophoresis, 34, 2078-2084. doi:
10.1002/elps.201300054
Sáiz J, Mai TD, López MaL, Bartolomé C, Hauser PC, Garcia-Ruiz C (2013). Rapid determination of scopolamine in evidence of recreational and predatory use. Science & Justice, 53, 409-414. doi: 10.1016/j.scijus.2013.08.001
Sethi VP, Sumathy K, Lee C, Pal DS (2013). Thermal modeling aspects of solar greenhouse microclimate control: A review on heating technologies. Solar
Energy, 96, 56-82. doi:
10.1016/j.solener.2013.06.034
SI7021 Datasheet S (2015). Si7021-A20 I2C Humidity and Temperature Sensor. Silicon Laboratories, 1-36.
Stallman RM, Gay J (2009). Free Software, Free Society: Selected Essays of Richard M. Stallman. Steinhart JS, Hart SR (1968). Calibration curves for
thermistors. Deep Sea Research and Oceanographic Abstracts, 15, 497-503. doi: 10.1016/0011-7471(68)90057-0
Thomson KE, White HS (2014). A novel open-source drug-delivery system that allows for first-of-kind simulation of nonadherence to pharmacological interventions in animal disease models. Journal of Neuroscience Methods, 238, 105-111. doi:
Von Zabeltitz C (2011). Integrated Greenhouse Systems for Mild Climates: Climate Conditions, Design, Construction, Maintenance, Climate Control. Integrated Greenhouse Systems for Mild
Climates: Climate Conditions, Design,
Construction, Maintenance, Climate Control, 285-311. doi: 10.1007/978-3-642-14582-7_12
Zhang J, Ong SK, Nee AYC. (2009). Design and Development of a Navigation Assistance System for Visually Impaired Individuals. Proceedings of the 3rd International Convention on Rehabilitation Engineering & Assistive Technology. New York, NY, USA: ACM.