A COMPARATIVE STUDY ON INDOOR SOUNDSCAPE
IN MUSEUM ENVIRONMENTS
A Master’s Thesis by CEMRE ORHAN Department ofInterior Architecture and Environmental Design İhsan Doğramacı Bilkent University
Ankara July 2019
To my lovely parents, Öznur and Fazıl Orhan
A COMPARATIVE STUDY ON INDOOR SOUNDSCAPES
IN MUSEUM ENVIRONMENTS
The Graduate School of Economics and Social Sciences of
İhsan Doğramacı Bilkent University
by
CEMRE ORHAN
In Partial Fulfillment of the Requirements for the Degree of MASTER OF FINE ARTS
THE DEPARTMENT OF
INTERIOR ARCHITECTURE AND ENVIRONMENTAL DESIGN İHSAN DOĞRAMACI BILKENT UNIVERSITY
ANKARA
iii
ABSTRACT
A COMPARATIVE STUDY ON INDOOR SOUNDSCAPES
IN MUSEUM ENVIRONMENTS
Orhan, Cemre
MFA., Interior Architecture and Environmental Design Supervisor: Assist. Prof. Dr. Semiha Yılmazer
July, 2019
The aim of this study is to understand how visitors perceive and compare the soundscapes of different museum environments. To reach this goal, physical parameters as acoustic measurements, and perceptual data as questionnaires and interviews were explored in Rahmi M. Koç Museum, and Erimtan
Archaeology and Arts Museum. Both museums are located near the main gate of Ankara Castle, which is one of the most historic and cultural part of the city. To find out the acoustical parameters of the case study settings, Equivalent Continuous A-weighted Sound Level (LAeq) was measured in-situ with Bruel & Kjaer 2230 sound level meter, and Speech Transmission Index (STI) and Reverberation Time (T30) were measured with the Odeon Room Acoustics Software 13.01. For the perceptual data, the questionnaires were analyzed by using SPSS program. Interviews were analyzed with the Grounded Theory (GT) method to explore the visitors’ perception towards the indoor soundscapes of
iv
museum environments. After analyzing the data of interviews, the conceptual framework was created. This process was completed with the ATLAS.ti Software. Results showed that the soundscapes of the indoor environment cannot be explored only with physical parameters. Results showed that visitors’ perception of soundscape changes according to the theme of the museums, and visitors’ preference of sound environment changes according to the building types.
Keywords: Auditory Perception, Conceptual Framework, Grounded Theory, Indoor Soundscapes, Museum Environment
v
ÖZET
MÜZELERDE İŞİTSEL PEYZAJ ÜZERİNE
KARŞILAŞTIRMALI BİR ÇALIŞMA
Orhan, Cemre
İç Mimarlık ve Çevre Tasarımı Yüksek Lisans Programı Tez Yöneticisi: Dr. Öğr. Üyesi Semiha Yılmazer
Temmuz, 2019
Bu çalışmanın amacı, ziyaretçilerin farklı müze ortamlarının işitsel peyzajını nasıl algıladıklarını anlamak ve aynı bağlamdaki mekânların işitsel peyzajlarını karşılaştırmaktır. Bu amaca ulaşmak için Rahmi M. Koç Müzesi’nde ve Erimtan Arkeoloji ve Sanat Müzesi’nde objektif ölçümler ve sübjektif araştırmalar
yapılmıştır. Her iki müze de, kentin en tarihi ve kültürel kısmı olan Ankara Kalesi'nin ana kapısının yanında yer almaktadır. Akustik parametreleri bulmak için ses seviyeleri (LAeq) mekânların içinde ölçülürken, çınlama süresi (T30) ve konuşma iletim indeksi (STI) Odeon Room Acoustics 13.01 yazılımı ile
ölçülmüştür. Sübjektif verilerden anketler (n=60) SPSS programı kullanılarak analiz edilirken görüşmeler (n=13) Köklenmiş Teori metoduyla analiz edilmiştir. Görüşmelerin verileri analiz edildikten sonra kavramsal sistem oluşturulmuştur. Bu işlem ATLAS.ti yazılımı ile tamamlanmıştır. Sonuçlar, bir mekânın işitsel peyzajının yalnızca fiziksel parametrelerle değerlendirilemeyeceğini göstermiştir. Mekânlar aynı bağlamda olsa da ziyaretçilerin iç mekân işitsel peyzaj algılarının
vi
sergi temalarına göre değiştiği ve ses ortamı tercihlerinin bina çeşidine göre değiştiği görülmüştür.
Anahtar Kelimeler: İç Mekân İşitsel Peyzaj, İşitsel Algı, Köklenmiş Teori, Kavramsal Sistem, Müze Ortamı
vii
ACKNOWLEDGEMENTS
I would like to thank Assist. Prof. Dr. Semiha Yılmazer for her guidance,
throughout this study. She has supported me not only in completing this thesis but also in my academic and social life. Thanks to her wisdom I have completed this work.
I would like to thank the examining committee members, Assist. Prof. Dr. Çağrı İmamoğlu and Prof. Dr. Arzu Gönenç Sorguç for their valuable comments and contributions.
I am especially grateful to Volkan Acun for guiding me during the thesis writing process, and to Sıla Çankaya for her supports in statistical analyses.
My dear friend Samah Obeid she has always supported and motivated me in my most difficult times. The best thing that earned me the thesis was her friendship.
I would like to thank Anıl Berk Atalar for making me smile in my most difficult times and taking on every problem with me. Without his support, this thesis would not have been completed successfully.
I would like to express my sincere gratitude to my mother Öznur Orhan, and my father Fazıl Orhan. I have always been proud and honored to be their daughter. My dear siblings Zeynep and Mehmet Emin Orhan, who have always supported me with their love, having you is the biggest chance in my life. Lastly, I would like to thank all my big and beautiful family for being always with me.
viii
TABLE OF CONTENTS
ABSTRACT ... iii
ÖZET ... v
ACKNOWLEDGEMENTS ... vii
TABLE OF CONTENTS ... viii
LIST OF TABLES ... x
LIST OF FIGURES ... xi
CHAPTER I INTRODUCTION ... 1
1.1 Aim and Scope ... 4
1.2 Structure of the Thesis ... 5
CHAPTER II LITERATURE REVIEW ... 7
2.1 Soundscapes ... 7
2.2.1 Previous Studies on Indoor Soundscapes ... 12
2.1.2 ISO/TS 12913-2:2018 Acoustics-Soundscapes and Soundscapes Evaluation Methods ... 21
2.1.2.1 Evaluation of Physical Parameters ... 22
2.1.2.2 Grounded Theory Method ... 25
2.1.2.3 Evaluation of Perceptual Data ... 27
2.2 Museum Environments and Classifications ... 32
2.2.1 Museum Buildings and Architecture ... 34
ix
CHAPTER III METHOD ... 39
3.1 Design of the Study ... 39
3.1.1 Research Questions ... 40
3.2 Method ... 40
3.2.1 The Site ... 40
3.2.2 Participants ... 48
3.2.3 Acoustic Environment ... 49
3.2.4 Measurement of Physical Parameters ... 52
3.2.5 Perceptual Data Collection and Grounded Theory Method ... 56
3.2.5.1 Interview Method ... 56
3.2.5.2 Questionnaire Method ... 59
CHAPTER IV RESULTS ... 61
4.1 Physical Parameters ... 61
4.1.1 Equivalent Continuous A-Weighted Sound Level (LAeq) ... 61
4.1.2 Reverberation Time (T30) and Speech Transmission Index (STI) .... 62
4.2 Perceptual Data and Grounded Theory Method ... 64
4.2.1 Interview Results ... 64
4.2.2 Questionnaire Results ... 77
4.2.2.1 Independent Samples T-Test ... 78
4.2.2.2 Spearman’s Rho Correlation Coefficient ... 80
CHAPTER V DISCUSSION ... 85
5.1 Comparison of Methods towards the Built Environment ... 85
5.2 Comparison of Methods towards the Auditory Environment ... 87
CHAPTER VI CONCLUSION... 93 REFERENCES ... 97 APPENDICES ... 104 APPENDIX A ... 105 APPENDIX B ... 107 APPENDIX C ... 111
x
LIST OF TABLES
Table 1. Speech Transmission Index (STI) ... 25 Table 2. The categorization of the spaces in the museum environments ... 37 Table 3. Sound sources in Museum RMK and Museum EAA ... 51 Table 4. Results of LAeq measurements in Museum RMK and Museum EAA . 62 Table 5. Speech Transmission Index (STI) ratings of the museums ... 64 Table 6. A table showing the visitors’ socio-demographic characteristics ... 77 Table 7. Significant difference in the evaluation of preference and physical environment factors ... 79 Table 8. Items that have significant correlations with visitors' expectations of physical environment ... 81 Table 9. Items that have significant correlations with visitors' expectations of auditory environment ... 82 Table 10. Items that have significant correlation with disturbing sound
environment ... 83 Table 11. Items that have significant correlations in both museums ... 84
xi
LIST OF FIGURES
Figure 1. Taxonomy of sound sources according to different places ... 10
Figure 2. Soundscapes Framework created by ISO12913-1 ... 11
Figure 3. Reverberation time according to the different functional spaces ... 24
Figure 4. Collection and analysis of the Grounded Theory data ... 26
Figure 5. Four main parts suggested for questionnaire method ... 28
Figure 6. Three main parts suggested for soundwalk method ... 30
Figure 7. Jean Nicolas Louis Durand’s museum plan layout ... 35
Figure 8. Karl Friedrich Schinkel’s Altes Museum plan layout... 35
Figure 9. Location of the museums ... 42
Figure 10. View of museums from the southern entrance of Ankara Castle ... 42
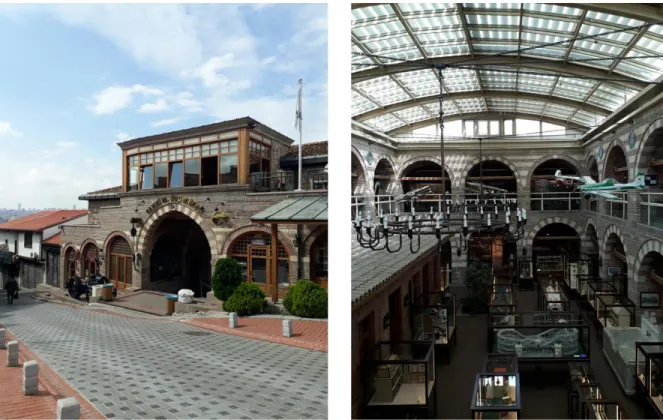
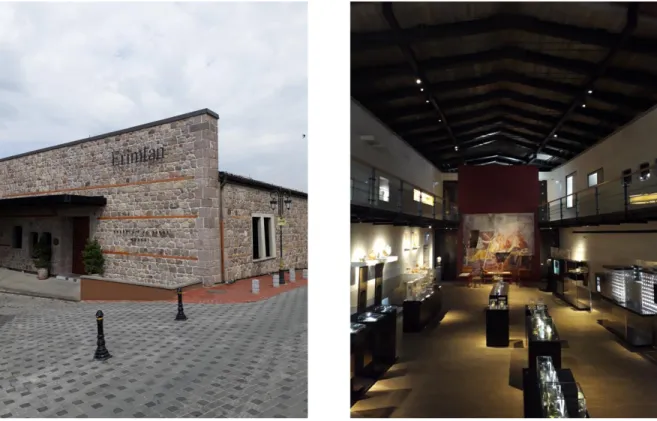
Figure 11. Views from outside and inner courtyard of Rahmi M. Koç Museum . 45 Figure 12. Views of exhibited objects and exhibition areas in Rahmi M. Koç Museum ... 45
Figure 13. Views from outside and interior of Erimtan Archaeology and Arts Museum ... 47
Figure 14. Views of exhibited objects and exhibition areas in Erimtan Archaeology and Arts Museum ... 47
xii
Figure 15. Locations of sound level meter during the in-situ measurement in
Museum RMK ... 53
Figure 16. Locations of sound level meter during the in-situ measurement in Museum EAA ... 53
Figure 17. Locations of the sound sources and receivers in Museum RMK ... 55
Figure 18. Locations of the sound sources and receivers in Museum EAA ... 55
Figure 19. Reverberation Times (T30) in Museum RMK and Museum EAA ... 63
Figure 20. Coding Process ... 67
Figure 21. The basic of conceptual framework for high-school environment .... 68
Figure 22. The detailed conceptual framework for the museum environment ... 76
Figure A.1. Interview questions both in Turkish and English ... 106
Figure B.1. Sound Environment Perception questionnaire both in Turkish and English ... 110
Figure C.1. A clustered bar chart showing the frequency distribution of preference of historical building type ... 111
Figure C.2. A clustered bar chart showing the frequency distribution of preference of building type as modern regarding the theme of exhibition ... 111
Figure C.3. A clustered bar chart showing the frequency distribution of lighting quality ... 112
Figure C.4. A clustered bar chart showing the frequency distribution of difficulty of wayfinding ... 112
1
CHAPTER I
INTRODUCTION
Museums are important cultural environments as they emphasize the purpose of collection, education, and recreation of history. Acoustical studies in the
museum environments mostly focused on the physical parameters of an acoustic environment (Sala and Gallo, 2007; Carvalho et al. 2013) and
prevention ways from the noisy environments in existing literature (Fry, 2002).
It is important to provide proper acoustic conditions in museum environments for a quality museum experience (Fry, 2002). First of all, the geometry of the
exhibition halls, materials, and the way these spaces are used, can cause high reverberation easily in museum environments (Carvalho et al., 2013).
Respectively, it creates lack of speech intelligibility and echoes which is very annoying for visitors and guided tours (Fry, 2002; Carvalho et al., 2003). Speech intelligibility, reverberation time, and background noise levels were analyzed in the previous studies to clarify the acoustical conditions of the museums (Sala & Gallo, 2007; Carvalho et al. 2013; Acun, Yilmazer, & Orhan 2018; Yilmazer &
2
Orhan, 2019). A previous study by Carvalho et al. (2013) proved that, compared with old museum, reverberation time is higher in modern museums due to the large room volumes, high ceilings, and highly reflective surfaces.
However, when it comes to the perception of the sound environments, these physical parameters alone are not enough (ISO 2014; Zhang, Zhang, Liu, & Kang, 2016; Kang & Fortkamp, 2017). To understand the perception of sound environment, individuals’ subjective responses should also be examined. In this respect, context is the most important aspect of the soundscapes approach, since it has a huge impact on auditory perception, interpretation of auditory perception, responses and outcomes of people towards acoustic environments (ISO, 2014).
In the scope of the soundscapes studies, individuals’ perceptions towards the different environments are examined. Brown, Kang, and Gjestland created taxonomy of sound sources in 2011, which showed that the sound sources in outdoor spaces are considered the same with the indoor spaces. However, the soundscapes studies mostly considered outdoor spaces (Aletta & Astofoli, 2018). As Dökmeci and Yilmazer (2014) claimed, due to different geometries, finishing materials, movement, and reverberation of the indoor spaces, there should be more studies conducted in different types of indoor spaces.
Even though the studies on indoor soundscapes have increased in the last decade, there is still limited variety of the indoor areas (Okcu, Ryherd, Zimring, & Samuels, 2011; Mackrill, Cain, & Jennings, 2013; Dökmeci & Kang, 2012;
3
Bora, 2014; Cankaya & Yilmazer, 2016; Yilmazer & Acun, 2018; Acun & Yilmazer, 2018; Acun & Yilmazer, 2018; Acun et al., 2018; Yilmazer & Orhan, 2019). Although the museum environment was analyzed in terms of
soundscapes approach, there is no comparative study which would give much more details about the field in the literature.
The proper acoustic parameters in the museum environments provide visitors with quality and unique museum experience that improve attention,
concentration, and complete the mission of education, study, and enjoyment of museums. It is important to understand how effective the soundscapes is on visitors’ experience in museums. To accomplish that, this thesis provides readers with the measurements of the physical parameters and evaluation of perceptual data with their comparison and correlation in two different museums; Rahmi M. Koç Museum and Erimtan Archaeology and Arts Museum.
These museums are located in the most cultural part of Ankara. The Rahmi M. Koç Museum, where the building type and theme of the exhibition are historical, is compared with the Erimtan Archaeology and Arts Museum, where the building type is modern but the theme of the exhibition is historical. These two museums were chosen to compare people’s perception of soundscapes towards spaces with the same context.
4
1.1 Aim and Scope
As it was emphasized before, museums’ aim of collection, education, and enjoyment can be supported with the proper acoustical environment; thus, visitors could have unique experience. In this respect, studies about the
museum acoustics mostly focused on the measurements of physical parameters of acoustical conditions. However, museum environments need to be evaluated with the soundscapes approach by integrating the physical measurements and the perceptual data. When the acoustic analyses of the museum environment are integrated with the individuals’ subjective and perceptual responses, the opportunity of understanding the soundscapes of museum environments would occur.
This study aimed to clarify how the visitors’ perception of soundscapes changes according to the theme of the exhibitions, and to investigate the effect of
perceived sound environment on visitors’ preferences towards the built environment. It also adds to the literature as a case study on indoor
soundscapes approach and a unique attitude in terms of comparing two spaces having the same context.
In order to accomplish the objectives; the physical parameters of the case study
settings were measured. Equivalent Continuous A-weighted Sound Level (LAeq)
was measured as in-situ with Bruel & Kjaer 2230 sound level meter; Speech Transmission Index (STI) and Reverberation Time (T30) were measured with the Odeon Room Acoustics Software 13.01. In the scope of the perceptual data, the interview was evaluated with Grounded Theory (GT) method and analyzed
5
with ATLAS.ti Software; the questionnaire was analyzed by using SPSS program. The comparison of the physical parameters and the perceptual data provided broad information about the visitors’ perception of soundscapes towards the museum environments.
1.2 Structure of the Thesis
The thesis consists of six chapters. The first chapter is “Introduction”, which gives general information about the soundscapes approach and importance of the study. Then, the aims of the study and structure of the thesis are given respectively.
The second chapter is “Literature Review”. It gives background information about the soundscapes, previous indoor soundscapes studies and museum acoustics studies; and methods of soundscapes evaluation which covers details of the evaluation of physical parameters, Grounded Theory method, and
evaluation of perceptual data. It also includes background information about the museums, their classifications, architecture, and acoustics.
The third chapter is “Method”. The chapter begins by giving information about the design of the study and presents the research questions. Then, it gets more into detail by giving information about the site, participants, and acoustic
environments in each museum. The measurement procedure of the physical parameters, perceptual data collection, and Grounded Theory method are given.
The fourth chapter is “Results”. It consists of three main sections as physical parameters, perceptual data, and Grounded Theory method. Objective results
6
show the measurement of acoustical parameters of the museums as equivalent continuous a-weighted sound level (LAeq), reverberation time (T30) and speech transmission index (STI). Subjective results show the evaluation of interviews and questionnaire.
The fifth chapter is “Discussion”. In this chapter, the results of the study are compared with each other and with the previous studies. The results are
discussed by considering the differences of physical parameters and perceptual data in two museums.
The sixth chapter is “Conclusion”. The study ends with this chapter. It
summarizes the whole study illatively. Recommendations for future studies are also given in this study.
7
CHAPTER II
LITERATURE REVIEW
2.1 Soundscapes
The term soundscapes was first introduced by a musician R. Murray Schaffer who was very concerned about the relationships between the ear, human beings and acoustic environment (Schafer, 1977). In 1969, he created the World
Soundscapes Project (WSP) which aimed to provide a balance between human community and its sonic environment (Westerkamp et al. 2006; Kang et al., 2016). WSP pioneered many important studies such as The Vancouver Soundscapes, The Tuning of the World, and Handbook for Acoustic Ecology.
Schaffer introduced sound typology including three different categories as keynote sounds, signals, and soundmarks (Schaffer, 1977). Keynote sounds refer to omnipresent and prevalent sound and are accepted as background sounds. Signals are known as foreground sounds and include the acoustic
8
warning devices for encoding certain messages or information (Westerkamp et al. 2006). Finally, soundmarks are specific to a certain place and make the acoustic environment unique (Schafer, 1977; Westerkamp et al. 2006; Ozcevik & Can, 2008).
The typology of sounds gives a lot of information about the local environments’ soundscapes (Wrightson, 1999). Because of the industrial revolution, unique sounds get masked by louder mechanical sounds (Acun, 2015; Ozcevik & Can, 2008). In 2002, it was proved that more than 30% of EU citizens fell into noise level more than what is specified by World Health Organization (COST, 2013). Since this situation has a negative impact on human health and daily life, an increasing number of complaints remained, a new action called “quiet areas” was emerged with the publication of the EU Directive Relating to the
Assessment and Management of Environmental Noise (END). This action aimed to protect special soundscapes that provide “quietness” by initially focusing on reducing the sound level. As it was seen in other regulations, END also clarified that reducing sound levels alone was not enough for life quality and people satisfaction (COST, 2013). It was also seen that not only the sound source, but also the entire sound environment should be considered to achieve their goals.
Soundscapes is an interdisciplinary approach. With the emergence of END, the number of soundscapes studies increased rapidly in Europe and elsewhere separately. This separation caused unorganized and complicated studies. In 2009, COST Action Soundscapes of European Cities and Landscapes was emerged to harmonize soundscapes studies from all over the world. COST
9
Action brought lots of studies and researchers from different disciplines together and helped them collaborate (COST, 2013). COST Action TD0804 (2009–2013) claimed the aim of the COST Action as;
“To provide the underpinning science for soundscapes research and make the field go significantly beyond the current state-of-the-art, through coordinated international and interdisciplinary efforts. The Action will promote soundscapes into current legislations, policies and practice, aiming at improving/preserving our sonic environment.”
However, there was still no certainty of definition and evaluation methods of soundscapes. Even though in many studies the surrounding sounds were
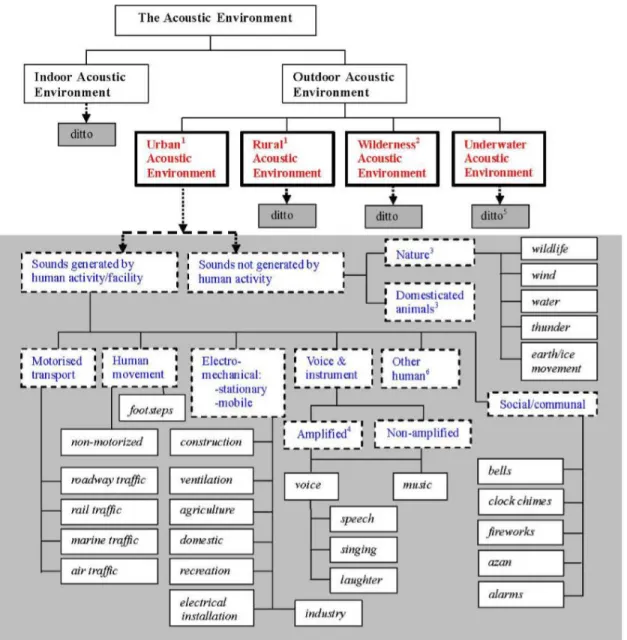
defined as “perceived soundscapes”, the sound sources found in different sound environments were not categorized (Brown et al., 2011). Thereupon, in 2011; Brown, Kang, and Gjestland created possible taxonomy, which classifies the sound sources in different acoustic environments (Figure 1). The taxonomy shows that the acoustic environment is divided into two main categories as indoor and outdoor. Outdoor acoustic environment has four subcategories as urban, rural, wilderness, and underwater. And the framework supposes that all principles that connect to the outdoor acoustic environment are same for the indoor acoustic environment.
10
Figure 1. Taxonomy of sound sources according to different places
Researchers explained the term soundscapes as “how the environment is perceived by a listener” for a long time (Porteous and Mastin 1985; Truax 1999; Gage et al. 2004; Yang and Kang 2005; Kang 2006; Schafer, 1988;
Westerkamp, 2006). In 2009, studies about developing ISO Standard on the soundscapes studies began and introducing a definition of “soundscapes” was a priority (Kang & Schulte-Fortkamp, 2017). The International Organization for
11
Standardization provided the definition of soundscapes and a conceptual framework. According to that, soundscapes is “the acoustic environment
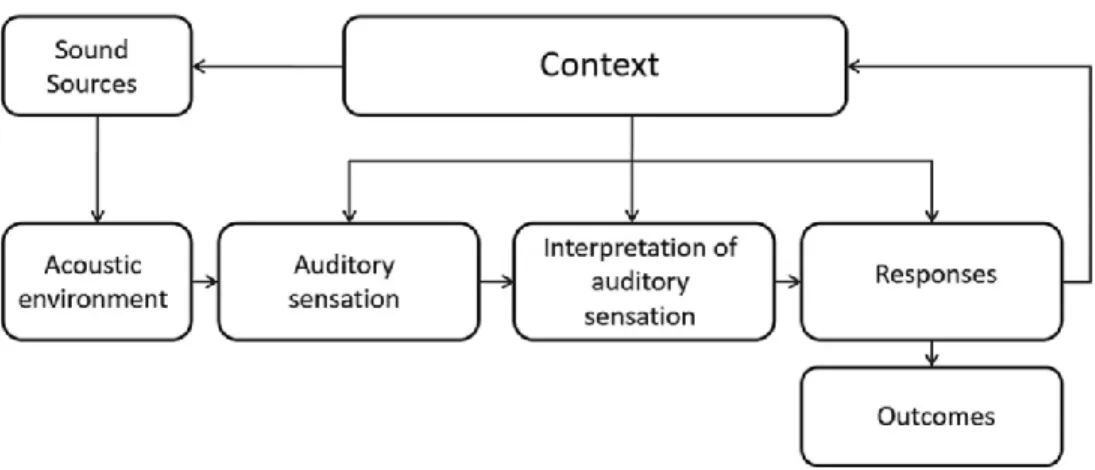
perceived or experienced and/or understood by a person or people, in context” (ISO 2014). It means that soundscapes exist through human perception. The framework explains the process of perceiving and experiencing the
soundscapes with the seven concepts and their connections (Figure 2). These concepts are; context, sound sources, acoustic environment, auditory sensation, interpretation of the auditory sensation, responses and outcomes (ISO, 2014). The framework accepts the context as a main aspect. Sound sources include soundscapes and acoustic environment. The soundscapes is affected by context by the means of auditory sensation, interpretation of the auditory
sensation and the response to the acoustic environment (ISO, 2014). Therefore, the soundscapes approach is related to people’s understanding and perception of the acoustic environment and meaning related with it (Traux, 1984; Schule-Fortkamp & Fiebig, 2006; Brown et al., 2011; Yang & Kang 2013; Acun & Yilmazer; 2018)
12
2.2.1 Previous Studies on Indoor Soundscapes
Indoor spaces have variety of geometries, materials, acoustical requirements, functions, and activities in it. This diversity generates lots of different acoustic environments. In that sense, in order to better understand the indoor
soundscapes, more studies should be conducted in different types of indoor spaces (Okcu et al., 2011; Mackrill et al., 2013; Dökmeci & Yilmazer, 2014; Acun & Yilmazer, 2015; Cankaya & Yilmazer, 2016; Yilmazer & Acun, 2018; Acun & Yilmazer, 2018; Acun & Yilmazer, 2015; Acun & Yilmazer, 2015; Acun & Yilmazer, 2017; Yilmazer & Acun, 2017; Yilmazer & Acun, 2017; Bora &
Yilmazer, 2015; Yilmazer & Bora, 2017; Bora & Yilmazer, 2013; Acun et al., 2016; Yilmazer & Orhan, 2019).
Hospitals (Okcu et al., 2011; Mackrill et al., 2013), libraries (Dökmeci & Kang, 2012; Xiao & Aletta, 2016), metro-stations (Bora, 2014), classrooms (Cankaya & Yilmazer, 2016), study areas (Acun & Yilmazer, 2017), care facilities (Aletta et al., 2018), mosque (Yilmazer & Acun, 2018), open-plan offices (Acun &
Yilmazer, 2018), and museums (Acun et al., 2018; Yilmazer & Orhan, 2019) are some of the indoor soundscapes research areas that have been studied.
Okcu et al. (2011) held the soundscapes study in two clinical healthcare settings to clarify nurses’ wellbeing and work performance, and to see the relation or between the physical parameters and perceptual data. Two 20-bed intensive care units (ICU) with similar patient disease and treatment models were chosen, and called as a neurological ICU (new treatment model) and medical-surgical ICU (old treatment model). Nurses were given a questionnaire which questioned
13
noise annoyance, perceived loudness, and work performance. Even though the measured sound levels were very similar in two different ICU, the perceived sound environment was found more annoying in the medical-surgical ICU. Thus, medical-surgical ICU had negative effect on nurses’ work performance, health outcomes, and anxiety. Researchers gave some design advices to create more livable environment for nurses such as reducing impulsive noise sources, use of sound absorptive finishes, and sound control methods for mechanical sound sources like HVAC systems.
Another indoor soundcape study was held in cardiothoracic ward in a UK hospital, by Mackrill et al. (2013). Researchers aimed to clarify people’s subjective responses towards the soundscapes and to generate the factors affecting the perception of soundscapes. Acoustic measurements were conducted and perceptual data were collected. Twenty-seven participants including nurses and patients attended the semi-structured interviews. Themes and categories were created according to the Grounded Theory method. The results showed that context is as effective as sound sources on perception of soundscapes. Participants had positive and negative feelings towards the soundscapes of the hospital environment. Some clarified that they developed coping methods like acceptation and habituation once they understood the context of the negative sounds. Researches emphasized the importance of the physical and cognitive factors together to be able to provide positive
14
Dökmeci and Kang (2012) studied three different libraries in Sheffield, UK. The aim of the study was comparing the measurement of physical parameters with the perceptual data to see elements affecting soundscapes perception. At the end, the study showed that architectural and functional elements affected the perceptual data. The most annoying sounds were determined as mechanical sound sources like mobile phones, personal music players, and construction noise. On the other hand, sound pressure level and loudness were found significantly related with participants’ perceptual evaluations.
Xiao and Aletta (2016) explored acoustic comfort in modern libraries, the quality of perceived sound environment considering the spatial organization to facilitate users’ reading and writing activities in the Library of Birmingham. Four groups of participants attended the study and took soundwalks in four different floors. The sound sources were identified, sounds pressure level was measured, and overall quality of perceived sound environment was evaluated. The overall soundscapes quality of each floor was different regardless of the sound
pressure level. Results showed that the open plan layout of the library was the determining factor of acoustic comfort. Results also found that the comfort of soundscapes depends mostly on users’ soundscapes cognitions and their purpose of using the space rather than the actual measured sound levels.
Bora (2014) studied soundscapes in metro-station. The aim was to clarify the negative and positive forms of the soundscapes in open, semi-open, and enclosed parts of the Akköprü Metro Station with its intermediate surroundings in Ankara. Physical and psychoacoustic parameters were measured in three
15
different parts of the station and compared with the perceptual data. Ninety participants joined the study and they evaluated the parts of the station with 17 adjective pairs in noise annoyance questionnaire while listening the sound records. The enclosed part got the highest rating for annoyance. Participants expressed the open parts as pleasant, calming, natural, and joyful while they expressed the enclose parts as unpleasant, stressful, artificial, and empty.
Cankaya and Yilmazer (2016) studied in classrooms in Bilkent High School; Ankara. Their aim was to create a conceptual framework in high-school
environment and clarify the effects of soundscapes on the students’ perception. One classroom and one computer laboratory were chosen and 30 students from Bilkent High School attended the study. To clarify the measurements of physical parameters in-situ measurement was conducted. As perceptual data; semi-structured interviews were conducted to see students’ perception towards the soundscapes. They used Grounded Theory approach to create the conceptual framework. Results showed that in the classroom and laboratory students preferred to hear music. They perceived the bird singing as the most positive sound source in classroom and laughter in laboratory. The most negative perceived sound source was speech in both spaces. Students had some positive approaches like promoting relaxation, comfort, attention, motivation, concentration, and interaction; and negative approaches like distraction,
disturbance, loss of concentration, loss of productivity, and annoyance towards the sound sources. Lastly, authors claimed that physical parameters are not enough to evaluate the soundscapes, as interpretation of the sound is also
16
important. Individual’s perception of soundscapes highly depends on and is shaped by the context of the spaces.
Acun and Yilmazer (2018) explored indoor soundscapes of the four open study areas in Bilkent University Campus. The aim of the study was to investigate the sound environment of the study areas and compare it with the students’
satisfaction, find out the students’ coping methods, and clarify the perceptual dimensions of the indoor soundscapes. They used in-situ sound level
measurements as physical parameters and questionnaire as perceptual data. The questionnaire was conducted with 30 students from each study areas in total of 120. It included three parts as; demographic information, five-point Likert scales to evaluate the satisfaction, and semantic differential scale method
consists of 14 adjective pairs which were ranked using seven-point scale. After data collection, IBM SPSS Statistics 21 was used to analyze them. Results showed that even the acoustical parameters were measured quite different, soundscapes satisfaction of students was not different as much. The most disturbing and frequently heard sounds were clarified as human-based sound sources in study areas.
Aletta et al., (2018) studied in nursing homes in Flanders, Belgium, with the large-scale survey. Their aim was to provide details of noise sensitivity and sound perception of staff members in their work environment and explore the effects on sound perception of staff role and context. The questionnaire which included categories of noise sensitivity, overall quality of the acoustic
17
dominance and their corresponding induced annoyance was conducted with 214 participants. Results showed that staff members are slightly to moderately
sensitive to noise, however, the perceived sound environment in their work setting is rather positive. There were statistically significant differences in terms of perception between the soundscapes of bedrooms and living rooms.
Therefore, bedrooms were perceived as calmer while living rooms were perceived as more eventful. All these results together showed that the context factor has more effects on perception of sound rather than the staff role.
Yilmazer and Acun (2018) studied in the Hacı Bayram Mosque which they called “unique context” because it was the first time that one of the historic religious spaces of Anatolian culture was studied. Their aim was to clarify individuals’ interpretation of the soundscapes of the mosque and its surrounding area, also their auditory sensation with the user-focused approach. To get definitive information about the physical parameters LAeq, T30, and STI ratings were measured. They used the Grounded Theory method to evaluate the individuals’ perceptual data gathered by semi-structured interviews. Fifteen participants chosen with the purposing sampling method attended the study. According to the semi-structured interview, the conceptual framework was created. Results showed that the sample group had low sound awareness and authors explained that it is related with the function of the building. It was proved that context shaped individuals’ sound preferences and sound expectation, which allowed individuals to interpret the soundscapes that complements the space identity.
18
Acun and Yilmazer (2018) held the soundscapes study in open-plan offices. The aim of the study was to conduct a Grounded Theory survey and create
conceptual framework for open-office environments. Physical parameters were measured both as in-situ and Odeon Room Acoustics Software 13.10
Combined. For collecting perceptual data, 45 participants were involved in semi-structured interviews from each office. Authors emphasized that the
measurements of physical parameters alone are not enough to clarify participants’ interpretation of soundscapes. Results showed that the sound sources, context of the sound, behavioral tendencies, sound preference, and task type directly affect the interpretation of the soundscapes. Unexpected sound sources and irrelevancy between the sound sources and context caused negative interpretation of soundscapes. It was also clarified that participants created coping methods when they face that problem such as; accepting, habituating, intervening the sound source, and using headphones to isolate themselves from that sound environment. Authors also offered using masking sounds as a design solution for the open-plan office environments.
Indoor soundscapes studies of the museum environment were first started by Acun, Yilmazer and Orhan. Thus, this subject was first introduced into the literature. Details of the studies as follows:
Acun, Yilmazer, and Orhan (2018) explored visitors’ subjective perception of the museum soundscapes and how it affects the visitor’s experience and to identify the associations between the soundscapes, function and the historic
19
measured with ODEON Room Acoustics Software and perceptual data were collected from 15 participants. Based on the participants’ responses to the semi-structured interviews, conceptual framework was created with the Grounded Theory method. The results showed that even the noisiest places can be
perceived as normal because of the context of the soundscapes; and individuals need the sound environment to be designed just like the physical environment. This can enhance the visitors’ experience to maximum degree in the museums.
Yilmazer and Orhan (2019) investigated the acoustic environment and
responses towards it by considering visitors’ perception of auditory environment in Erimtan Archaeology and Arts Museum. Physical parameters were measured and perceptual data was collected from six participants. Semi-structured
interview was completed and conceptual framework was created with the Grounded Theory method. Results showed that individuals need fully designed environments; and also sound was determined as a very effective design tool to help museums fit the purpose of collection, education, and recreation.
Previous Studies on Museum Acoustics
Studies on museum acoustics generally consider the acoustical parameters rather than the soundscapes of the museums. For instance, Fry (2002) offered ways to prevent noisy environments in the museums whilst Sala and Gallo (2007) and Carvalho et al. (2013) focused on the acoustical parameters of the museums in their study.
20
Fry (2002) clarified that interactive museums can cause an acoustic chaos. It is important because the sound and acoustic environment have impact on visitors’ learning experience. He argued that the problematic sound in the museums is the sound that can be controlled by designers, architects, and exhibit
developers. According to him the acoustic chaos is rooted in HVAC systems, motors, vacuum pumps, blowers, fans, poorly implemented speakers,
acoustically bright interior surfaces, and floor layout. Throughout the study he gave alternative design solution to each of these. At the end, he emphasized that environments where people can have delightful experiences without irresponsibly noisy can be produced.
Sala and Gallo (2007) conducted a study in the Historical Bardini Museum in Florence. At first they found current situation of indoor air quality, thermal comfort, light, and acoustic of the building and then they checked the comfort parameters and the energy consumption. Their aim was to create significant decrease in energy consumption without changing the historic characteristics of the building. Acoustic measurements concerned only the sound insolation of the façade and reverberation time. For the measurements, they used two channel sound analyzer equipped with the half-inch microphones and preamplifiers. Results showed that both the sound insulation of facade and reverberation time should be improved. They did not give specific results of the measurements. Finally, they offered some design solution such as doubling of the window.
Carvalho et al. (2013) conducted a study which compares acoustical conditions of the old (National Museum of Soares dos Reis) and modern (Contemporary
21
Art Museum of Serralves) museums. They measured physical parameters as in-situ in the largest showrooms of both of the museums. They measured the reverberation time, equivalent continuous sound pressure level of the
background noise as both HVAC off, on, and with visitors, and Rapid Speech Transmission Index. At the end, they compared the results with the ideal values and offered some design solutions. Reverberation time was above the ideal value in both museums but it was higher in the modern museum because of the room volume, high ceilings and the existence of highly reflective surfaces. They suggested the use of sound absorption materials to solve the problems in the buildings.
2.1.2 ISO/TS 12913-2:2018 Acoustics-Soundscapes and Soundscapes Evaluation Methods
Soundscapes occur by human perception towards the acoustic environment (Kang & Schulte-Fortkamp, 2017). After The International Organization for Standardization (ISO) provided, with the ISO/FDIS 12913-1 2014, a definition of soundscapes, the idea that not only the measurements of physical parameters but also the evaluation of perceptual data should be considered in soundscapes studies was occurred. In 2018, The International Organization for
Standardization (ISO) provided with the ISO/TS 12913-2 2018 the data
collection and reporting requirements for soundscapes studies. According to the standardization, by considering the definition of the soundscapes; people, acoustic environment, and context should be explored with several methods to get full-featured soundscapes study (ISO, 2018). Additionally, it indicated that
22
the process requires the combination of physical parameters; sound levels and/or binaural measurements, and perceptual data; soundwalk and/or questionnaire and/or guided interview to examine the different aspects of soundscapes (ISO, 2018). The standardization briefly explains the aims and gives examples about the methods of questionnaire (Method A), soundwalk (Method B), interview (method C), and binaural measurement.
This thesis is initially focusing on the Grounded Theory method besides other perceptual methods and measurements of physical parameters. Grounded Theory method have been applied to the indoor soundscapes studies before (Mackril et al., 2013; Bora, 2014; Acun, 2015; Cankaya, 2016; Cankaya & Yilmazer, 2016; Acun & Yilmazer, 2018; Acun et al., 2018; Yilmazer & Orhan 2019). All the methods used in the study will be explained in more details.
2.1.2.1 Evaluation of Physical Parameters
Equivalent Continuous A-weighted Sound Level (LAeq)
Equivalent Continuous Sound Level (LAeq) is defined as the total sound energy within a period and the measurement unit is the logarithmic scale unit of dB ("Acoustic Glossary," 2019). It is measured with sound level meter. Egan (1988) claimed that healthy human ears can detect sound energy from 20 Hz to 20000 Hz frequency ranges, and human speech refers to the range between 125 Hz to 8000 Hz. Even though human ear can detect sound energy from 20 Hz to 20000 Hz, it is more responsive between 500 Hz and 6000 Hz frequency ranges (Acun, 2015). Frequency weighting method is created to reflect the subjective response
23
of humans towards objective sound levels. A- Weighting can reflect human response more precisely than other weightings because it ignores low-frequency sound energy like human ears do (Egan, 1988; Cankaya 2016). These studies generally consider the measurement of the A - weighted sound pressure level (LAeq) which is abbreviated as dB (A). Additionally, if a frequency weighting is not specified, the A - frequency weighting is understood ("Acoustic Glossary," 2019).
Reverberation Time
Egan (1988) defined the reverberation time as “the time needed for sound to decay 60 dB from the initial sound level”. Wallace Clement Sabine aimed to improve the listening conditions of lecture halls and introduced the term in 1985 (Kendrick, 2009; Acun, 2015). Harris and Shade (1994) claimed that
reverberation time depend on the room volume, the sound frequency, and the total sound absorption. Therefore, it was formulated as;
T= 0.05 (V/A)
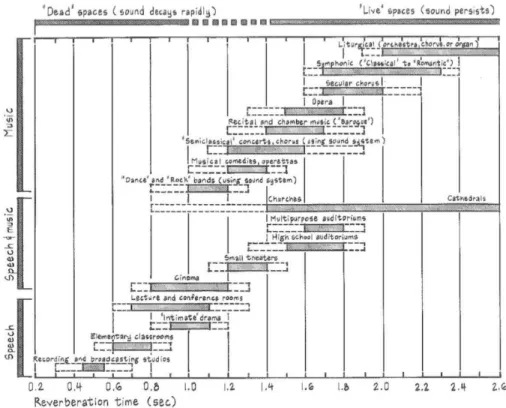
In the formula “T” represents reverberation time in seconds, “V” represents room volume (ft3), and “A” represents total ft2 of room absorption in Sabin. Based on the relationship between the room volume and reverberation time, Egan
generated preferred ranges of reverberation time for different spaces (1998). Figure 3 clarifies that larger spaces have longer reverberation time, whilst smaller spaces have shorter reverberation time.
24
Figure 3. Reverberation time according to the different functional spaces (Egan, 1988)
Speech Transmission Index (STI)
ISO defined the speech intelligibility as “a measure of effectiveness of
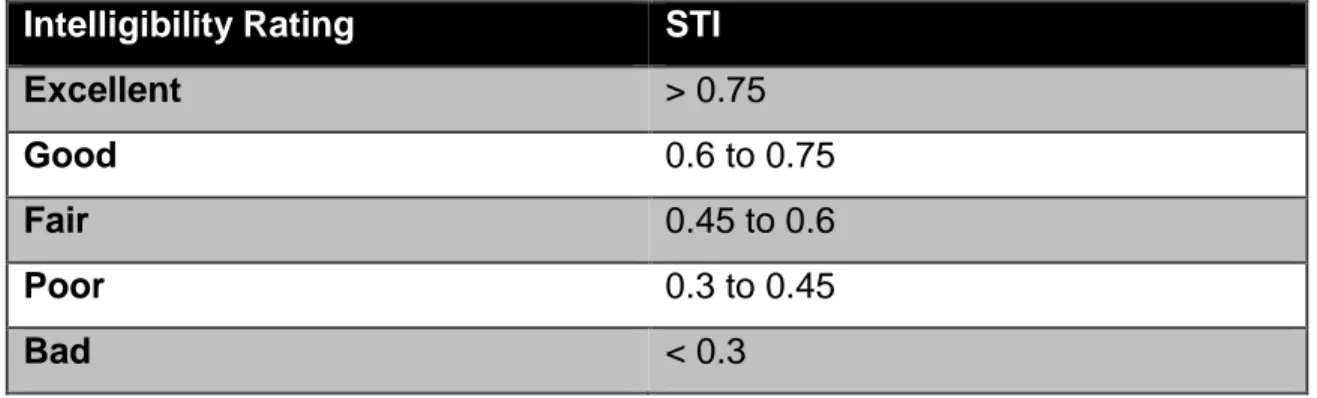
understanding speech” (2003). Kryster generated Articulation Index (AI) which was used to measure the noise effect on speech intelligibility and his study inspired Houtgast and Steeneken to establish the speech transmission index (STI) (Steeneken, 2001). Egan (1988) clarified that the speech transmission index is the measurement unit of quality of speech intelligibility. STI ratings range between the scale of 0, which refers to bad intelligibility, and 1, which refers to excellent intelligibility (Table 1).
25
Table 1. Speech Transmission Index (STI) (Adapted from Houtgast and Steeneken, 1971)
Intelligibility Rating STI
Excellent > 0.75
Good 0.6 to 0.75
Fair 0.45 to 0.6
Poor 0.3 to 0.45
Bad < 0.3
2.1.2.2 Grounded Theory Method
Grounded Theory was first introduced by Glaser and Strauss in 1967 (Corbin & Strauss, 1990). Mvaddat (2014) claimed that the aim of Grounded Theory is to analyze the collected data systematically and to form the general frame.
Grounded Theory is the most preferred method, within the qualitative methods, when the aim is generating theory out of gathered data (Strauss & Corbin, 1998; Roman et al., 2017; Ruppel & Mey, 2017).
Corbin and Strauss (1990) claimed that, like other qualitative approaches, data of Grounded Theory can be gathered by various sources like interviews,
observations, newspapers, videotapes, books and anything related to the study. After the collected data reach theoretical saturation, they all should be
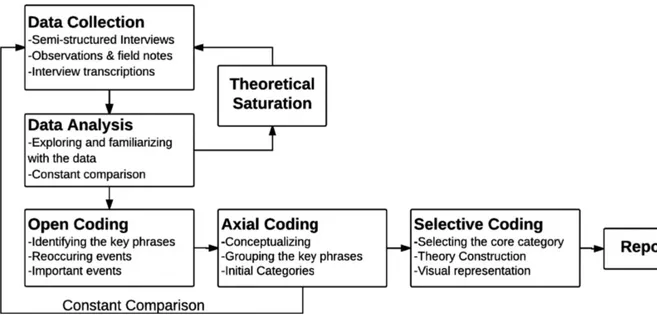
transcribed and coded verbally. Coding process has three main steps as; open-coding, axial coding and selective coding (Strauss & Corbin, 1990) (Figure 4). For the open coding step, data are broken down analytically and all the
26
important points are labelled. In that way, researcher can see any detail of the present data. During the axial coding, labels are grouped back together and conceptualized according to their similarities and differences. Thus, the initial categories are occurred. Finally, for the selective coding step, a category which reflects the core of the phenomenon is chosen. Its relation to the other
categories is explored, which allows the theory to explain the phenomenon (Strauss & Corbin, 1990). Currently, researchers prefer to use software for analyzing the qualitative data (Ruppel & Mey, 2017). This thesis uses ATLAS.ti Software to analyze the data gathered from interviews for Grounded Theory method.
Figure 4. Collection and analysis of the Grounded Theory data (Acun & Yilmazer, 2015)
27
2.1.2.3 Evaluation of Perceptual Data
The aim of collecting perceptual data is to evaluate soundscapes in the given area from people’s subjective responses. The International Organization for Standardization (ISO) provided with the ISO/TS 12913-2 2018 three main perceptual data collection methods as; questionnaire, soundwalk, and interview (2018). They called them as Method A, Method B, and Method C orderly.
Questionnaire, Method A, is one of the most used data collection method in soundscapes studies. Aim of it is to learn how people perceive the acoustic environment. According to ISO/TS 12913-2 2018, it is important to inform
participants about how their data will be used and warn them that it is optional to answer any of the questions (ISO, 2018). And all, to reach its aim, questionnaire should include four main parts; sound source identification, perceived affective quality, assessment of the surrounding sound environment, and appropriateness of the surrounding sound environment.
The first part is important to characterize the acoustic environment with the defined sound sources. It is suggested to divide the sound sources into three types as; sounds of technology, sounds of nature, and sounds of human beings (ISO, 2018). ISO/TS 12913-2 2018 explains the second, third and fourth parts with the example of questions in the standard (Figure 5). The results are evaluated with statistical analysis software.
28
Figure 5. Four main parts suggested for questionnaire method (Adapted from ISO/TS 12913-2 2018)
29
Soundwalk, Method B, gives information about the existing acoustic
environment and proposed environment (ISO, 2018). The term “soundwalk” was first introduced by Schafer (1977) as;
“The soundwalk is an exploration of the soundscapes of a given area using a score as a guide. The score consists of a map, drawing the listener’s attention to unusual sounds and ambiances to be heard along the way.”
Kang and Zang (2010) clarified that Schafer’s aim was to create awareness on listening attentively. At first, the Soundwalk method consisted of a one-hour walk and then a discussion section, which then left it to the instant debates in the route at pre-determined stops, resulting in more reliable results with instant discussions (Schaffer, 1977; Bruce & Davies, 2014; Davies, 2009; Cankaya 2016). The last standardization of ISO/TS 12913-2 2018 provides very detailed procedure for soundwalk about what the person leading the soundwalk should do, what the person performing the binaural measurements should do, and what participants should do (ISO, 2018). The participants should be given minimum three minutes to listen to the defined environment with all of their senses and should complete the three main parts, which are shown in Figure 6, that ISO/TS 12913-2 2018 provides for soundwalk method (ISO, 2018). These parts of soundwalk method are; assessment of the sound environment, sound source recognition, and subsequent comments.
Indoor acoustic environments are not suitable for this method. Therefore, many urban soundscapes studies used this method (Bruce & Davies, 2014; Kang & Zhang, 2010).
30
Figure 6. Three main parts suggested for soundwalk method (Adapted from ISO/TS 12913-2 2018)
31
Interview, Method C, is another mostly used data collection method of the soundscapes studies. Similar to the questionnaire, it aims to explore people’s perception towards the acoustic environment. However, it collects the data with open-ended questions and these questions might change according to the way the conversation goes (ISO, 2018). ISO/TS 12913-2 2018 presents an interview guideline related to residential context. The guideline offered a wide range of possible questions to ask and emphasized that it should be adapted to the specific scenario under study (ISO, 2018). Interviews are conducted with
participants and results can be evaluated with different methods. This thesis will focus on the Grounded Theory which is one of the most used methods for social sciences and natural sciences (Strauss & Corbin, 1998).
This thesis considers the measurements of Equivalent Continuous A-weighted
Sound Level (LAeq), Reverberation Time (T30), and Speech Transmission Index
(STI) in the scope of the physical parameters; questionnaire (Method A) and interview (Method C) in the scope of the perceptual data.
32
2.2 Museum Environments and Classifications
The term “museum” was used to describe a place of contemplation by Ancient Greece while it was used to describe a place of philosophical discussion by Ancient Roman (Woodhead & Stansfield, 1994, p. 3). Until the seventeenth century the term was not used to explain its current meaning. And by the
eighteenth century the term started to mean an institution set up, open to public, to preserve and display collections (Woodhead & Stansfield, 1994, p. 14). The latest and the most known definition of museum was created by the International Council of Museums (ICOM) as:
“non-profit, permanent institution in the service of society and its
development, open to the public, which acquires, conserves, researches, communicates and exhibits the tangible and intangible heritage of
humanity and its environment for the purposes of education, study and enjoyment” (ICOM, 2016).”
Museums behave as collection, education, recreation, and exhibition places (Sheng & Chen, 2018). They attract domestic and foreign tourists’ attention excessively and they are the best tools to show the dignity of the country (Henderson, 1998, p. 7). Touring around the halls of a museum is passing through the history of human race because museums are the defender of time by their content (New World Encyclopedia, 2018).
Museums in Turkey have great importance because they are housing Anatolia’s thousands of years of historical and cultural heritage. The first museum in
Turkey was founded in 1846 by Tophane-i Âmire Marshall Fethi Ahmet Pasha at Hagia Irene, which was previously used as a military depot in Istanbul (Kültür
33
Varlıkları ve Müzeler Genel Müdürlüğü, 2014). Since the War of Independence, Atatürk has shown great interest in museums and has provided the
establishment of many museums and laid the foundations of Turkish museums. Today there are over 400 museums in Turkey and related development studies are still continuing to raise this number (TUIK, 2017).
Today museum classification varies extremely. They range in size, their purpose, their collections, who run them, and the public they aim to serve (Ambrose & Paine, 2005, p. 7). Because there are too many different types of museums, it is necessary to make a classification. In 1995, ICOM clarified that the definition of the museums cannot be changed according to the
administrative unit to which it belongs, its regional feature, functional structure, collection type, or its method of exhibition. But this grouping will play an
important role in determining the types of museums. In the previous studies, classifications of museums were determined by considering this declaration of the ICOM.
This thesis focuses on the museum types classified by their collection. In this sense, examples of the museums classified according to their collections are as follows: general museums, archaeology museums, art museums, history
museums, ethnography museums, natural history museums, geology museums, science museums, military museums, industrial museums, etc. (Ambrose & Paine, 2005, p. 7; New World Encyclopedia, 2018).
34
2.2.1 Museum Buildings and Architecture
Earliest museums were not special building type and their purpose was to house precious and luxurious residential objects in the long and narrow galleries
(Henderson, 1998, p. 7; Milojkovic & Nicolic 2012). The aim of the galleries was to provide the distant parts of the palaces with a connection. In 1802-1805 the French theorist Jean Nicolas Louis Durand generated the museum model which has many long galleries, four courtyards and a rotunda (Stephens, 1986, p. 16) (Figure 7).
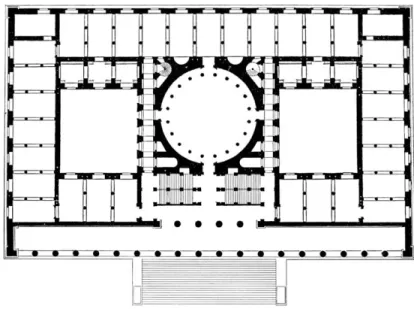
The primary museum scheme was firstly created by Durand’s layout. It was continued with other most known plan layout model of Karl Friedrich Schinkel’s Altes Museum (Figure 8). Durand’s museum building layout made a big
contribution to museums’ spatial organization. According to that building layout the major rooms were connected to provide the sequence of viewing and there was linear continuity to make visit easy to follow (Milojkovic & Nicolic 2012).
Until the mid-twentieth century Durand’s typology for museum design was followed by many architects. Then, as the needs increased, the spatial
organizations changed and different resolutions began to be found. Even though the primary museum scheme is preferred in some parts of many museums today, in terms of the linear continuity especially for logical circulation, the dependence on a single model has disappeared and many different types of layouts have begun to be seen (Stephens, 1986, p. 23; Milojkovic & Nicolic 2012).
35
Figure 7. Jean Nicolas Louis Durand’s museum plan layout (Darragh & Snyder, 1993)
Figure 8. Karl Friedrich Schinkel’s Altes Museum plan layout (Darragh & Snyder, 1993)
36
Today the museum buildings are examined under two main categories as conversions and purpose-built (Ambrose & Paine, 2005, p. 202; Savaş, 2010). According to the Ambrose and Paine (2005) these categories include;
- An important historic or contemporary building which was used for domestic, public service, industrial, commercial, religious or military purposes.
- Historic, purpose-built museum building.
- Redundant buildings of limited architectural significance. - Contemporary/new, purpose-built museum buildings.
The museum building should relate to its commission and aim whether it is a converted or purpose-built. Relatively, the space allocation depends on the necessities that museum sets itself (Ambrose & Paine, 2005, p. 202). Museum buildings are now being used as not only for exhibition and preservation
purposes but also as social gathering places, education places and marketing places to maximize their appeal to public (Henderson, 1998, p. 11; Rosenblatt, 2001; Cerver, 1997, p. 6; Darragh & Snyder, 1993, p.14).
An American architect Denise Scott Brown said:
“I think something else is happening in the museums now. In the museums we designed we had to great deal of non-museum space. Today’s museum is part restaurant, part shop, and part education department; it is full of lecture halls, conference rooms, and computer spaces, where visitors can find information away from paintings. Museums want to offer people different ways of knowing art.” (Steele, 1994, p. 9)
37
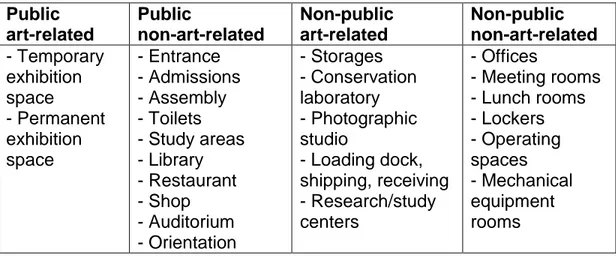
This situation generates the public and non-public spaces inside the museums. According to Darragh and Snyder (1993, p. 70), one effective way to define the public spaces is to follow the perspective of a visitor arriving at the museum. Similarly, to define the non-public spaces is to follow the perspective of an arriving work of art. Therefore, Table 2 shows how the spaces in the museums are grouped in the literature (Lord & Lord, 1999, p. 283; Darragh & Snyder, 1993, p. 71; Ambrose & Paine, 2005, p. 203).
Table 2. The categorization of the spaces in the museum environments
Public art-related Public non-art-related Non-public art-related Non-public non-art-related - Temporary exhibition space - Permanent exhibition space - Entrance - Admissions - Assembly - Toilets - Study areas - Library - Restaurant - Shop - Auditorium - Orientation - Storages - Conservation laboratory - Photographic studio - Loading dock, shipping, receiving - Research/study centers - Offices - Meeting rooms - Lunch rooms - Lockers - Operating spaces - Mechanical equipment rooms
There is no strict rule for creating space allocation in the museums because it changes according to the museum’s need. However, all of the museums have to provide optimal environmental conditions for preserving, protecting, and
exhibiting the objects in a most efficient way (Henderson, 1998, p. 9). In this sense, air condition, temperature, humidity, lighting, fire safety, and acoustic conditions are the most considered environmental factors in museum
38
environments (Ambrose & Paine, 2005, p. 164-183; Lord & Lord, 1999, p. 175-217; Darragh & Snyder, 1993, p. 249 - 276).
2.2.2 Museum Acoustics
Museum buildings have a potential to be noisy because of the huge HVAC systems, the variety of activities take place in different functions, and the nature of the museum space (Darragh & Snyder, 1993, p. 249-254). Fry (2002) claims that the noisier the exhibition area is, the louder the visitors are because they raise their voices to be heard.
According to Fry (2002), visitors are the loudest element of museums like any other public spaces. Noise may affect the visitors’ comfort by causing disruption of communication between the visitor and exhibition (Rahim et al., 2017).
Therefore, standards and national requirements were generated to handle with noise in the museums. According to the regulations in Turkey, the LAeq level should be maximum 56 dB and the reverberation time should be maximum 1.2 in the museums (Resmi Gazete, 2018).
Besides the importance of the physical parameters, sound is also a very important element for the ambience or atmosphere of the museum such that sound of the fountain or quiet music may help enormously (Ambrose & Paine, 2005, p. 221).
39
CHAPTER III
METHOD
3.1 Design of the Study
This study examines the visitors’ perception of the soundscapes in the museums. The goal is to provide different case studies on soundscapes
approach for literature, and compare the soundscapes of spaces that have the same context. In order to achieve that, Rahmi M. Koç Museum and Erimtan Archaeology and Arts Museum were chosen. Measurements of physical parameters were conducted and perceptual data were acquired. Equivalent
Continuous A-Weighted Sound Level (LAeq), Reverberation Time (T 30), and
Speech Transmission Index (STI) were calculated as physical parameters. Perceptual data included questionnaire and semi-structured interview. Interview data were evaluated with Grounded Theory method with the help of ATLAS.ti software and questionnaire data were analyzed with SPSS.
40
3.1.1 Research Questions
The following research questions were investigated;
How does the visitors’ perception of soundscapes change in museum environments?
How does the sound level influence visitors’ perception towards the soundscapes?
Does the perceived sound environment affect the visitors’ preferences towards the built environment in museums?
3.2 Method
3.2.1 The Site
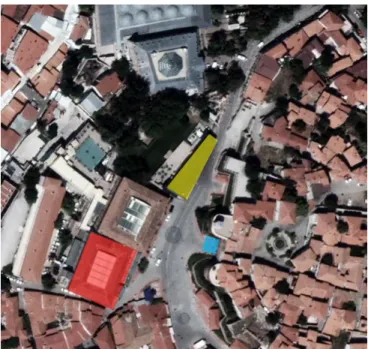
The case study areas were determined as Rahmi M. Koç Museum and Erimtan Archaeology and Arts Museum. They are both located at an immediate
environment of the Ankara Castle (Figure 9). Although the construction date of the Ankara Castle is not known precisely, it is said that its construction dates go back to B.C. 2nd century (T.C. Kültür ve Turizm Bakanlığı, 1987). The castle has become a great defensive center for being built on a steep hillside. The use of the castle both for defense and residential purposes has made it so robust. The area between the southern entrance of Ankara Castle and the plain in front of the Rahmi M. Koç Museum and Erimtan Archaeology and Arts Museum was
41
used as a market place in the 13th and 14th centuries. This market place is called At Pazarı. In the 16th
and 17th century because the number of the merchants, craftsmen and tradesmen increased around the Ankara Castle, many inns and Turkish bazaars were built (Terzioğlu, Yertutan, & Boylu, 2009). This situation leads to the creation of the Han district, a place for caravans of merchants to accommodate after travelling along the ancient Silk Road between Chine and Europe. All of these activities caused the generation of various
services in the Han district such as: spice dealers, barbers, knife, makers, tanners, cotton dressers, shoe shops, cabinet makers, blacksmiths, etc.
(VEKAM, 2008) The Ottoman economy was negatively affected by the Industrial Revolution. The products produced in the Han district lost their competitiveness against the exported goods and commercial activities in the region.
Nowadays, Han district consists of lots of inns, old and traditional houses, museums, galleries, cafes, and local shops. Accordingly, the location of the museums is in the most historical and cultural part of Ankara. And this situation provides people with a unique visual atmosphere and soundscapes.
In order to facilitate to follow, Rahmi M. Koç Museum will be referred as Museum RMK, Erimtan Archaeology and Arts Museum will be referred as Museum EAA at the rest of the study.
42
Figure 9. Location of the museums (Yellow part represents t of the Erimtan Archaeology and Arts Museum, red part represents the Rahmi M. Koç Museum, and blue part represents the Ankara Castle’s southern entrance) (Google Maps, Ankara Kalesi, 2019)
Figure 10. View of museums from the southern entrance of Ankara Castle. Arrow on right shows the Rahmi M. Koç Museum whilst on left shows the Erimtan Archaeology and Arts Museum (Photo taken by the author, 2019)
43 Rahmi M. Koç Museum
Museum RMK is located opposite to the southern entrance of the Ankara Castle (Figure 10). It has two main sections as Çengelhan and Safranhan. Only the Çengelhan part is examined for this study. Çengelhan was built in 1522-1523 and it was used as caravanserai and storage in the past. The restoration started in 2003 and it was completed in 2005. Therefore, Çengelhan started to serve as Museum RMK. Safranhan was built in 1511 and used respectively as
caravanserai, jail, and storage. It was restored between 2012 and 2016, and opened as an extension of the museum. Museum RMK is Ankara’s first and Turkey’s second industrial museum (Ankara Kalkınma Ajansı, 2016). Therefore, as it was mentioned in the literature review part, this museum belongs to the category of an important historic or contemporary building which was used for domestic, public service; industrial, commercial, religious or military purposes. Çengelhan has a basement, ground floor and the first floor with an inner courtyard and rooms around it. All the rooms are used for different exhibitions. The inner courtyard is surrounded with vaulted cloisters and was covered with glass roof during the restoration in order to protect the exhibited items from different weather conditions, uncontrolled lighting, noise and other external factors (Figure 11). The height of the ground floor is 3.5 m, the first floor is 3.2 m and the courtyard is 10.5 m. There are 20 rooms for permanent exhibitions, two rooms for offices, and one room for gift shop on the ground floor. There are 26 rooms for permanent exhibitions on the first floor. And the courtyard is being used as an exhibition area also. The original stone flooring of the courtyard is covered with wall to wall carpet for acoustical purposes. The mostly used
44
materials on the floors are stone. The ceiling is made out of bricks and the walls are made out of both bricks and local stones. However, in some parts wooden window frames and doors are existed. Its scale, façade, and interior reflect the historic environment around the museum contextually (Figure 11).
It provides people with a chance to go back in time with its unique contents of exhibitions. Historical objects related to the road transportation, rail
transportation, maritime, aviation, craftsmanship, scientific instruments, communication instruments, toys, agriculture, and everyday objects are exhibited in the museum (Figure 12).
45
Figure 11. Views from outside and inner courtyard of Rahmi M. Koç Museum (Photos taken by the author, 2019)
Figure 12. Views of exhibited objects and exhibition areas in Rahmi M. Koç Museum (Photos taken by the author, 2019)
46 Erimtan Archaeology and Arts Museum
Museum EAA is located opposite to the southern entrance of Ankara Castle. The museum was opened in 2015. It is comprised of the facades of three old houses around the castle. While the scale and the façade of the building are connected contextually to the historic environment, the interior provides visitors with a contemporary environment and experience (Figure 13). Therefore, as it was mentioned in the literature review part, this museum belongs to the
category of contemporary/new, purpose-built museum buildings. It is a three-story building and exhibits more than 2000 objects from Yüksel Erimtan’s collection of Anatolian archaeological artifacts like glass artifacts, gems, and coins, etc (History, n.d.) (Figure 14). The main entrance of the museum directs people to the mezzanine floor which has the permanent exhibition of
archaeological objects, gift shop, and vestibule. The first floor contains the display of archaeological artefacts and there is also a small cafeteria and library. The ground floor is segregated for the art exhibition and managers’ offices. There is always a temporary exhibition throughout the year on the ground floor. The study only takes place in the permanent exhibition areas, which covers the first floor and mezzanine floor, to make the study more reliable. The height of the studied area is 10.6 meters. The main floor covering material is wooden parquet. The local travertine is used on the walls. The material of the ceiling is concrete and there are glass and metal surfaces in interior space.
47
Figure 13. Views from outside and interior of Erimtan Archaeology and Arts Museum (Photos taken by author, 2019)
Figure 14. Views of exhibited objects and exhibition areas in Erimtan Archaeology and Arts Museum (Photos taken by author, 2019)