An Application of Fuzzy-AHP to Ship Operational Energy Efficiency Measures E. Bal Beşikçi a
,*, T.Kececi b, O.Arslan b, O.Turan c a
School of Advanced Vocational Studies, Istanbul Bilgi University, Istanbul,Turkey b
Department of Maritime Transportation Management Engineering, Istanbul Technical University,Istanbul,Turkey c
Department of Naval Architecture, Ocean and Marine Engineering, University of Strathclyde, 100 MontroseStreet, Glasgow G4 0LZ, United Kingdom
Abstract
Lowering fuel consumption of ships has gained a great deal of attention in maritime industry with regards to both environmental and economic concerns. The potential for fuel economy in shipping ranging between 25% to 75% is possible by using existing technology and practices and technical improvements in the design of new ship. Despite the existence of many technology and design-based approaches, limitations of emerging these measures has led to discussions about the potential energy savings through operational changes. In this study, operational measures were examined within the scope of Ship Energy Efficiency Management Plan (SEEMP) adopted by International Maritime Organization (IMO). We applied the Analytic Hierarchy Process (Fuzzy-AHP) approach, one of multi-criteria decision making (MCDM) techniques, to prioritize the weight of each measure. Fuzzy AHP effectively reflects the vagueness of human thinking with interval values, and shows the relative importance of operational measures - which can be the fundamental decision making data for decision makers (ships' masters, operating companies and ship owners) - by providing a strategic approach to identify energy efficient solutions.
1. Introduction
With increasing international trade due to globalization, reducing carbon emissions from maritime transport have become important as a result of environmental challenges posed by climate change. Since 1990, growth in world trade requires greater quantities of goods to be transported of which more than 80% is carried by ships (measured by weight) (UNCTAD, 2009). As a consequence, CO2 emissions from shipping have seen an 86% increase from 1990 to 2007 (Buhaug et al., 2009). This is a high rate of growth compared to the global growth of carbon emissions which is about 38% (IEA, 2009).
Maritime transport emissions are expected to increase further by double or even triple by 2050 on the basis of ‘‘business as usual’’ scenarios with a tripling of world trade (Buhaug et al., 2009).
Besides, increasing fuel prices are damaging to maritime companies’ competitive powers in the market as the fuel cost stands for a significant share of the ship operating cost which is expected to be 50% (Notteboom, 2006) or even more than 60% (Golias et al., 2009). For example, when fuel price is around 500 USD per ton, the fuel cost accounts for about three quarters of the operating cost of a large containership (Ronen, 2011). Fuel price often appears to increase or decrease due to the many reasons. In recent times, ship fuel costs have fallen significantly (UNCTAD, 2015). However, economic aspects of fuel saving remain the importance in the case of the increase in the fuel price. The rise of the fuel prices will lead the shipping companies to more energy efficient measures.
For the above-mentioned reasons, fuel efficiency of ships seems to be one of the most important issues to meet both environmental and economic needs. The possible fuel saving could be succeeded from 25% up to %75 via more efficient operations of existing ships and designing of new ships efficiently (Buhaug et al., 2009). Regulations on energy efficiency for ships have been adopted to MARPOL (International Convention for the Prevention of Pollution from Ships) Annex VI, as a new chapter (Chapter 4). Through this, entered into force on January 1, 2013, all new ships have been forced to obey the requirements of Energy Efficiency Design Index (EEDI) and keep a Ship Energy Efficiency Management Plan (SEEMP) (IMO, 2011). In addition,
Energy Efficiency Operational Indicator (EEOI) was proposed as a monitoring tool of the SEEMP (IMO, 2009).While EEDI proposes a minimum technological measures with a long term impact for new ships, SEEMP is an operational implementations that seeks to enhance ship's energy efficiency through using available technologies in ships. Despite the existences of various technology and design based approaches such as propeller re-design, anti-fouling measures for hulls and improved engine operations to increase ship energy efficiency, limitations of these measures has inevitably caused discussions on the potential energy savings through operational changes (Buhaug et al., 2009; Corbett et al., 2009). For many existing ships, reducing fuel consumption through operational measures is more preferable option than adopting a new technology investment by reason of the long payback period (Lindstad, 2011).
Previous studies have been carried out to determine the impact of operational measures such as slow steaming or route optimization according to weather on fuel consumptions in terms of carbon emissions and cost savings (Corbett et al., 2009; Psaraftis, et al., 2009; DNV, 2010; Fagerholt et al., 2010; Golias et al., 2010; Longva et al., 2010; Cariou, 2011; Du et al., 2011; Meng and Wang, 2011; Lee et al., 2012; Song and Xu, 2012). These studies can be divided into two categories; those that examined whole improvement potential (Buhaug et al., 2009; DNV, 2010) and those that investigated by focusing on one or more operational measures (Cullinane and Khanna, 2000; Corbett et al., 2009; Notteboom and Vernimmen, 2009; Seas at Risk and CE Delft, 2010; Lindstad et al., 2011; Lindstad et al., 2012; Lindstad et al, 2013) and emissions.
Combined effects of several factors, both tangible and intangible, exist for evaluating ship operational energy efficiency measures. Identifying these factors, defining the effects of them on each other, assessing their importance, and selecting a strategic implementation require a well-designed multiple criteria decision making (MCDM) (Andreou et al., 2005; Topcu and Burnaz, 2006;F Kabir and Hasin, 2011; Ergu, 2014). MCDM methods generally cope with the process of making decisions in the presence of more than one criterion. In the real world, it is often imprecise to obtain information for inputs and outputs of data and to tackle them with crisp numbers as reflecting human's appraisals associated to pair-wise
comparisons. The analytic hierarchy process (AHP), was first introduced by Saaty in 1980, is a multiple criteria decision-making method (MCDM) for complex and unstructured problems (Saaty, 1980). AHP technique is used as a subjective tool to prioritize the factors based on a crisp 9-point scale. The AHP method allows decision makers to structure complex problems in a form of hierarchy and measure both qualitative and quantitative factors with a large number of criteria and attributes in a systematic manner. However, the fuzziness related to real-world decision situation is not be precisely represented in a crisp values by AHP method as decision makers may judge with uncertainty and tend to assess factors using natural language rather than exact numbers. Fuzzy set theory deals with vague or not well-defined information. Fuzzy theory using the membership
functions and the fuzzy numbers
efficiently changes vague information into useful data. Fuzzy set theory applies groups of data with boundaries that are not well defined. The preferences in AHP are basically based upon human judgments and perceptions with mostly intangible criteria, thus fuzzy AHP method allows to get more accurate results of the multiple criteria decision making process.
AHP and Fuzzy AHP approaches are extensively studied in energy researches for assessment of energy policies and technologies (Konidari and Mavrakis, 2007; Lee et al., 2011 and Lee et al., 2013) and maritime researches for the purpose of selection and assessment (Cicek and Celik, 2009; Soner et al., 2015 and Senol et al., 2015).
The main purpose of this research is to prioritize the weights of operational energy efficiency measures within the scope of SEEMP. SEEMP is a tool that can be used by the ships' masters, operating companies and ship owners to monitor the ship and fleet performance efficiency over time through implementing operational measures using the existing technologies in ships such as voyage optimization, hull and propeller maintenance, engine management, energy management, fuel management as well as crew awareness and training on energy efficiency. We use fuzzy analytic hierarchy process (AHP) to generate and calculate the quantitative importance of each factor (measure effect). It is very meaningful to prioritize operational energy efficiency measures to assess and select the optimal implementations by considering both the economic and environmental
aspects. The results of this study will provide decision makers (ships' masters, operating companies and ship owners) with the strategic approach needed to select the most appropriate measures and to produce an energy efficient solutions for the shipping industry against possible rise in oil prices and greenhouse emissions.
The rest of this paper is structured as follows. Ship operational energy efficiency measures are covered in Section 2 in more details. Section 3 presents the concept of fuzzy sets and numbers. Section 4 includes fuzzy AHP process. Section 5 develops hierarchy of criteria. Conclusions are carried in Section 6.
2. Operational ship energy efficiency measures 2.1 Voyage performance management (VPM) 2.1.1 Speed optimization (SO)
Speed is a vital variable in maritime transportation. Even if ships move slower than other transportation modes, this feature does not diminish the value of ship speed. The growth of the world trade volume inevitably necessitates high-speed vessels. The economic benefits could be derived from high speed vessels such as the delivery of goods in due time, reduced inventory costs and rising in the trade volume per unit time (Harilaos et al., 2013). On the other hand, speed optimization has become a major research subject from an environmental and economic point of view.
Ships have normally specific design speeds. This speed is in the range of 13-16 knots for large dry bulk carriers while service speeds of large container ships are about 24-26 knots (Lindstad et al., 2011). According to previous studies, reducing ship operating speed by 2-3 knots lower the design speed has greater effect on daily fuel consumption and thus may decrease operating costs for shipping companies (Wijnolst and Wergeland, 1997; Stopford, 1999; Chang and Chang, 2013). Lowering ship speed by 10% creates by at least 10-15% reduction of emissions and also substantial gains in revenues (Psaraftis et al., 2010). A main reason is that the power output required for propulsion is a function of the speed to the power of three (Harvald, 1977). Therefore, the speed of ship has a major impact on reducing fuel
consumption and if the ship reduces its speed by 10%, its fuel consumption will reduce by about 27% (Faber, 2012). For this reason, several authors have incorporated speed optimization for achieving fuel savings (Ronen, 1982; Bausch, 1998; Fagerholt et al., 2010; Cariou, 2011; Lindstad et al., 2011; Norstad et al., 2011; Qi and Song, 2012).
The optimum ship speed should be decided by considering various parameters having impact on the voyage plan. Even if lower speed is profitable in terms of fuel saving, other commercial and operational requirements ought to be taken into consideration.Liner service ships (container ships and ferries) have a regular run and operate to a schedule (Christiansen et al., 2004; Shintani et al., 2007; Gelareh et al., 2010; Gelareh and Pisinger, 2011; Meng and Wang, 2011a; Meng and Wang, 2011b; Wang et al., 2011; Wang and Meng, 2011; Wang and Meng, 2012a; Wang and Meng, 2012b). Notteboom and Vernimmen (2009) asserted that liner service ships have an inertia and customer allegiance due to their service integrity. On the contrary, tramp service ships (tankers and bulk carriers) have no fixed routing or schedule, making them available at short notice. If the ship navigates at a slow speed rather than waiting before berthing because of the congestion port, it provides fuel saving up to 10% throughout the voyage (IMO, 2010; Norlund and Gribkovskaia, 2013).
2.1.2 Autopilot improvements (AI)
Autopilot is an auxiliary bridge equipment, decreasing the traveling distance by less rudder movements. The rudder motion generates more drag to the ship hull and results with the increase of ship resistance. Thus, reduction on the rudder usage and small rudder angle during course keeping results in fuel economy.
Conventional autopilots depend on the link between rudder angle and ship’s response. These are possible for directionally stable hull forms and small rudder angles. Large rudder angles may need to be applied when the ship is exposed large vessel dynamics which result from changes in the wind, waves and current. Moreover, changes in draft, speed and water depth can effect on relations between rudder angle and yaw rate. Adapted autopilot systems have numerous advantages such as a high precision of intended track, the rudder motions at small rudder angles during course keeping, the decreasing of
deviation in ship's bow even in strong environmental conditions (ABS, 2013).
The selection of steering strategies is less important for the adaptive system of the autopilot due to its ability to auto-tune to the weather and loading conditions. However, usually, autopilot adjustments including environmental conditions (wind, waves, and ocean current), ship draught, and water depth can have an impact on fuel savings. Autopilot adjustment decreases by 0.5-3% of fuel consumption (Buhaug et al., 2009).
2.1.3 Weather routing – safe and energy efficient route selection (WR)
Ship weather routing implies the determination of the optimum route based on the weather and ship characteristics for the designated voyage (Padhy et al., 2008; Sen and Padhy, 2010; Shao et al., 2012).
The route with safety and comfort (Maki et al., 2011; Kosmas and Vlachos, 2012), greatest energy efficiency (Dewit, 1990; Calvert et al., 1991; Sen and Padhy, 2010), least time consumption (Lunnon et al., 1992; Zhang et al., 2011), or the combinations of these factors (Padhy et al., 2008; Hinnenthal and Clauss, 2010) under various weather conditions are basic variables in determining the optimum route for the voyage. The objective of weather routing optimization is to offer a route with the minimum fuel consumption and earliest arrival time (Lin et al., 2013). In addition to its time saving advantages, the possible of implementing weather based routing provides fuel economy by up to 3% (Armstrong, 2013).
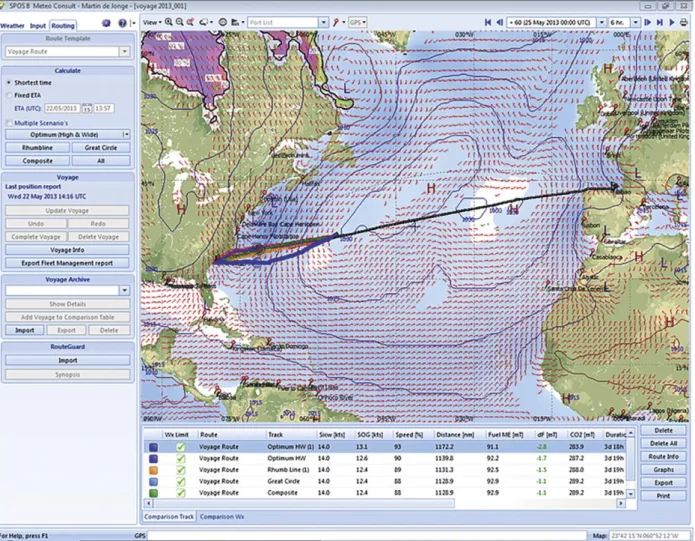
A number of companies are specialized to gather meteorological data, examine environmental conditions, assess ship responses in the projected situations and inform the proposed shipping route should be monitored taken into consideration weather conditions. Thus, these companies are providing weather routing services to the ships by e-mail or computer applications (Fig. 1.).
2.1.4 Trim and draft optimization (TDO)
Hull forms usually have been designed for specific drafts. These drafts at the proper trim can decrease the resistance of the ship hull and therefore fuel consumption. The best and worst trim condition has
impact on the required engine power by more than 10% (Mewis and Hollenbach, 2007).
Ship’captains and cargo planners take into consideration the appropriate distribution of cargo, ballast and consumables to provide the optimum draft and trim. Determining proper draft and trim for the assumed voyage generally necessitates monitoring tools (IMO, 2010). Required monitoring systems are able to offer the greatest energy efficient trim for an assumed draft and let adjusting ballast and other consumables to receive the benefit. By means of the implementation of proper software, it is possible to improve fuel economy up to 5% (Wartsila, 2008; Hochkirch and Bertram, 2010). Fig. 2. illustrates exemplary software that can be installed to the ships.
Performing trim optimization involves several operational risks and challenges arise from the oversights of bending moments and shear forces. Furthermore, some problems occur during the voyage such as the trim alterations owing to the consumed fuel and ballast, the ballast water exchange requirements and the monitor of ship in heavy weather conditions (Armstrong, 2013).
2.2 Hull and propeller condition management (HPCM)
The hull roughness of a ship is caused by physical or biological (fouling) factors (Fig. 3.). The physical roughness can occur for mechanical damage, adhesion-related failures (peeling, blistering, cracking, etc.) and/or incorrect application of a new coating (ABS, 2013).
Marine fouling (Biological roughness) is the unwanted growth of marine organisms on submerged surfaces. Marine fouling raises the frictional resistance of ship which accounts for nearly 80–90% of the total resistance for cargo ships and tankers and usually more than 50% for high speed craft (Lackenby, 1962). The marine fouling increases the required propulsive power of ships and accordingly their fuel consumption (Korkut and Atlar, 2012). Milne (1990) reported that fuel consumption of ships may reduce by up to 40% with antifouling irrespective of its type.
The amount of roughness differs in relation to the operational profile (i.e. ship speed and activity). For example, marine fouling usually appears in stagnant water particularly in the port area.
As a result, at the end of its 4-week wait in port, it is stated that ship’s resistance raised by 20%, causing in speed decrease by approximately 0.9 knots for the same power or its daily fuel consumption increased by 8 tons for the same speed (Munk, 2009).
2.2.1 Hull condition management (HCM)
Both physical and biological (fouling) hull roughness have major influences on a ship’s frictional resistance. For making the hull surface smoother, hull maintenance involving to refer both mechanical damages, failures and fouling should be established at appropriate intervals.
The purpose of underwater hull cleaning is to remove biological roughness or marine fouling. The cleaning procedure may need partial or overall maintenance depending upon the degree and type of fouling. The suitable maintenance schedule should be determined considering all operational and maintenance costs. From early times, there has been numerous of marine antifouling coating systems in combination with a number of toxic compounds such as; Arsenic, Zinc, Tin and Copper (Anderson et al., 2003). Self-Polishing Co-polymer (SPC) technology including Tri Butyl Tin (TBT-SPC) had been the greatest useful chemical method but International Maritime Organization (IMO) forbidden the use of TBT paints because of its damaging results (IMO, 2001). ‘‘Foul release’’ system is an alternative technology introduced in the early 1990s. This antifouling technology prevents the organisms' attachment and permits them to be removed by hydrodynamic shear forces (Korkut and Atlar, 2012).
2.2.2 Propeller condition management (PCM)
Roughness is noticed on the surface of the propeller mostly on the sharp parts. The main reasons of propeller surface roughness are fouling, corrosion, cavitation and impingement attack. In addition, inappropriate propeller maintenance including overspray from coating or hard use of the polishing can contribute surface roughness.
While propellers are commonly based on copper, fouling is still severe problems caused by some species (ABS, 2013). The economic return on the investment is resulted from propeller maintenance strategy.
Fig. 1. An exemplary software for weather routing (website, 2016)
Fig. 3. Surface roughness (Casse and Swain, 2006)
Fig 4. Snapshot from Flame diagnostic report
The propeller can be cleaned to prevent roughness. This way of polishing also reduce the attachment of microorganisms and accordingly the frictional resistance of the ship (Munk, 2009). On the other hand, the attachment of fouling organisms, the corrosion of ship hull and cavitation erosion can be prevented by applying coatings on propeller (Korkut and Atlar, 2012).
2.3 Engine maintenance onboard (EMO) 2.3.1 Main engine maintenance (MEM)
Ships generally operate at maximum continuous rating (MCR) power for the optimum range of 75-90% (Theotokatos and Tzelepis, 2013) and with constant revolutions per minute (RPM) instead of altering RPM in order to decrease fuel consumption.
Using automation systems for main engine provide the effective use of the main engine. Engine manufacturers suggest regular performance and maintenance standards which are vital for efficient engine operation (Ballou, 2013). Engine performance parameters are observed by real time monitoring tools.
These systems are also efficient in identifying and finding the solutions of maintenance and performance problems (Fig. 4.) (Armstrong, 2013).
The optimum adjusting of tuning parameters of main engine with the mainly used range of main engine load decrease the fuel consumption by up to 1%. Besides, approximately 0.1-0.2 g / kWh fuel economy is provided by a one bar raise in maximum cylinder pressure (Armstrong, 2013).
2.3.2 Auxiliary engine maintenance (AEM)
The auxiliary engine may be used to support main engine. In addition, it involves heat exchangers and compressed air or supports other items such as pumps, cargo and mooring winches, deck cranes, steering gears, ballast water arrangements, sewage systems and etc. (Molland, 2008). Auxiliary engines should have a performance tests and maintenance schedule according to manufactures and company standards.
Boilers are utilized in a variety of applications, including heating residual fuel and viscous cargo; hot water for crew/passengers, generating fresh water, driving steam turbines pumps and etc. Boilers should have a performance tests and maintenance as per manufactures and company standards. Planned Maintenance System (PMS) of shipping companies involves management of steam/combustion controls and maintenance of burners. Reducing overall steam consumption on-board have resulted with considerable fuel saving. Besides, the insulation of pipe and valve laggings can reduce thermal losses.
2.4 Fuel management (FM)
There are several types and classifications of fuels. The fuels have been classified in accordance with International Standard Organization (ISO) protocol ISO 8217(E) as amended in 2005 and 2010 and categorized depending on their ‘‘distillates’’ and ‘‘residuals’’. The use of low sulphur fuels rather than the use of high sulphur ones is essential to achieve the required sulphur emission levels (Ma et al., 2012; Yang et al., 2012). However, there is a vast price difference between the high and low sulphur bunker fuel oil which have an impact on operational and commercial decisions in maritime transportation (Schinas, 2013).
The great increase in fuel prices leads the shipping companies to cheaper options. Although there are operational difficulties, cheaper higher-viscosity bunker fuels, such as IFO, are usually preferred for providing economic benefits (Notteboom and Vernimmen, 2009). Large marine diesel engines are generally used for propulsion power, while the secondary electrical power is provided by auxiliary engines which typically use diesel oil. For this purpose, two types of fuel should be available on board: Fuel Oil and Diesel Oil (Stefanakos and Schinas, 2014). The sulphur content of fuel has been adopted with less than 1.5% for low sulphur oils according to international (Marpol Annex 6) and European environmental regulations.
In addition to deciding the optimum fuel type for ships, ordering the optimum bunker quantities is also significant in terms of ship energy efficiency. Fuel management strategies provides to order adequate amount of fuel which can be possible for records of fuel consumption by daily noon reports, monthly
reports or voyage reports etc. This also gives comparative fleet performance for shipping companies.
2.5 System energy management (other consumers) (SEM)
Optimizing of mechanical and electrical systems on-board are vital for ships. Alternatives for the reduction in power demand offer improvements in fuel economy (ABS, 2013).
Several auxiliary systems such as cooling-water pumps, ventilation fans, control and navigation systems requires the electrical power. For instance, bow thruster used by many ships to manoeuvre at low speeds needs a great power. Furthermore, cargo handling equipments generally require huge power during loading and discharging operations.
There are many implementations that affect fuel economy positively. These are process control and automation applications, automatic temperature control, control systems (automatic speed control for pumps and fans), automatically activates lighting, etc. 1-2% of total fuel saving can be accomplished through system energy management (Buhaug et al., 2009).
2.6 Increasing energy awareness (IEA)
Increasing energy awareness is an important measure to make individuals and departments’ with a high level of knowledge, skills and also greater motivation on routine operational tasks related to ship energy efficiency. On the other hand, the collaboration among various parties like ship owner, operator, charterer etc. is necessary for implementing ship energy efficiency measures. The stakeholders in the organisation should show the required expertise in energy efficiency in order to overcome problems in applying of measures. The parties for the ship energy efficiency are described below:
Ship owner: Ship owner should identify the best
decision via considering various parameters such as the investment decisions and operating costs linked to the implementation of new technologies and trends in energy efficiency measures. Nevertheless, it is generally hard and expensive to apply these technologies on existing ships. Moreover, with the regard of the investment risk, the potential returns of new applications are really low. Therefore, application of suitable technologies is more appropriate for new ships because of lower risk investment. By this way,
the ship owner should reduce fuel consumption by developing an operational efficiency for existing ships.
Ship operation: The owner or assigned to a
charterer is responsible for the ship operation. In cases where the ship is operated under a charter agreement, the charterer generally defrays the fuel and port expenses. Accordingly, the charterer controls the voyage information (load information, ETA and voyage planning, etc.). The operating and maintenance of ship, spare parts, and shipyard time and crew management are the issues under the control of the Operator. Those duties should be organized in cost effectively and timely manner. It also provides technical expertise within ship's operations.
Ship: The ship has responsibilities in SEEMP
implementation. There is a distribution of duties among the crew. So, each seafarer will contribute to energy efficiency through their expertises. The captain and the company should deliver a set of trainings which focus on increasing energy awareness.
The crew is in charge of various duties which may include optimal routing, trim, autopilot use, cargo and ballast tasks. Alternatively, ship operators and other parties are also responsible for increasing crew’s awareness in all related areas to provide optimum operation.
Other parties: Other parties include the cargo
owners, shipping agent, port authorities, brokers, weather routing services and other companies are the other related stakeholders.
One party’s disruption causes a domino effect that affects all of the other units. Therefore, awareness has become a vital issue which points the importance of all parties. In order to keep the disruption at a minimum level all parties should support each other, while they collaborate with each other. On the other hand, information sharing is also play a crucial role to decrease disruption.
3. Methodology
In many practical situations, humans generally fail to define their preferences precisely due to the vague characteristics of decision making problems. In order to cope with the ambiguity of human thinking, L. Zadeh (1965) first introduced the fuzzy set theory, which was oriented to the rationality of uncertainty
due to vagueness (Kahraman et al., 2004). Since expert opinion will be used in weighting the energy efficiency measurements, FAHP method is found as a proper method for this study.
The Analytic Hierarchy Process is one of the most widely used multiple-criteria decision making (MDCM) methods, and has been used to solve unstructured problems in various study fields such as political, economic, social and management sciences (Lee et al., 2008). However, this method is often criticized because of its inability to assign exact numerical values to the comparison judgements and being ineffective when applied to ambiguous problems. Since the conventional AHP still cannot provide sufficient guidance about the highly ambiguous world, some scholars have combined the Fuzzy theory with AHP method to handle fuzzy comparison matrices. One of these methods is Chang’s extend analysis method (Chang, 1996).
The fuzzy sets are briefly introduced below and basic steps of the Chang’s extent analysis method are explained in the following.
Table 1
Fuzzy expressions of linguistic terms (Ho et al, 2011)
3.1 Fuzzy sets and fuzzy numbers
Zadeh (1965) defined the concept of fuzzy sets - a fuzzy set is a class of objects with a continuum of grades of membership ranging between zero and one.
Linguistic scale Triangular fuzzy numbers Absolutely important (9, 9, 9) Intermediate (7, 8, 9) Very strong (6, 7, 8) Intermediate (5, 6, 7) Strong (4, 5, 6) Intermediate (3, 4, 5) Weak (2, 3, 4) Intermediate (1, 2, 3) Equally important (1, 1, 1)
If the assigned value is zero, the element does not belong to the set and if the value assigned is one, then the element belongs completely to the set (Buyukozkan and Ciftci, 2012). Lastly, the value which lies between 0 and 1 belongs to the fuzzy set only partially. A triangular fuzzy number (TFN) is represented with three points as follows.
( , , )
M
l m u
, where the parameters l,m,u,respectively, indicate the smallest possible value, the most promising value, and the largest possible value that describe a fuzzy event (Ghazikalayeh et al., 2013). A triangular membership function of M is described as equation 1. 0, , ( ) , 0, M x l x l l x m m l x u x m x u u m x u (1)
The following are the operations that can be performed on triangular fuzzy numbers (Gani, 2012). LetM (l m u1, 1, 1)and M2 (l m u2, 2, 2) then,
(i) Addition: (l1
l
2,,m1m2,u
1u
2) (ii) Subtraction: (l1l
2,,m1m2,u
1u
2) (iii) Multiplication: (l1l
2,,m1m2,u
1u
2) (iv) Division: 1 1 1 1 1 ( , , )1
1
1
lM
u
m
(2) In fuzzy sets theory, the value of fuzzy measures which are considered as a linguistic value can be converted into fuzzy numbers.Comparisons scale used in this paper is demonstrated in Table 1.
3.2 Fuzzy-AHP
The steps of Chang’s approach to handling fuzzy AHP are explained below.
Let U =
u u1, 2,...,um
be a goal set and X =
x x1, 2,...,xn
be an object set. After that each object is taken and extent analysis for every goal is conducted, respectively. Thus, m extent analysisvalues for each goal can be derived with the following signs: , i=1, 2,..., n, (3) where i j g M ( j= 1,2, ..., m) is triangular fuzzy number and
g
i is the corresponding goal.Step 1. The value of fuzzy synthetic extent with
respect to the ith object, Si, is determined as
1 1 i 1 1 i m n m j j i g g j i j
S
M
M
(4) In order to obtain 1 i m j jM
g
, the fuzzy additionoperation of m extent analysis values is performed such as 1 1 1 1
,
,
i m m m m j g j j j j j j jM
l
m
u
(5)The fuzzy addition operation of
i j g
M (j= 1,2,...,
m) values is performed to obtain
1 1 1
,
i n m j g i jM
as follows. 1 1 1 1 1,
,
i n m n n n j g i i i i j i i iM
l
m
u
(6)and then the inverse of the vector in Eq. (6) is computed as below. 1 1 1 1 1 1
1
1
1
,
,
i n m j g n n n i j i i i i i iM
u
m
l
(7) 1 2,
,...,
i i i m g g gM
M
M
2 2, 2, 2 1 1, 1, 1 M l m u M l m u is defined as (Kahraman et al., 2004)
1 2 2 1sup min
M( ),
M( )
y xV M
M
x
y
(8)It can be similarly defined as below.
2 1 1 2 1 2 2 2 1 1 1, if , 0, if , , ( ) ( ) m m l u l u otherwise m u m l (9)
where dis the ordinate of the highest intersection point between 1 M
and 2 M
, and hgt is the height. In order to compareM
1andM
2 both the values of
2 1
V M M and V M
1M2
are required.Step 3. The degree possibility for a convex fuzzy
number to be greater than k convex fuzzy numbers
M
i (i = 1, 2,. . . ,k) can be defined by
1, 2, ..., 1 and ( 2) .. and ( ) min ( ), = 1,2,3, ..., . i k k V M M M M V M M M M M M V M M i k (10) Suppose that(
i) min (
i k)
d A
V S
S
k=1, 2,....,n; k≠I (11)Then the weight vector is defined by
1 2
= (d (A ), d (A ), ..., d (A ))n T
W , (12)
where
A
i(i=1, 2, ..., n) are n elements.Step 4. Via normalization, the normalized weight
vectors are
1 2
= (d (A ), d (A ), ..., d (A ))
n TW
(13)where W is a non-fuzzy number.
4. Results
In this paper, we conducted questionnaires to twenty experts from various shipping companies. The experts are ship captains, chief engineers and representatives of companies who have at least over 10 and 15 years experience on board a ship. The experts are asked to compare six main criteria and nine sub-factors in the scope of this study (Table 2). The results of questionnaire analysed by using Fuzzy-AHP method are presented in this section.
We made pair-wise comparisons of six criteria to assess ship operational energy efficiency measures within the scope of SEEMP against high oil prices and environmental concerns. Table 3 shows the Fuzzy triangular numbers used in the paper.
Table 4 shows the fuzzy evaluation matrix and local weights with response to the goal. Voyage Performance Management, Hull and Propeller
Condition Management, Engine Maintenance
Onboard, Fuel Management, System Energy
Management, Increasing Energy Awareness stand for VPM, HPCM, EMO, FM, SEM and IEA, respectively.
2 1
(
1 2)
M2( )
Local weights of the main factors are calculated by using the fuzzy comparison values illustrated in Table 4. First of all, the synthetic extent values of six criteria are determined as follow.
SVPM= (12.23, 14.60, 17.03) (1/66.68, 1/56.69, 1/47.29) = (0.18, 0.26, 0.36) SHPCM= (10.87, 13.09, 15.45)(1/66.68, 1/56.69, 1/47.29) = (0.16, 0.23, 0.33) SEMO= (11.29, 13.84, 16.46) (1/66.68, 1/56.69, 1/47.29) = (0.17, 0.24, 0.35) SFM= (6.42, 7.77, 9.26) (1/66.68, 1/56.69, 1/47.29) = (0.10, 0.14, 0.20) SSEM= (4.24, 4.89, 5.65) (1/66.68, 1/56.69, 1/47.29) = (0.06, 0.09, 0.12) SIEA= (2.25, 2.49, 2.84) (1/66.68, 1/56.69, 1/47.29) = (0.03, 0.04, 0.06)
We calculated the minimum degree possibility d’(Ai)of
(
V S
i
S
k)
for k=1,2,....,n; k≠i 1 2 3 4 5 6 (1) min (S , , , , ) min(1.00,1.00,1.00,1.00,1.00) D V S S S S S Table 4Local weights and pair-wise comparison of factors
VPM HPCM EMO FM SEM IEA Local
weights VPM (1,00 1,00 1,00) (1,21 1,52 1,85) (1,92 2,39 2,87) (1,95 2,41 2,87) (2,92 3,52 4,13) (3,24 3,76 4,31) 0,35 HPCM (0,54 0,66 0,83) (1,00 1,00 1,00) (1,55 1,81 2,08) (1,99 2,45 2,91) (2,89 3,61 4,36) (2,89 3,56 4,26) 0,29 EMO (0,35 0,42 0,52) (0,48 0,55 0,65) (1,00 1,00 1,00) (3,21 3,97 4,73) (2,87 3,68 4,48) (3,37 4,23 5,08) 0,33 FM (0,35 0,42 0,51) (0,34 0,41 0,50) (0,21 0,25 0,31) (1,00 1,00 1,00) (2,25 2,76 3,28) (2,27 2,94 3,65) 0,03 SEM (0,24 0,28 0,34) (0,23 0,28 0,35) (0,22 0,27 0,35) (0,30 0,36 0,45) (1,00 1,00 1,00) (2,24 2,70 3,17) 0,00 IEA (0,23 0,27 0,31) (0,23 0,28 0,35) (0,20 0,24 0,30) (0,27 0,34 0,44) (0,32 0,37 0,45) (1,00 1,00 1,00) 0,00 Table 5
Weights and comparison matrices of VPM sub-factors
SO AI WR TDO Local weights
SO (1,00 1,00 1,00) (6,00 7,00 8,00) (5,00 6,00 7,00) (3,00 4,00 5,00) 0,94 AI (0,13 0,14 0,17) (1,00 1,00 1,00) (0,33 0,50 1,00) (0,20 0,25 0,33) 0,00 WR (0,14 0,17 0,20) (1,00 2,00 3,00) (1,00 1,00 1,00) (0,25 0,33 0,50) 0,00 TDO (0,20 0,25 0,33) (3,00 4,00 5,00) (2,00 3,03 4,00) (1,00 1,00 1,00) 0,06
2 1 3 4 5 6 (2) min (S , , , , ) min(0.84,0.92,1.00,1.00,1.00) D V S S S S S 3 1 2 4 5 6 (3) min (S , , , , ) min(0.93,1.00,1.00,1.00,1.00) D V S S S S S 4 1 2 3 5 6 (4) min (S , , , , ) min(0.09,0.26,0.20,1.00,1.00) D V S S S S S 5 1 2 3 4 6 (5) min (S , , , , ) min(0.00,0.00,0.00,0.31,1.00) D V S S S S S 6 1 2 3 4 5 (6) min (S , , , , ) min(0.00,0.00,0.00,0.00,0.00) D V S S S S S
The normalized weight vector is calculated as Wfactors=
(0.35, 0.29, 0.33, 0.03, 0.00, 0.00)T.
The final weights of the six criteria, VPM, HPCM, EMO, FM, SEM and IEA, are 0.35, 0.29, 0.33, 0.03, 0.00 and 0.00, respectively. In the six criteria, VPM,
HPCM and EMO are the most preferred criteria comparing with the other criteria.
The local weights of the sub-factors are calculated in a similar way, as shown above. Table 5 shows the fuzzy evaluation matrix and local weights of sub-factors of Voyage Performance Management with response to the goal. Speed Optimization, Autopilot Improvements, Weather Routing and Trim and Draft Optimization stand for SO, AI, WR and TDO, respectively.
Table 6 shows the fuzzy evaluation matrix and local weights of sub-factors of Hull and Propeller Condition Management. Hull Condition Management and Propeller Condition Management stand for HCM and PCM, respectively.
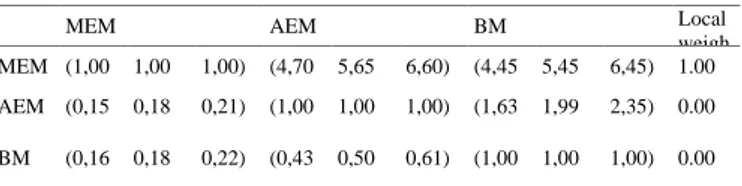
Table 7 shows the fuzzy evaluation matrix and local weights of sub-factors of Engine Maintenance Onboard. Main Engine Maintenance, Auxiliary Engine Maintenance and Boiler Maintenance stand for MEM, AEM and BM, respectively.
Computed global weights of sub-factors are shown in Table 8.
5. Discussion
The results of the study show that VPM (0.35), EMO (0.33) and HPCM (0.29) are the most preferred criteria compared to the other main criteria. Therefore, these criteria are the key operational factors that should be considered for overall ship energy efficiency management. When examining the sub-factors of these criteria, it is seen that they all spread over a large area and affect many different energy-saving operational decisions. These main criteria are followed by FM which is obtained low score (0.03). Deciding the optimal fuel type for ships and ordering the sufficient quantities of fuel which are included within the scope of FM criteria are also important for ship energy efficiency. However, strict environmental requirements for the content of sulphur enforced by international and European environmental regulations involve many parts of the sailing areas all over the world, so this causes limitations to determine the optimal fuel type for operating companies and ship owners, and thus apply this measure (Fuel management) in effectively.
Although System Energy Efficiency (SEM) and Increasing the Energy Awareness (IEA) are
Table 6
Local weights and comparison matrices of HPCM sub-factors
HCM PCM Local weights HCM (1,00 1,00 1,00) (3,35 3,95 4,45) 1,00
PCM (0,22 0,25 0,30) (1,00 1,00 1,00) 0,00
Table 7
Local weights and comparison matrices of EMO sub-factors
MEM AEM BM Local weigh ts MEM (1,00 1,00 1,00) (4,70 5,65 6,60) (4,45 5,45 6,45) 1.00 AEM (0,15 0,18 0,21) (1,00 1,00 1,00) (1,63 1,99 2,35) 0.00 BM (0,16 0,18 0,22) (0,43 0,50 0,61) (1,00 1,00 1,00) 0.00 Table 8
Computed global weights for sub-factors
Factor Sub factor Local Weights Global weights VPM (0.35) SO 0.94 0.33 AI 0.00 0.00 WR 0.00 0.00 TDO 0.06 0.02 HPCM (0.29) HCM 1.00 0.29 PCM 0.00 0.00 EMO (0.33) MEM 1.00 0.33 AEM 0.00 0.00 BM 0.00 0.00 FM (0.03) SEM (0.00) IEA (0.00)
undoubtedly important criteria, the obtained results for them with zero point refer that they have less contribution on ship operational energy efficiency than other main criteria. System Energy Efficiency which includes also other consumers, optimal operation of mechanical and electrical systems on-board ship constitute small parts of the total fuel consumption compared to the contribution from others. For this reason, experts give less importance to the implementation of this measure due to the low contribution of fuel savings from other on-board systems. Similarly, the criterion of increasing the energy awareness has zero point, which is actually seen as very important by on-board crew (Banks et al., 2014). This is an ordinary consequence and a gap with Fuzzy-AHP approach. If a criterion is absolutely not important than all of the others in its level, this criteria has zero weight even it is handled for the decision making process. Therefore fuzzy-AHP totally neglects the criterion which is less important than the others and lets the decision maker to focus on the more important criteria (Özdağoğlu and Özdağoğlu, 2007). However, it is important to consider all of these factors together for maximum gain.
The analysis results of sub-factors of VPM show that SO (0.94) has the highest value, followed by TDO (0.06). Johnson et al. (Johnson et al., 2014) has also stated similar value in speed optimization. According the analysis results of sub-factors, the implementation of SO (0.94) is the most important operational measure. The results are compatible with the results of the Bazari and Longva (Bazari and Longva, 2011) and speed reduction has the largest effect on lowering carbon emissions. Autopilot adjustments have not been carried out and recorded properly by the shipping companies towards energy efficient operations. Therefore, the possible advantages of autopilot settings with regard to develop an energy efficiency strategy has not been recognized by many companies. Weather routing is impossible in heavy traffic or narrow channels. This measure is only applicable in open seas but it may increase the sailing distance and time spent on sailing.
The results of sub-factors of HPCM indicate that HCM has the highest score (1.00). The effect of hull condition could be more important than the propeller surface condition. However, propeller maintenance would be essential in terms of energy loss per unit area (Mosaad, 1986).
MEM (1.00) plays a very important part of the fuel savings. In a report to the IMO by Bazari and Longva (2011), it was shown that main engine tuning and monitoring provides benefits of reducing the carbon emission potential.
6. Conclusions and future work
Lowering fuel consumption has become a fundamental issue due to the economic and environmental problems. The potential for fuel savings in shipping is achievable through implementation of ship energy efficiency measures.
We focused on the operational energy efficiency measures within the scope of SEEMP and prioritize them using the fuzzy AHP approach, which is a multiple criteria decision making method. Fuzzy AHP properly reflects the vagueness associated with human thoughts. The advantage of using a fuzzy approach is to assign the relative importance of attributes using fuzzy numbers instead of precise numbers. Multiple criteria decision making techniques based on Fuzzy AHP helps to choose a best decision-making strategy using a weighting process through pair wise comparisons.
The results of this research can provide decision makers (ships' masters, operating companies and ship owners) with the strategic approach for selecting the most effective measures and producing an energy efficient solution for the shipping industry. With the help of such decision-making tools shipping industry can establish and evaluate the priority and efficiency of the operational energy efficiency measures against possible future rise in fuel prices and carbon emissions.
The research area will be extended by using another multiple criteria decision making approach such as TOPSIS (Technique for order preference by similarity to the ideal solution) and upgrade the operational energy efficiency measures in the sector of shipping industry. For further study, it is planned to measure ship operational energy efficiency criteria using reel ship operating data derived from shipping company using decision support systems.
Acknowledgement
Elif BAL acknowledges support from Scientific and Technical Research Council of Turkey (TUBİTAK) for a 2214/A-International Research Fellowship Programme and BAP-ITU(Scientific and Projects-ITU).
References
ABS Report.Ship Energy Efficiency Measures., 2013. Anderson, C.A., Atlar, M., Callow, M., Candries, M., Milne, A., Townsin, R.L., 2003. The development of foul release coatings for seagoing vessels. J. Mar. Des. Oper., Proc. IMarEST Part B, 11–23.
Andreou, A. S., Leonidou, C., Chrysostomou, C., Pitsillides, A., Samaras, G., Schizas, C. N., Mavromous, S. M., 2005. Key issues for the design and development of mobile commerce services and applications. International Journal of Mobile Communications 3(3), 303-323.
Armstrong, N.V., 2013. Review- Vessel optimisation for low carbon shipping, Ocean Engineering 73, 195– 207.
Ballou, P. 2103. Ship energy efficiency management requires a Total Solution approach. Marine Technology Society (MTS) Journal, Vol. 47 No. 1. MTS, Washington D.C., Jan-Feb 2013. pp. 83-95. Banks, C., Turan, O., Incecik, A., Lazakis, I., Lu, R., 2014. ‘Seafarers’ current awareness Knowledge, Motivation and Ideas towards Low Carbon-Energy Efficient Operations, Journal of Shipping and Ocean Engineering April 4(3-4, 93-109.
Bausch, D.O., Brown, G.G., Ronen, D., 1998. Scheduling short term marine transport of bulk products. Maritime Policy & Management 25 (4), 335–348.
Bazari, Z., Longva, T. 2011. Assessment of IMO
Mandated Energy Efficiency Measures for
International Shipping. MEPC 63/INF.2.International Maritime Organization, London, UK.
Buhaug, Ø., Corbett, J.J., Endresen, Ø., Eyring, V., Faber, J., Hanayama, S., Lee, D.S., Lee, D., Lindstad, H., Markowska, A.Z., Mjelde, A., Nelissen, D., Nilsen, J., Pålsson, C., Winebrake, J.J., Wu, W.–Q., Yoshida, K., 2009. Second IMO GHG study International Maritime Organization, London, UK. Buyukozkan, G., G. Ciftci A., 2012. Combined fuzzy AHP and fuzzy TOPSIS based strategic analysis of electronic service quality in healthcare industry, Expert Systems with Applications 39(3), 2341-2354. Calvert S, Deakins E, Motte R., 1991. A dynamic system for fuel optimization Trans Ocean.Journal of Navigation 44, 233–65.
Cariou, P., 2011. Notes and comments, Is slow steaming a sustainable means of reducing CO2 emissions from container shipping? Transportation Research Part D 16, 260–264.
Casse, F., Swain, G.W., 2006. The development of microfouling on four commercial antifouling coatings under static and dynamic immersion, International Biodeterioration and Biodegradation, 179-185.
Chang, C.C.; Chang, C.H., 2013. Energy conservation for international dry bulk carriers via vessel speed reduction. Energy Policy 59, 710–715.
Chang, D.Y., 1996. Applications of the extend analysis method on fuzzy AHP, European journal of Operational Research 95, 649-655.
Christiansen, M., Fagerholt, K., 2004. Ronen, D. Ship routing and scheduling: status and perspectives. Transportation Science 38 (1), 1–18.
Cicek, K., Celik, M., 2009. Multiple attribute decision-making solution to material selection problem based on modified fuzzy axiomatic design-model selection interface algorithm. Materials and Design 31 (2010) 2129–2133.
Corbett, J.J., Wang, H., Winebrake, J.J., 2009. The effectiveness and costs of speed reductions on emissions from international shipping. Transportation Research Part D 14, 593–598.
Cullinane, K., Khanna, M., 2000. Economies of scale in large containerships: optimal size and geographical implications. Journal of Transport Geography 8 (3), 181–195.
Dewit C., 1990. Proposal for low-cost ocean weather routeing. Journal of Navigation 43, 428–39.
DNV, 2010. Pathways to low carbon shipping, abatement potential towards 2030.〈www.dnv.com〉. Du, Y., Chen, Q., Quan, X., Long, L., Fung, R.Y.K., 2011. Berth allocation considering fuel consumption and vessel emissions. Transportation Research E 47, 1021–1037.
Ergu, D., Kou, G., Shi, Y., Shi, Y., 2014. Analytic network process in risk assessment and decision analysis. Computers & Operations Research 42, 58– 74.
Faber, J., Nelissen, D., Hon, G., Wang, H. and Tsimplis, M., 2012. Regulated Slow Steaming in
Maritime Transport: An Assessment of Options, Costs and Benefits. 7.442.1.
Fagerholt, K., Laporte, G., Norstad, I., 2010. Reducing fuel emissions by optimizing speed on shipping routes. Journal of the Operational Research Society 61, 523–529.
Gani, A.N., 2012. A New Operation on Triangular
Fuzzy Number for Solving Fuzzy Linear
Programming Problem, Applied Mathematical Sciences 6(11), 525 – 532.
Gelareh, S., Nickel, S., Pisinger, D., 2010. Liner shipping hub network design in a competitive environment. Transportation Research Part E 46 (6), 991–1004.
Gelareh, S., Pisinger, D. 2011. Fleet deployment, network design and hub location of liner shipping companies. Transportation Research Part E 47 (6), 947–964.
Ghazikalayeh, A. R., M. Amirafshari , H.M. Mkrchyan, M. Taji., 2013. Application of Fuzzy Hybrid Analytic Network Process in Equipment Selection of Open-Pit Metal Mines. International Journal of Research in Industrial Engineering 2(3), 35-46.
Golias, M.M., Boile, M., Theofanis, S., Efstathiou, C., 2010. The berth scheduling problem: maximizing berth productivity and minimizing fuel consumption and emissions production. Transportation Research Record 2166, 20–27.
Golias, M.M., Saharidis, G.K., Boile, M., Theofanis, S., Ierapetritou, M.G., 2009. The berth allocation problem: optimizing vessel arrival time. Maritime Economics and Logistics 11, 358–377.
Hansen, H., Freund, M., 2010. Assistance tools for operational fuel efficiency, 9th Conf. Computer and IT Applications in the Maritime Industries (COMPIT), Gubbio.
Harilaos N. Psaraftis, H.N., Kontovas, C.A., 2013. Overview Paper Speed models for energy-efficient maritime transportation: A taxonomy and survey. Transportation Research Part C 26, 331–351.
Harvald, S., 1977. Prediction of Power of Ships, Lyngby, Denmark: Department of Ocean Engineering, Technical University of Denmar.
Hinnenthal J, Clauss G., 2010. Robust pareto-optimum routing of ships utilising deterministic and ensemble weather forecasts. Ships and Offshore Structures 5:105–14.
Ho, Chao Chung, 2011. Optimal evaluation of infectious medical waste disposal companies using the fuzzy analytic hierarchy process, Waste Management 31(7), 1553-1559.
Hochkirch, K., Bertram,V., 2010. Fluid Dynamic Options for Reducing CO2 Emissions. 7th Annual Green Ship Technology Conference, 16-17th March, Copenhagen, Denmark.
IEA, 2009. World Energy Outlook. International Energy Agency Publications, Paris.
IMO, 2009. Resolution MEPC (200)
MEPC.1Circ.684, Guidelines for the voluntary use of the ship energy efficiency operational indicator (EEOI).
IMO, 2011. Resolution MEPC.203 (62), MEPC 62/24/Add.1 Annex 19. Amendments to the Annex of the Protocol Of 1997 To Amend The International Convention for the Prevention Of Pollution From Ships, 1973, As Modified by the Protocol Of 1978 Relating Thereto.
IMO, 2001. IMO Adopts Convention on Control of Harmful Anti-Fouling Systems on Ships. Briefing 27/2001. International Maritime Organization, London. http://www.imo.org/.
IMO, 2010. MEPC 61/INF.18, 23 July 2010. Reduction of GHG Emissions From Ships. Marginal Abatement Costs and Cost-Effectiveness Of Energy-Efficiency Measures.
Johnson, H., Johansson, M., Andersson, K., 2014. Barriers to improving energy efficiency in short sea shipping: an action research case study. Journal of Cleaner Production 66, 317-327.
Kabir, G., Hasin, M. A. A.,2011. Evaluation of customer oriented success factors in mobile commerce using fuzzy AHP. Engineering and Management 4(2), 361-386.
Kahraman, C., U. Cebeci and D. Ruan., 2004. Multi-attribute comparison of catering service companies using fuzzy AHP: The case of Turkey, International Journal of Production Economics 87, 171-184.
Konidari P, Mavrakis D., 2007. A multi-criteria evaluation method for climate change mitigation policy instruments. Energy Policy 35, 6235–57.
Korkut, E., Atlar, M., 2012. An experimental investigation of the effect of foul release coating application on performance, noise and cavitation characteristics of marine propellers, Ocean Engineering 41, 1–12.
Kosmas OT, Vlachos DS., 2012. Simulated annealing for optimal ship routing.Computers & Operations Research 39:576–81.
Lackenby, H., 1962. Resistance of ships with special reference to skin friction and hull surface condition. The 34th Thomas Lowe Gray Lecture, Proceedings of the Institution of Mechanical Engineers 176, 981– 1014.
Lee, A. H. I., W. C. Chen, C. J. Chang., 2008. A Fuzzy AHP and BSC approach for evaluating performance of IT department in the manufacturing industry in Taiwan. Expert Systems with Applications 3496-107 doi:10.1016/j.eswa.2006.08.022.
Lee, C.-Y., Lee, H.L., Zhang, J., 2012. Optimal schedule planning with service level constraint for ocean container transport. Working paper, Hong Kong University of Science and Technology.
Lee, S.K., Mogi, G., Hui, K.S., 2013. A fuzzy analytic hierarchy process (AHP)/data envelopment analysis (DEA) hybrid model for efficiently allocating energy R&D resources: In the case of energy technologies against high oil prices. Renewable and Sustainable Energy Reviews 21, 347–355.
Lee, S.K., Mogi, G., Lee, S., Kim, J.W., 2011. Prioritizing the weights of hydrogen energy technologies in the sector of the hydrogen economy by using a fuzzy AHP approach, international journal of hydrogen energy 36: 1897–1902.
Lin, Y.H., Fang, M.C., Yeung, R.W., 2013. The optimization of ship weather-routing algorithm based on the composite influence of multi-dynamic elements. Applied Ocean Research 43, 184–194. Lindstad, H., Jullumstrø, E., Sandaas, I., 2013. Reductions in cost and greenhouse gas emissions with new bulk ship designs enabled by the Panama Canal expansion. Energy Policy 59, 341–349.
Lindstad, H., Asbjørnslett, B.E., Strømman, A.H., 2011. Reductions in greenhouse gas emissions and
cost by shipping at lower speed. Energy Policy 39, 3456–3464.
Lindstad, H., Asbjørnslett, B.E., Strømman, A.H., 2012. The Importance of economies of scale for reductions in greenhouse gas emissions from shipping. Energy Policy 46, 386–398.
Longva, T., Eide, M.S., Skjong, R., 2010. A cost– benefit approach for determining a required CO2 Index level for future ship design. Maritime Policy and Management 37 (2), 129–143.
LunnonRW, Marklow AD., 1992. Optimization of time saving in navigation through an area of variable flow.Journal of Navigation 45, 384–99.
Ma, H., Steernberg, K., Riera-Palou, X., Tait, N., 2012. Well-to-wake energy and greenhouse gas analysis of SOx abatement options for the marine industry. Transport. Res. Part D 17, 301–308.
Maki A, Akimoto Y, Nagata Y, Kobayashi S, Kobayashi E, Shiotani S., 2011. A new weather-routing system that accounts for ship stability based on a real-coded genetic algorithm. Journal of Marine Science and Technology 16, 311–22.
Meng, Q., Wang, S., 2011. Liner shipping service network design with empty container repositioning. Transportation Research Part E 47, 695–708.
Meng, Q., Wang, S., 2011. Optimal operating strategy for a long-haul liner service route. European Journal of Operational Research 215, 105–114.
Mewis, F., Hollenbach, U., 2007.
HydrodynamischeMaßnahmenzurVerringerung des EnergieverbrauchesimSchiffsbetrieb, Hansa 144/5:49-58.
Milne, A., 1990. Roughness and drag from the marine paint chemist’s viewpoint. Marine Roughness and Drag Workshop Paper 12, London.
Molland, A.F., 2008. The Maritime Engineering Reference Book: A Guide to Ship Design, Construction and Operation.
Mosaad, M., 1986. Marine propeller roughness penalties. Ph.D. Thesis. University of Newcastle upon Tyne, UK.
Munk, T., 2009. A CO2 Maintenance Index (Hull and Propeller Performance), Ship Efficiency Conference, September, Hamburg.
Norlund, E.K., and Gribkovskaia , I., 2013. Reducing emissions through speed optimization in supply vessel operations, Transportation Research Part D 23, 105– 113.
Norstad, I.,Fagerholt, K. and Laporte, G., 2011. Tramp ship routing and scheduling with speed optimization. Transportation Research Part C 19, 853– 865.
Notteboom, T., Vernimmen, B., 2009. The effect of high fuel costs on liner service configuration in container shipping, Journal of Transport Geography 17(5), 325-337.
Notteboom, T.E., 2006. The time factor in liner shipping services. Maritime Economics and Logistics 8, 19–39.
Özdağoğlu, A., Özdağoğlu, G., 2007. Comparison of AHP and Fuzzy AHP for the Multi Criteria Decision Making Processes With Linguistic Evaluations. İstanbul Ticaret Üniversitesi Fen Bilimleri Dergisi 6 (11), 65-85.
PadhyCP, Sen D, Bhaskaran PK., 2008. Application of wave model for weather routing of ships in the North Indian Ocean. Natural Hazards 44: 373–85. Psaraftis, H., Kontovas, C., 2010. Balancing the economic and environmental performance of maritime transportation. Transportation Research Part D 15, 458–462.
Psaraftis, H.N., Kontovas,C.A., Kakalis, M.P., 2009. Speed reduction as an emissions reduction measure for fast ships. In: The 10th International Conference on Fast Sea Transportation, Athens, Greece, October. Qi, X., Song, D.P., 2012. Minimizing fuel emissions by optimizing vessel schedules in liner shipping with uncertain port times. Transportation Research Part E 48, 863–880.
Ronen, D., 2011. The effect of oil price on containership speed and fleet size. Journal of the Operational Research Society 62, 211–216.
Ronen, D., 1982. The effect of oil price on the optimal speed of ships. Journal of the Operational Research Society 33, 1035–1040.
Saaty TL., 1980. The analytic hierarchy process. 1st ed. New York: McGraw-Hill.
Schinas, O., 2013. The issue of air emissions: policy and operational considerations. In: Xu, J. (Ed.),
Contemporary Marine and Maritime Policy. Nova Science Publishers.
Sea at Risk and CE Delft., 2010. Going Slow to Reduce Emissions.〈www.seas-at-risk.org〉.
Sen D, Padhy CP., 2010. Development of a ship weather-routing algorithm for specific application in North Indian Ocean region. In: The international conference on marine technology. Dhaka, Bangladesh: BUET, 21–7.
Senol, Y.E., Aydogdu, Y.V., Sahin, B., Kilic, B., 2015. Fault Tree Analysis of chemical cargo contamination by using fuzzy approach. Expert Systems with Applications 42 (2015) 5232–5244. Shao W, Zhou PL, Thong SK., 2012. Development of a novel forward dynamic programming method for weather routing. Journal of Marine Science and Technology 17, 239–51.
Shintani, K., Imai, A., Nishimura, E., Papadimitriou, S., 2007. The container shipping network design problem with empty container repositioning. Transportation Research Part E 43 (1), 39–59.
Soner, O., Asan, U., Celik, M., 2015. Use of HFACS– FCM in fire prevention modelling on board ships. Safety Science77 (2015) 25–41.
Song, D.P., Xu, J.J., 2012. CO2 emission comparison between direct and feeder liner services: a case study of Asia–Europe services interfacing with the UK. International Journal of Sustainable Transportation 6 (4), 214–237.
Stefanakos, C.N., Schinas, O., 2014. Forecasting bunker prices; A nonstationary, multivariate methodology, Transportation Research Part C 38, 177–194.
Stopford, M., 1999. Maritime Economics, Second Edition Routeledge, London.
Theotokatos, G., Tzelepis, V. A, 2013. Computational study on the performance and emission parameters mapping of a ship propulsion system, the Maritime Environment Engineers, Part M: Journal of Engineering for Proceedings of the Institution of Mechanical.
Topcu, Y. I., Burnaz, S., 2006. A multiple criteria decision making approach for the evaluation of retail location. Paper presented at the 18th International
Conference on Multiple Criteria Decision Making, Chania, Greece, June.
UNCTAD (Ed.), 2009. Maritime Transport and the Climate Change Challenge. Multi-Year Expert Meeting on Transport and Trade Facilitation. Organization United Nations Conference on Trade and Development. United Nations Conference on Trade and Development, Geneva.
UNCTAD, 2015. Review of Maritime Transport. Wang, S., Meng, Q., 2012a. Sailing speed optimization for container ships in a liner shipping network. Transportation Research Part E 48, 701–714. Wang, S., Meng, Q., 2012b. Liner ship fleet deployment with container transshipment operations. Transportation Research Part E 48 (2), 470–484. Wang, S., Meng, Q., 2011. Schedule design and container routing in liner shipping. Transportation Research Record 2222, 25–33.
Wang, S., Wang, T., Meng, Q., 2011. A note on liner ship fleet deployment. Flexible Services and Manufacturing Journal 23 (4), 422–430.
Wartsila. 2008. Boosting Energy Efficiency.
Wijnolst, N., T. Wergeland, 1997. Shipping. Delft, the Netherlands, Delft University Press.
Yang, Z., Zhang, D., Caglayan, O., Jenkinson, I., Bonsall, S., Wang, J., Huang, M., Yan, X., 2012. Selection of techniques for reducing shipping NOx and SOx emissions. Transport. Res., Part D 17, 478– 486.
Zadeh, L.A, 1965. Fuzzy sets, Information and Control 8, 338–353.
Zhang LH, Zhang L, Peng RC, Li GX, Zou W., 2011. Determination of the shortest time route based on the composite influence of multidynamic elements. Marine Geodesy 34, 108–18.