KADIR HAS UNIVERSITY
GRADUATE SCHOOL OF SCIENCE AND ENGINEERING
SERVICE GRANULARITY IN SERVICE ORIENTED
ARCHITECTURE
MASTER OF SCIENCE THESIS
CĠHAN TAġKIN
ISTANBUL, TURKEY February, 2012
S tudent’ s F ull Na me: C ĠH AN TAġKI N M.S c. The sis 2012 S tudent’ s F ull Na me P h.D. ( or M.S . or M.A .) The sis 20 11
SERVICE GRANULARITY IN SERVICE ORIENTED
ARCHITECTURE
CĠHAN TAġKIN
Submitted to the Graduate School of Science and Engineering in partial fulfillment of the requirements for the degree of
Master of Science in
Computer Engineering
KADĠR HAS UNIVERSITY February, 2012
KADĠR HAS UNIVERSITY GRADUATE SCHOOL OF SCIENCE AND ENGINEERING
SERVICE GRANULARITY IN SERVICE ORIENTED ARCHITECTURE
CĠHAN TAġKIN
APPROVED BY:
Assistant Prof. Dr. Arif Selçuk ÖĞRENCĠ ___________________ Kadir Has University
(Thesis Supervisor)
Assistant Prof. Dr. Osman Kaan EROL ___________________ Istanbul Technical University
Assistant Prof. Dr. Taner ARSAN ___________________ Kadir Has University
APPROVAL DATE: / /2012
2
SERVICE GRANULARITY IN SERVICE ORIENTED ARCHITECTURE
Abstract
Today, technology brings with it innovations. One of those innovations is Service Oriented Architecture (SOA). The importance of finding optimum in service granularity increases day by day as SOA becomes more popular.
Although, there are many quests about this issue, finding optimum in service granularity still cannot be made certain. Therefore, we tried to create a new framework that uses inputs, outputs (I/O), enterprise service bus (ESB) and execution cost metrics to find an optimum in service granularity. By using our framework, we aimed to find minimum costs for all clustering samples and then decided for the optimum cluster in these minimum clusters.
During our investigation, we used Monte Carlo Simulation Method to perform an experiment while we took advantages of previous researches. In our experiment, we randomly generated 100 clustering samples for 50 services by using Monte Carlo Simulation Method. In the end of our experiment, we obtained different results by using I/O, ESB and execution metrics.
As a result, we have found the optimum service granularity by comparing the I/O, ESB and execution costs of these optimal services. Thus, we have seen on the graphs that we got from our experiment, the enterprise service bus has an important effect on SOA projects for defining the optimum service granularity.
Keywords: Optimum Service Granularity, Service Oriented Architecture (SOA), Clustering, Monte Carlo Method
3
SERVIS ODAKLI MĠMARĠLERDE SERVĠS BÜYÜKLÜKLERĠ
Özet
Günümüz teknolojisi beraberinde yenilikler getirmektedir. Bu yeniliklerden bir tanesi de Servis odaklı mimarilerdir. Servis odaklı mimarilerin hayatımıza girmesi ile birlikte optimum servis büyüklüğünü bulmak da önem kazanmaktadır.
Servis büyüklüğünü bulmak için yapılan araĢtırmalar hala güvenilir bir sonuç vermemektedir. Bu neden ile projemiz çerçevesinde input/output, ESB ve Servis çalıĢma süresini baz alan yeni bir yapı tanımladık. Amacımız, yarattığımız yeni yapıyı kullanarak, bütün küme (cluster) örnekleri için minimum maliyeti bularak, bulduğumuz minimum maliyetli kümelerin içerisinden en düĢük maliyete sahip olan kümeyi tespit etmektir.
ÇalıĢmalarımız süresince geçmiĢ araĢtırmalardan faydalanıp, Monte Carlo simülasyon programını kullanarak deneyler yaptık. Deneylerimiz süresince, rastgele 50 servis ve herbir küme için rastgele 100 küme örneği yarattık. Deneylerimizin sonucunda Input/Output, ESB ve Servis çalıĢma süresi faktörlerini kullanarak farklı sonuçlar elde ettik.
Sonuç olarak, bulduğumuz optimal servislerin Input/Output, ESB ve servis çalıĢma süresi maliyetlerini karĢılaĢtırarak, en uygun servis büyüklüğünü bulduk. Yaptığımız deneylerin sonucunda oluĢan grafiklerden, ESB’nin servis odaklı projelerde optimum servis büyüklüğünü bulmak için önemli bir etkisi olduğunu gördük.
4
Acknowledgements
During the development of my graduate studies at Kadir Has University several people and institutions collaborated directly and indirectly with my research.
I would never have been able to finish my dissertation without the guidance of my advisor Assistant Prof. Dr. Arif Selçuk Öğrenci and support from my family, friends and wife.
I would like to express my deepest gratitude to my advisor for his excellent guidance, caring, patience while doing my research. Also, thanks to all scientists for guiding my research during my studies.
Special thanks to my brother in law Assistant Prof. Dr. Alper Yilmaz for his support during my research.
I would also like to thank my parents. They were always supporting me and encouraging me with their best wishes and love.
Finally, I would like to thank my wife. She was always there cheering me up and stood by me through the good times and bad.
5
Table of Contents
Abstract ... 2 Özet ... 3 Acknowledgements ... 4 Table of Contents ... 5 List of Tables... 7 List of Figures ... 8 List of Graphs ... 9 1. INTRODUCTION ... 102. ELEMENTS OF SERVICE ORIENTED COMPUTING ... 13
3. SERVICE ORIENTED ARCHITECTURE (SOA) ... 15
3.1 What is SOA? ... 15
3.2 Evolution of SOA ... 17
3.3 Why SOA? ... 19
4. SERVICE AND SERVICE ORIENTATION ... 21
4.1 Service Orientation Design Principles ... 22
4.1.1 Standardized Service Contract ... 22
4.1.2 Service Loose Coupling ... 23
4.1.3 Service Abstraction ... 24 4.1.4 Service Reusability... 25 4.1.5 Service Autonomy ... 25 4.1.6 Service Statelessness ... 26 4.1.7 Service Discoverability ... 26 4.1.8 Service Composability ... 27
4.1.9 Service Orientation and Interoperability ... 27
5. GRANULARITY IN SOA ... 29 5.1 Design Granularity ... 30 5.1.1 Capability Granularity ... 30 5.1.2 Data Granularity ... 31 5.1.3 Constraint Granularity ... 32 5.1.4 Service Granularity ... 32
6. GENERAL VIEW OF SERVICE GRANULARITY ... 33
6.1 Aspects of Service Granularity ... 34
6.1.1 Complexity of Services ... 35
6.1.2 Reuse of Services ... 35
6.1.3 Functionality of Services ... 36
6.1.4 Flexibility of Services ... 36
6
6.1.6 Generality of Services ... 37
6.1.7 Performance of Services ... 37
6.1.8 Sourcing of Services ... 38
6.2 The Dimensions of Service Granularity ... 38
6.2.1 The R3 Model of Service Granularity ... 38
6.3 How Big a Service Should Be? ... 42
6.3.1 Granularity Magnitude ... 43
6.3.2 Finding Optimal Service Granularity ... 44
7. FINDING OPTIMUM SERVICE GRANULARITY IN A SOA PROJECT ... 46
7.1 Metric 1: I/O Cost ... 47
7.2 METRIC 2: Enterprise Service Bus (ESB) ... 47
7.3 METRIC 3: Execution Cost ... 47
8. CASE STUDY: FINDING OPTIMUM SERVICE GRANULARITY BY USING I/O, ESB and EXECUTION COST IN A SOA PROJECT ... 48
9. MONTE CARLO METHOD ... 49
9.1 History of Monte Carlo Method ... 50
10. CASE STUDY EXPERIMENT AND RESULTS ... 53
10.1 Motivation ... 53
10.2 SOA Optimum Service Granularity Framework & Scenario ... 53
10.2.2 Finding Execution Cost and ESB Cost ... 56
10.2.3 Finding I/O Cost ... 63
10.2.4 Prerequisites ... 65
10.2.5 Experiment ... 66
11. DISCUSSION AND CONCLUSIONS ... 72
REFERENCES ... 75
7
List of Tables
Table 1- Processes 54
Table 2- Assigned services for a Process 58
Table 3- Table of Cluster (2) – Sampling (1) 58
Table 4- Service Sets of Cluster 2 63
Table 5- Experiment parameters & factors 66
Table 6- Overall performance cost of all processes 72
Table 7- Incidence Rates for processes 73
8
List of Figures
Figure 1- Basic Service Oriented Architecture 15
Figure 2- SOA message exchange in web services. 17
Figure 3- Simple Travel Agency interactions. 18
Figure 4- The view of a Service 21
Figure 5- The Service Contract for a web service. 23
Figure 6- Coupling between the services. 24
Figure 7-The view of Design Granularity 30
Figure 8-The view of Capability Granularity 31
Figure 9- The view of Data Granularity 32
Figure 10- Keen’s 2 D model 39
Figure 11- The R3 Model of Peter & Pierre 40
Figure 12- The R3 model of Peter & Pierre as coarse-grained and fine-grained
services 41
Figure 13- Relationships of fine/coarse grained services, task modules and task
granularities 44
Figure 14- Monte Carlo Method in five steps 50
9
List of Graphs
Graph 1- Process 1 Total Cost ... 67
Graph 2- Process 2 Total Cost ... 67
Graph 3- Process 3 Total Cost ... 68
Graph 4- Process 4 Total Cost ... 69
Graph 5- Process 5 Total Cost ... 70
10
1. INTRODUCTION
As information technology is developing, the companies have to catch up new technologies and their competitors. They always have to keep their enterprise applications up-to date.
Initially, any simple enterprise application was fairly enough for a company, because they could cover all business processes (Inventory, accounting transaction...etc) which are performed in a company.
The company, which had those applications, was in very good condition against its competitors. Now, they could make stock control and could give low prices on their market. After a while, they embraced their IT systems deeply. Their enterprise system covered all business processes. At that point, the companies started to get in trouble with their systems, because the applications were not really flexible. The companies had some characteristic properties and these properties affected their business processes.
Then, lots of the companies started to develop their own software application. Certainly, it looked like the perfect way to get a flexible enterprise system.
On the other hand, some large software companies started to develop flexible enterprise systems. These applications were good solutions as well, until one of the biggest problem, which is globalization, came up. The companies were growing up and they started trade with each other frequently. There were two main problems.
11
One of the main problems was that they had different enterprise systems and they needed to integrate their systems with each other. The other problem was that their business processes were growing up with them.
They were more complicated and have more characteristic properties of the company. At first, the companies handled those problems. They had more flexible systems so they could change some of business logic and they could make integration between their enterprise system and the other company’s system. When the number of integration is very few, it may be ignorable for some of the companies. However, everyone could see that integration would be a very big problem, because the integration was very expensive and complex process.
Furthermore, it has become really hard for lots of companies to integrate with each other. Finally, Service Oriented Architecture (SOA) has been needed to solve this problem. Thus, the companies have much more flexible and reusable systems by using SOA. Now, they can easily integrate their systems regardless of platforms and enterprise systems.
In our case study, we tried to create a new framework that uses inputs, outputs (I/O), enterprise service bus (ESB) and execution cost metrics to find an optimum in service granularity. By using our framework, we aimed to find minimum costs for all clustering samples and then decided for the optimum cluster in these minimum clusters. Our framework is not only generated for a specific scenario but also generated for all projects which are developed in Service Oriented Architecture.
During our investigation, we used Monte Carlo simulation method to perform an experiment while we took advantages of previous researches. In our experiment, we randomly generated 100 clustering samples for 50 services by using Monte Carlo simulation method. At the end of our experiment, we obtained different results by using I/O, EBS and execution metrics.
Now, we will give some brief information about service granularity and Service Oriented Architecture. Then, we will show empirical results of our study. We will compare the results that we obtained from our experiment to show the effects of
12
using I/O, EBS and execution costs while we are finding the optimum service granularity.
13
2. ELEMENTS OF SERVICE ORIENTED COMPUTING
Service oriented computing is a new computing style which represents different and enhanced distributed computing platform for developers. It has catalogues for its design pattern and design paradigm.
Also, an architectural model of Service oriented architecture is different than others. Service oriented computing platform has some changes according to the old distributed computing program by its governance considerations and implementation technologies. Also, it adds new design layers to the system.
For understanding the service oriented computing platform, we should explain its important parts. These are1;
Service Oriented Architecture: that consists of several services corresponding with each other.
Service Orientation: is a design paradigm that has considerable design principles.
Service Oriented Solution Logic: the “service oriented solution logic” is comprised of the “design of solution logic” which is formed according to the “service orientation design principles”.
Service: is a part of software computing and it is a set of capabilities. It supports the accomplishment of the strategic aims which are related with service-oriented computing.
14
Service Composition: is a coordinated aggregate of services.
Service Inventory: is a service that is standardized independently and governed collection of complementary services within the boundary of the application. It grows when the projects deliver new services.
It is important to understand service oriented architecture and service orientation before giving information about service granularity. Therefore, we will dive into SOA and Service Orientation in the next sections.
15
3. SERVICE ORIENTED ARCHITECTURE (SOA)
3.1 What is SOA?
SOA is a collection of services. These services communicate with each other. To understand SOA, we have to understand the processes between the systems and the meaning of the system.
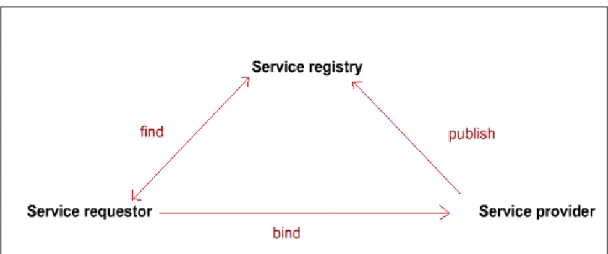
Service is a well-defined and self-contained function. SOA contains a lot of services inside it. Service provider and service consumer are two main part of the SOA.
Figure 1- Basic Service Oriented Architecture
As you see in Figure-1 service providers publish their interface in the service registry. Service registry is used for finding out about interfaces. Requester sends service request to Service Provider. The Service Provider sends back service response message to service requester.
16
SOA provides flexibility to IT systems and business processes. It is possible to add a new layer of services to your architecture. It decreases the cost of the application. In 1972, Parnas discussed about modularization and its advantages for the systems. Then, researchers started to make developments about distributed computing and integration of enterprise applications.
After years, there were a lot of companies that want to communicate with each other. SOA has opened a new way for communication of the components while they are independent of their location and technology.
When you look from the business side, Dunn and Andrei say that “SOA premises advantages like leveraging existing assets, simplifying integration and managing complexity, being more responsive, having a faster time to market, reducing cost and increasing reuse”.23
With SOA, standardization of interfaces and the way they are exposed reduces cost and promotes reuse.4
Architecture shows which systems and components exist in the application environment. Also, it represents how the information exchanges between them.
SOA is one of the best architectural designs, because it is not tied to any programming language, product or vendor.
You can see the basic difference of SOA while you are using SOA application. In SOA, person does not enter any data directly into SOA services. There is an interface application that calls one or more SOA services. The data comes through this interface application.
2 Endrei M, Ang J, Arsanjani A, Chua S, Comte P, Krogdahl P, Luo M, and Newling T.,
“Service-Oriented Architecture and Web Services” IBM Redbooks, 2004.
3 Dunn, B., "A Manager's Guide to Web Services" EAI Journal, 2003.
17
There are messages that help SOA services for communicating each other. In the real time applications there may be more than one messages at the same time or just one service can answer more than one process.
Generally, SOA services perform as web services. These services communicate by using SOAP envelopes which contain address information and metadata together with the message.
As shown before in Figure-1, you can see there are service provider and service consumer. In Figure-2, transfer of the SOAP message envelope using HTTP is described.
Figure 2- SOA message exchange in web services.
3.2 Evolution of SOA
In the 1980’s applications were just built to meet the customer requirements. The simple software solutions were enough to meet their needs in the industry.
For instance, in the industrial world it was not so essential to interact with suppliers by using computers.
18
In the early 1990, industrial world and banks needed to interact with their business partners. Industrial world has started to make their supply processes by interacting with their suppliers.
Today, the perspective of companies has changed because of the changing business processes. Business world does not only want to communicate with their business partners but also want to allow their customers and employees to access their business services by using computer application. This change opened the new way for B2C (Business to Customer) transactions.
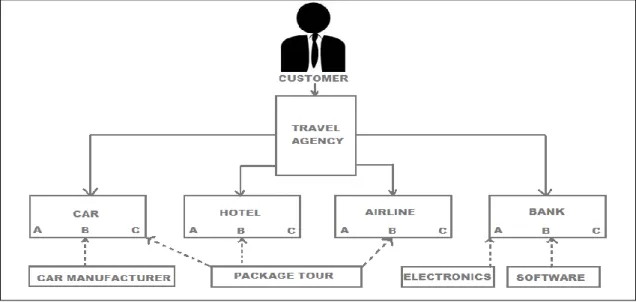
For instance we can give a typical travel agency scenario to show how SOA changed business processes.
In this system, customer interacts with Travel Agency by using Travel Agent Service. Travel Agent interfaces with the bank for online payments of accounting etc.
Also, Agency interfaces with airlines, hotels and car rental companies to serve choices to their customer. Banks, airlines, hotels and car agencies interact with their suppliers while communicating with the Travel Agency.
You can see the simple Travel Agency interactions in Figure-3.
19
Although, there are a lot of benefits of using SOA, it is not implemented by everyone. This is the time for asking a question: “Why is SOA not implemented by everyone?” We will answer this question by explaining design granularity in next section.
3.3 Why SOA?
An incremental growth of Customer Relationship Management (CRM), Supply Chain Management, e-computing of this age made Service Oriented Architecture more popular. It is important to define clearly: “Why we should use SOA”. We can say that, there are mainly 3 different factors to choose SOA. These are;
Cost Reduction
It provides cost reduction. It increases the level of reusability while decreasing the communication time between enterprise service bus (ESB) and services. We will discuss this later in our case study.
Delivering IT solutions faster
Secondly, it is possible to deliver IT solutions faster with SOA, because it is easier for users to connect and share all information and business processes within the company. Easing integration load of separated functions, it is possible to reduce delivery time. This also affects system effort as well.
Maximizing ROI ( Return on Investment)
Finally, it maximizes Return on Investment. By using web services it is possible to create new business models. Also, it is easier to create new architecture without any redundancy that occurs at the end of project life cycle.
20
Service Oriented Architecture provides analysts to focus on their responsibilities during development while they increase their knowledge about business domain.
By creating component based services with different functionality provides developers to work at the same time. Thus, development effort and time will be decreased.
Furthermore, creating well designed architecture developers and analysts can use all components for their future work. So, they save time and their effort during future projects.
Functional decomposition of services provides services to be more flexible and maintainable.
Moreover, it is possible to detect errors during development phase which makes testing process easier and more efficient.
21
4. SERVICE AND SERVICE ORIENTATION
As we said before, service orientation is a design model that has significant design principles. We may say that, service is the most considerable part of service-oriented solution logic.
Figure 4- The view of a Service [1]
Service is the combination of interfaces, service contract and implementation. The interface of the system may contain operations. These operations show us the complexity of implementation. Also, they show how the service is implemented.
On the other hand, the granularity of service is not only regarding its size and the complexity of the interface.
Every single service is assigned to its own different functional context and is composed of a set of capabilities which are related to this functional context [1].
22
4.1 Service Orientation Design Principles
There are 9 important principles of Software Orientation design. These are:
Standardized Service Contract
Service Loose Coupling
Service Abstraction Service Reusability Service Autonomy Service Statelessness Service Discoverability Service Composability
Service Orientation and Interoperability.
In the following sections, we will describe all of these principles.
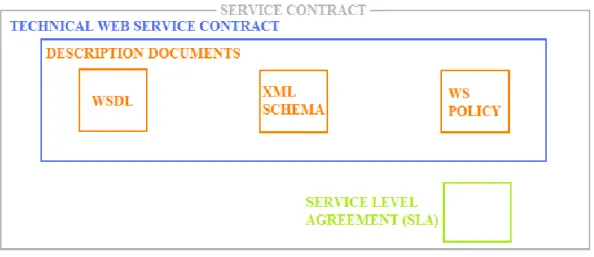
4.1.1 Standardized Service Contract
Standardized service contract design principle is one of the most important types of service orientation. Services represent their contents by using service contracts.5 As known, these contract documents can be WSDL, XML Schema or WS Policy.
Figure-5 illustrates the service contract.
23
Figure 5- The Service Contract for a web service.
We can say that, the aspects of contract design can answer these questions:
How did developers define data types and models
How policies are asserted and attached.
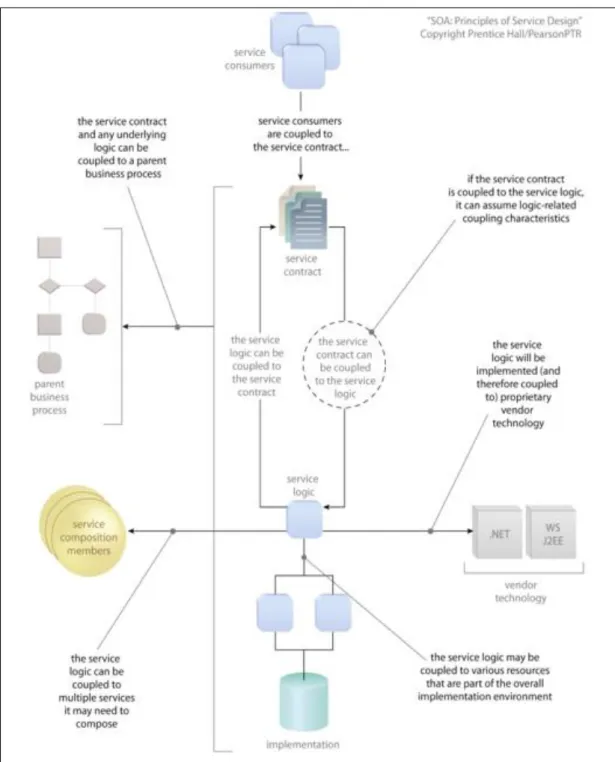
4.1.2 Service Loose Coupling
Coupling is a dependency between two or more classes that is usually resulting from the collaboration between classes to provide loose coupling.
The level of dependency can be the measure of coupling in the software world. In the system, service does not need to know about its environment.
The loose coupling encourages the independent design and evolution of a service’s logic and provides interoperability with service consumers.
In design, there may be types of coupling that can impact the granularity and the content of its contract. Figure-6 illustrates the coupling between services [8].
24
Figure 6- Coupling between the services.
4.1.3 Service Abstraction
Service abstraction is one of the important types of information hiding. It provides to position and design the service compositions. Service abstraction plays a significant role while hiding details of the service in the system. Service contract granularity can be affected by the extent of abstraction applied.
25
Establishing services as a black box provides services to hide their important details from potential customers or program users. Services can be developed for simple tasks or more complex tasks.
Web service based architectures can be used in distributed platforms. We may say that, abstraction is not only the characteristics of a service but also discrete operations that works together and separately abstract the service’s logic.
4.1.4 Service Reusability
The principle of service reusability emphasized the positioning of services as enterprise resources with agnostic functional contexts. [8]
Service reusability became an important part of service orientation’s service analyses and design processes.
Reusing the services implies high level of required interoperability between the service and consumers.
Reusable services can be used by tons of consumer programs. If we decided to develop well designed reusable services then we should be able to use our well designed reusable service for different business processes and business tasks as well as being a part of different service compositions.
4.1.5 Service Autonomy
Service autonomy is a principle that underlines the need for independent services for having high level of individualized autonomy. The service autonomy provides to control environment and resources. Therefore, we can say that service autonomy is a control process for complex compositions of services.
26
If there are lots of services and their utilities in the system then the complexity increases. This problem can be controlled by the well-designed service autonomy.
Actually, we can say that, it may be more useful for a service inventory to have just autonomous services.
4.1.6 Service Statelessness
Service statelessness enhances the scalability of individual services that are shared by multiple compositions. Service statelessness provides reusability and scalability.
According to the principle of statelessness; for providing state management delegation and deferral options it is necessary to assess the measure of realistic attainable statelessness which is based on the adequacy of the enclosing technology architecture [8].
A software program may have two different state types. These can be active and passive states. We can say that, if a program is executed then it is an active state or if it is not being used then the state of that program is passive.
In SOA, the state information that we mentioned is a representative of a data which is specific to a service activity that is currently running.
4.1.7 Service Discoverability
By using well-designed architecture, it is easy to integrate new services to the growing system.
For the service discoverability it is important to make high community communication between services. Also, the capabilities of the services should be understandable. We may think service discovery protocols as network protocols that allow services to be detected automatically.
27
There are several discovery protocols for web services such as “Simple Service Discovery Protocol” and “UDDI”.
Service discoverability principles increase the quality of the service by making service contracts and service meta-information with discoverability.
4.1.8 Service Composability
In the service oriented computing it is important to compose services in complex systems.
The service composability design principle helps determine how to carry out a separation of concerns in support of service orientation [8] if you separate the big problem into small pieces, the units of solution logic that addresses a small problem solves a big problem.
4.1.9 Service Orientation and Interoperability
The state of the services is changeable, so the interoperability is important for everyone.
For instance, it promotes interoperability by the created dependent services, if you reduce the degree of service coupling or reusing services implies high level of required interoperability between services and consumers.
Service orientation can be defined as a design paradigm which is used for specifying the automation logic in the structure of services. There are different principles that are promoted by vendors like concept, technology and design. Big companies such as Microsoft and IBM use several orientation principles in their companies.
Interoperability can be described as a process that system, data and people connect each other. It provides systems or components to exchange data in the system. With interoperability principle, it is possible to utilize the data that has been changed.
28
The capability of different programs to exchange the information between business procedures while reading & writing the file formats and using the same protocols can be described as a capability of interoperability.
29
5. GRANULARITY IN SOA
As it is described in dictionary; “Granularity is the condition of being granular”. In SOA age, functionality of a service became the most important issue while designing the architecture.
Today, researchers determine different methods and frameworks for finding the optimal service granularity to reduce cost and create reliable architecture. In the next section, several types of design granularity will be described.
Papazoglou et al.6 describe service granularity as the unit of modularity of a system. Modularity means the amount of functionality of a service.
Other researchers such as Feuerlicht and Wijayaweera7 mentioned that, coarse grained services implement high level business functions while fine grained services implement a single atomic operation which exchange limited amounts of data in the SOA project.
6
Papazoglou M., Van den Heuvel W. “Service-Oriented Design and Development Methodology”. International Journal of Web Engineering and Technology 2006
7 Feuerlicht, G., Wijayaweera, A. “Determinants of Service Reusability, New Trends in Software Methodologies, Tools and Techniques”, IOS Press, 2007
30
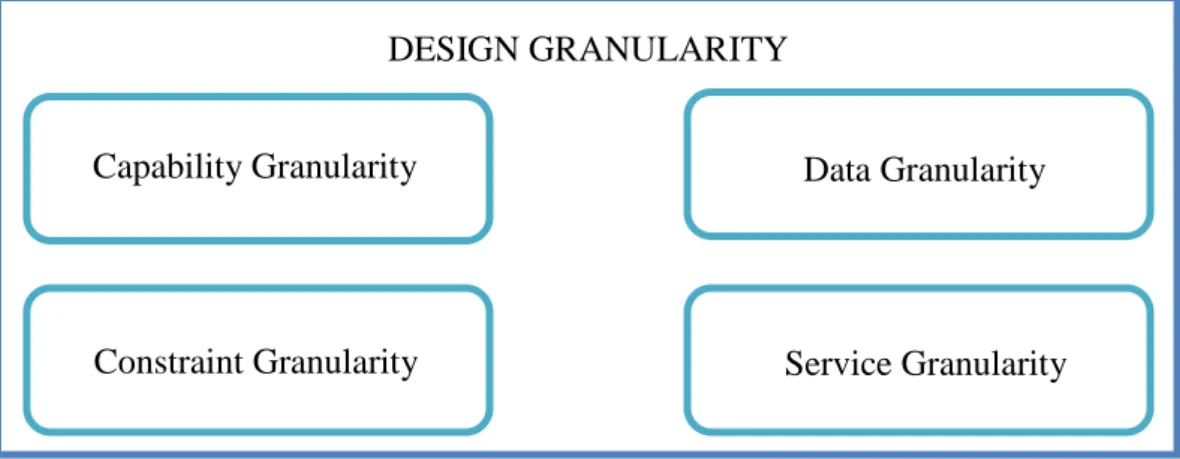
5.1 Design Granularity
The design granularity is the combination of four main concepts. These are,
Capability Granularity
Data Granularity
Constraint Granularity
Service Granularity
Each of these types is affected differently according to the application.8 Figure-7 shows the view of design granularity.
Figure 7-The view of Design Granularity
Now, it is time to describe their facilities in the system.
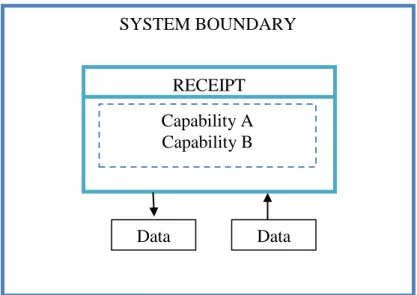
5.1.1 Capability Granularity
Capability Granularity can be defined as the quantity of functionality encapsulated by a specific service capability. Service functions describe the capability of the services. It is possible to measure the capability of service according to their retrieved data. These data may be fine-grained or coarse-grained. Figure-8 shows the view of capability granularity.
8 http://www.soaglossary.com
DESIGN GRANULARITY
Capability Granularity Data Granularity
31
Figure 8-The view of Capability Granularity
Each capability of the service may retrieve different kind of data. For example, “capability A” can retrieve larger chunks of data within a single interaction while “capability B” is retrieving small unit of data.
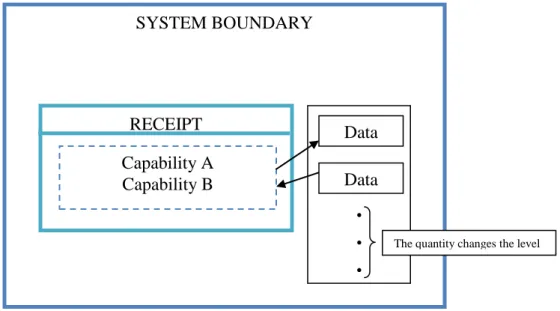
5.1.2 Data Granularity
Data granularity can be defined as the quantity of data that is transferred by a specific service capability. This data may be a big business document while the other is the subset of this business document.
The level of data granularity changes if data exchange increases. Figure-9 shows the view of capability granularity.
SYSTEM BOUNDARY
RECEIPT Capability A Capability B
32
Figure 9- The view of Data Granularity
5.1.3 Constraint Granularity
According to SOA Glossary, the quantity and detail of validation logic associated with a capability or a type defines the level of constraint granularity. It is possible to say that, defining service’s capability with comprehensive or simple constraints may have more of a coarse grained level of constraint granularity. In other words, in design granularity phase, constraint granularity is a factor to find if the service granularity is fine grained or coarse grained.
5.1.4 Service Granularity
The granularity of SOA service is one of the most debated aspects. For describing SOA service granularity, we have to know a little more information about service types and their messaging functions. In the next part, we will discuss and give some information about them.
SYSTEM BOUNDARY RECEIPT Capability A Capability B Data Data
.
.
.
33
6. GENERAL VIEW OF SERVICE GRANULARITY
In the past, developers were developing software systems with embedded logic and business rules. There were no intelligent coding rules.
Nowadays, they use structured modules with fine- grained and coarse-grained services. Using granularity in architecture increases the level of reusability of services.
According to Kontogiannis, Lewis, Smith, Litoiu, Muller, Schuster and Stroulia; there are a lot of explanations for building the “best” SOA system.9
Papazoglou says, “Service granularity is the degree of modularity of services, or the scope of functionality exposed by a service”10
Granularity provides flexible systems. Granularity means that components of granules exist. These granules can be fine-grained or coarse-grained. Now, we will dive into the granularity of services.
Many researchers defined different frameworks for finding the optimal granularity.
In the research of Kulkarni and Dwivedi, the optimal granularity of key services can be expected to vary at various layers with different service types. 11
9
K. Kontogiannis, G.A. Lewis, D.B. Smith, M. Litoiu, H.Muller, S.Schuster, E.Stroulia, “The landscape of service-oriented systems: a research perspective,” Proc. 2007, IEEE, 2007, pp. 1-6.
10 Papazoglou, M., and Van den Heuvel, W. "Service-Oriented Design and Development
Methodology,"International Journal of Web Engineering and Technology, 2006
11 N. Kulkarni, V. Dwivedi, “The Role of Service Granularity in A Successful SOA Realization - A
34
There are several key factors to build successful SOA. For instance, definition, presentation and identification of services are important for SOA development.
Alahmari and Zaluska 12 defined a new framework that assists service identification, definition and realization for migrated legacy systems with optimal service granularity.
They believe that, the framework which they defined provides influential guidelines for optimal service granularity for different service types. They used UML and BPMN diagram in their research. They created automated transformation process between two diagrams (UML to BPMN).
6.1 Aspects of Service Granularity
The level of granularity depends on the company’s needs. These needs can be complex or simple.
According to Arsanjani13, “choosing which level of granularity is needed, depends on aspects like how flexible the organization wants to be and whether they are focusing on service reuse”. Many of these sources identify the aspects of service granularity. There are 8 main aspects. These are;
Complexity of services Reuse of services Functionality of services Flexibility of services Context-Independence of services
12S. Alahmari, Ed. Zaluska, “Optimal Granularity for Service-Oriented Systems” .School of
Electronics and Computer Science University of Southampton, 2010.
13 Arsanjani, A., Borges, B., and Holley, K. "Service-Oriented Architecture," in: DM Direct
35
Generality of services
Performance of services
Sourcing of services
In the next section, we will give some information about these aspects.
6.1.1 Complexity of Services
Generality and reusability are related with the complexity aspect. Complexity can be defined as the generic service. Generic service may have lots of parameters, transactions etc...
It becomes to be harder to execute the service that has too much functionality. According to Fenton, “complexity can be measured by 4 different steps”.14 These are,
Cognitive Complexity that measures the effort required to understand the software.
Structural Complexity that measures software structure to implement the algorithm.
Efficiency that measures software performance that reflects the algorithm.
Problem Complexity that measures the complexity of the problem that needs to be solved.
6.1.2 Reuse of Services
In the system there may be services that are used for more than one purpose. Reuse of services is important for the application management. Reusing services decreases the cost and provides to save time while coding the program.
14 Fenton, N., and Pfleeger, S. “Software Metrics - a Rigorous & Practical Approach”, (Second
36
In the business processes there may be lots of functions specific pats that can be fixed in just one service. According to Fergunson15 , “The powerful service is the combine of the services”. So reuse of the services can be used for business processes or for the smaller services.
6.1.3 Functionality of Services
According to Fenton [12], “functionality captures an intuitive notion of the amount of function contained in a delivered product or in a description of how the product is supposed to be”.
To determine the degree of granularity of a function can be affected by the functionality of that service.
6.1.4 Flexibility of Services
Flexible systems can be changed easily according to organization’s needs and conditions. Some of the services can operate in different environments while others need modifications according to new technology.
According to Nelson16, “technology flexibility includes the characteristics of technology that allow or enable adjustments and other changes to the business process”.
Making modifications easily or using services at different environments make services flexible.
15
Ferguson, D., Lovering, B., Storey, T., and Shewchuk, J. "Secure, Reliable, Transacted Web Services: Architecture and Composition", 2006
16 Nelson, K., Nelson, H., and Ghods, M. “Technology Flexibility: Conceptualization, Validation, and
Measurement” , Proceedings of The Thirtieth Annual Hawaii International Conference on System Sciences, Computer Society Press, Hawaii, 1997.
37
6.1.5 Context- Independence of Services
According to Papazoglou17, “context- independence is defined as a service that is not need to have any knowledge about its surroundings. It is also called loosely-coupled”.
Many sources define loose-coupling as “platform agnostic”. Platform agnostic means that different platforms and environments can communicate with each other.
The service which is used by the system does not need to know about their environment. It is not necessary for the system to know the states of other services.
6.1.6 Generality of Services
This aspect provides service to be used in many different ways. Functionality of the service may change the generality. Some of the services can be simple but reusable while the other service has much more functionality.
Parameters that are created by the functions may be complex. If the service is simple than we can say it is general.
It is important to keep service simple and with much more functionality, but you should avoid from unnecessary functionalities.
6.1.7 Performance of Services
Performance can be measured by the speed of service. For example, if you think about the brokerage system, there are lots of transactions between services in a second. If the performance of brokerage system is not good, thousands of people may lose too much money.
Furthermore, performance is one of the most important constraints for granularity. Performance changes if the service is too coarse-grained or fine-grained.
17 Papazoglou, M."Service-Oriented Computing: Concepts, Characteristics and Directions”, 4th
38
6.1.8 Sourcing of Services
This is the decision making process and it has two types for the companies. These are outsource and in-source. Outsource means that the work is done by other companies. In-source means that keeping source inside the company.
Today, outsourcing is popular for the business activities. To simplify outsourcing, IT services should contain business services inside it.
According to Arnold18, “Sourcing principle can be a reason to choose granularity in a way to support to make it possible to lift a part of business process as a whole out of the organization.”
6.2 The Dimensions of Service Granularity
Up to today, Keen, Peter and Pierre have made some definitions about dimensions of the service granularity. They researched “What services should be realized?”, “What should be done and for whom?”
The entire architecture of services should come into consideration, because it is not enough to satisfy the actor’s roles on the system. We should dive into 3D of service granularity to solve this problem.
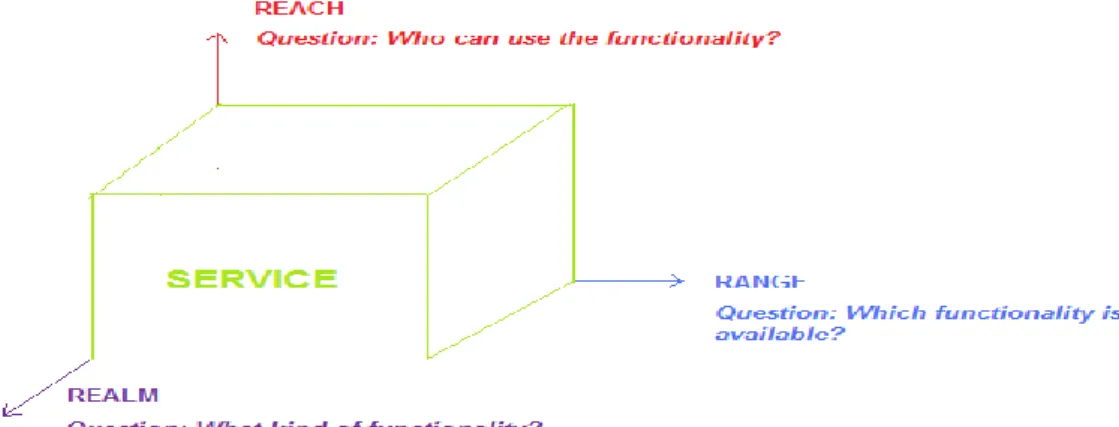
6.2.1 The R3 Model of Service Granularity
According to Keen, the architecture of the system can be defined in two dimensions. These are reach and range.19
Figure-10 shows Keen’s 2 Dimensions model.
18
Arnold, B., and Op 't Land, M."An Architectural Approach to the Implementation of Shared Service Centers,"in: Dutch National architecture Congress (LAC2002), Zeist, the Netherlands, 2002.
39
Figure 10- Keen’s 2 D model
After years, Peter and Pierre have added another dimension to the structure while they are preparing their thesis.20 It was time to ask a new question, “What kind of functionality will you use for the service?” This dimension named as Realm.
Dividing the architecture in components or services helps to manage the complexity of Reach and Range dimensions. According to Peter & Pierre [20], “The notion must be partitioned and expressed in terms of how much functionality and what kind of functionality”.
Range and Reach factors just send message to provide autonomic transactions or perform complex transactions on multiple applications.
Peter& Pierre found new point of view for the kind of functionality.
Figure-11 illustrates their R3 model of Reach, Range and Realm.
20 Pierre R, and Peter S. “Explaining Service Granularity” in: Department of Management and
40
Figure 11- The R3 Model of Peter & Pierre
Range can change according to the system needs. Think common order service application. The simple product service sends an e-mail to check current product.
If you increase the level of range a little more, service publishes inventory status on the web site. To make range dimension more complex, you can make product order on the web site.
Another range example can be making online order and getting delivery details of the product. If you ask a new question, “What kind of functionality is that?”, you will see that this function can be used by the suppliers or customers. So, there should be two kind of orders; supplier order and customer order.
In the service oriented architecture it is not a good way to use different services for the same process. It makes your system more complex.
In the example that we described above, there are two types of user but they can use the same order service, because they can only order the product. It is not important whatever it is customer or supplier.
41
It could be possible to separate services into two pieces. If one service is for standard orders of high volume and another one is for low volume of complex orders.
The services can be coarse-grained or fine-grained. These two types of services answer the question: “what kind of functionality is this?”
Figure-12 shows the R3 model of Peter & Pierre as coarse grained and fine grained
services.
Figure 12- The R3 model of Peter & Pierre as coarse-grained and fine-grained services
42
6.3 How Big a Service Should Be?
This is one of the most endemic questions that creators have pointed. There was no problem while the programmers are developing a single program that encapsulates one application. This procedural programming style has changed when the object oriented and service oriented forms came into our lives.
The new programming approaches provide developers to separate logical units of application functionality into objects.
The new generation services have started to provide capabilities of encapsulation, inheritance and other needs of object orientation.
According to Ronald21; “objects are a form of abstraction that differ from the concept of procedural code, but does not replace it- it simply offers a new way of organizing and consolidating functionality”.
There is another level of abstraction of object oriented architecture, it may be called; “service oriented architecture”. In SOA, Service functionality became the most important factor while estimating the cost of services.
For developing a successful SOA, loose coupling is essential. Much more different platforms and environments can communicate with each other according to the level of loosely coupling. You have to define independent customer or provider policy to create a scalable SOA.
Loosely coupled architecture allows programmers to modify or replace components without making changes on the other components in the system.
On the other hand, granularity concept is a measure that broads the interaction between a service consumer and service provider.
43
According to Ronald S.22 “Fine-grained services can be defined as a service that addresses a relatively small unit of functionality or exchanges a small amount of data.”
Coarse-Grained services are services that summarize the larger capability inside a single interaction. So, we can say that, a service method that returns more data is a coarse-grained method. A service method turns less and more specific data is a fine-grained service.
According to these two concepts, granularity of services impact two major goals of the service orientation. These are:
The composability of loosely-coupled services.
Reusability of individual services in different contexts.
The service oriented architecture highlights the magnitude of granularity. We will see the magnitude of services in the next section.
6.3.1 Granularity Magnitude
Granularity magnitude is the size of service granules within a SOA project which changes the complexity of the system.
According to Yuan, Tao and Qiling; creating too large granularity results in high level complexity of the sub-task or activity while small granularities increase the number of subtasks and their coupling degrees23. We can separate granularity into two groups:
Fine Grained
Coarse Grained
22 R Schmelzer, Service Oriented Architecture Expertise, Advisory, and Influence” Right Sizing
Services”, http://www.zapthink.com, 2008.
23 H. Yuan, Y. Tao, Z. Qiling, “Granularity Control and Cohesion Measurement in Manufacturing
Grid Task Decomposition”, Shanghai Institute of Technology, China, Journal of Convergence Information Technology, Volume6, Number 7, 2011
44
If we describe these two types of granularity, we can say that, fine grained service is a service that is used in the sub-modules while coarse grained services are the combination of these fine grained services.
Coarse granularity services are used by the modules within the system. Furthermore, fine granularity tasks can be combined into coarse-grained sub-tasks so they can be decomposed into particular fine-grained sub-tasks as well.
Figure-13 shows the relationships of fine/coarse grained services, task modules and
task granularities.
Figure 13- Relationships of fine/coarse grained services, task modules and task granularities
6.3.2 Finding Optimal Service Granularity
Today, researchers try to find new methods to reduce the cost of service oriented architecture. Although new frameworks found, they continue to search for new realistic methods.
45
In the research of Kulkarni and Dwivedi24, autonomous natured web-services and explicit boundaries do not help to find the right granularity.
According to Kulkarni and Dwivedi, for finding the optimal service granularity, it is important to establish well defined and clear boundaries between collaborating systems as well as reducing the independencies and restricting of interactions to well defined points.
Another research made by Reldin and Sundling suggests that fine grained services may be the optimal service structure, because fine grained services makes easier to rearrange the process.25
On the other hand, it is unavoidable that creating a lot of fine grained services makes reusability harder. Furthermore, it is hard to provide governance for fine grained services.
Defining a process with a lot of fine grained services increases the process cost as well. Integration and maintenance of these services need more effort. Especially, enabling these services into a new technology makes building harder.
In our case study, we will try to find optimum service granularity in SOA. There are many researches about finding optimum service granularity but we tried to approach finding optimal service granularity from a different point of view.
In our research we created a simulation program that uses Monte Carlo method. In the next section we will describe Monte Carlo method.
24 N. Kulkarni, V. Dwivedi, “The Role of Service Granularity in a Successful SOA Realization – A Case Study”, SETLabs, Infosys Technologies Ltd, IEEE Congress on Services, 2008
25
Pierre Reldin and Peter Sundling, “Explaining SOA Service Granularity- How IT shapes services”, Linkoping University Master Thesis LIU-IEI-TEK-A--07/0090--SE, Institute of Technology,2007
46
7. FINDING OPTIMUM SERVICE GRANULARITY IN A SOA
PROJECT
Choosing wrong service granularity causes performance problems. In some cases, I/O cost is higher than execution cost or execution cost is higher than I/O cost. ESB cost carries a lot of weight with the project’s structure preparation. As previous researches are argumentative, we created a new framework for finding the optimum service granularity in SOA.
Our framework is based on 3 metrics and we will use these service points in our calculation:
I/O Cost
Enterprise Service Bus (ESB) Execution Cost
In the next section, we will describe these metrics in detail.
In our experiment, we will divide a project into several processes. The processes that we generated will contain some services. We will cluster these services into number of groups. The number of groups can be decided by the Monte Carlo simulator user. Clustering these services into sub-groups will give us different grouping sizes and different performance costs. We will start to calculate performance cost by using I/O, Enterprise Service Bus (ESB) and Execution cost factors.
47
7.1 Metric 1: I/O Cost
As a first factor, we have used I/O cost metric to find the optimum service granularity. Inputs and outputs affect the process run-time of a service. Thus, the time that service spends on processing will be increased if the number of I/O increases.
7.2 METRIC 2: Enterprise Service Bus (ESB)
As a second factor, we have used ESB metric to find the optimum service granularity. ESB is an architectural layer that connects all services within the SOA project. These services can accomplish tasks by using ESB. ESB provides communication between software systems inside and out of the company’s network boundary.
7.3 METRIC 3: Execution Cost
Finally, we have used execution cost metric to find the optimum service granularity. In our framework, execution cost is total time that a service spends while running its processes.
48
8. CASE STUDY: FINDING OPTIMUM SERVICE
GRANULARITY BY USING I/O, ESB and EXECUTION COST IN
A SOA PROJECT
In our case study we will try to find the optimum service granularity by using I/O, ESB and Execution Cost factors.
We will generate new services by clustering services into several groups. We will create 100 samples for each cluster to get different cost results. By using these results, Monte Carlo simulation programme will find the optimum service granularity which is produced with the lowest performance cost.
Now we will give some information about Monte Carlo method that we used during generating random numbers in our empirical research for finding the optimum service granularity.
49
9. MONTE CARLO METHOD
Monte Carlo methods use different computational algorithms to create experimental random samples to generate various experiment results. “Monte Carlo method” is also called as “Monte Carlo experiments”.
By using this method it is possible to generate random numbers and combinations for investigating problems.
Moreover, Monte Carlo methods help us to generate number of random configurations. It can be used in simulations of mathematical and physical problems as well as economics field.
The main patterns of Monte Carlo method may contain following steps:
Defining a set of possible inputs
Generating random inputs from possible combinations over the set.
Performing deterministic computation on the inputs.
Accumulating the results.
50
Figure 14- Monte Carlo Method in five steps
9.1 History of Monte Carlo Method
The development of Monte Carlo method started in 1940’s. In 1940’s, the term Monte Carlo was coined by John von Neumann, Nicholas Metropolis and Stanislaw Ulam. They were working on their nuclear weapon project which is named “Manhattan Project”.
After Ulam suggested Monte Carlo method, Von Neumann, Metropolis and other researchers started to systematic development of Monte Carlo Method.
STEP - 1
Create parametric model like y = f(x1, x2, ..., xq).
STEP - 2
Generate a set of random inputs like xi1, xi2, ..., xiq.
STEP - 3
Evaluate the model and store results as yі
STEP - 5
Analyze the results by using different methods (such as summary statistics, graphs)
STEP - 4 Repeat Step 2 & 3 for i= 1 to n
51
Then he realized that it is possible to do some statistical sampling using computing techniques. He shared his opinion about his current research with Robert Richtmyer.
In 1948, Nicholas Metropolis (1915 - 1999) and his team did the first actual Monte Carlo calculations on the computer which is named “ENIAC”. ENIAC was the first electronic digital computer at that time. 26
Some researchers have used Monte Carlo algorithms in their case studies. For instance, in 2000, Rosenthal used Monte Carlo algorithms for parallel computing.
They described parallel Monte Carlo method in their research to show that the Monte Carlo algorithms are useful in parallel computing.
Also, they used “parallel Markov chain Monte Carlo” in their experiments to show “How Markov chain Monte Carlo and Monte Carlo method works in actual computer experiments”. They illustrated different results according to their experiments. 27
At the end of their experiments, they found that is not hard to run Monte Carlo and Markov chain Monte Carlo in parallel computing.
Another research made by Avrachenkov, Litvak, Nemirovsky and Osipova. They have used Monte Carlo method for PageRank computation. They described PageRank “as a frequency of visiting a Web page by a random surfer”28
.
26
Nucleonica, “ Introduction to Monte Carlo method”, European Commission Directorate –General Joint Research Centre, 2008
27
J.S. Rosenthal, “Analysis of the Gibbs sampler for a model related to James-Stein estimators” Statics and Computing, 6, 269-275, 1996
28
K.Avrachenkov, N. Litvak, D. Nemirovsky, N.Osipova, “Monte Carlo Methods in PageRank Computation: When One Iteration is Sufficient”, SIAM Journal on Numerical Analysis 45, 890; 2007
52
Visiting web site increases the rank of that web site which affects its popularity. They think that using Monte Carlo methods help to calculate PageRank estimation of a web site.
In the research of Brin, Motwami and Winograd29, they used “power iteration method” for computing the PageRank method. Originally, this method is used by one of the most popular search engines: Google.
At the end of their experiments they found that the Monte Carlo algorithms state the PageRank of relatively significant web pages already after the 1st iteration.
In their research they show us the benefits of using Monte Carlo methods in our research while calculating the cost.
Because they pointed to the usefulness of using Monte Carlo method by showing us the possibility of continual PageRank update while the crawler gets new data from the web.
When we look inside their studies, we can clearly say that, using Monte Carlo method provides parallel implementation in our experiment.
29 S. Brin, L. Page, R. Motwami and T. Winograd, “The PageRank citation ranking: bringing order to the Web”, Stanford University Technical Report 1998, http://dbpubs.stanford.edu:8090/pub/1999-66.
53
10. CASE STUDY EXPERIMENT AND RESULTS
10.1 Motivation
In our research we will try to find optimum service granularity by clustering services into small pieces. Firstly, by using Monte Carlo simulation method we will generate random services with random I/O and execution costs. Secondly, we will calculate the performance cost of all services to find the optimal service granularity with accurate results. You can find the metrics that we have used during our experiment in
Section 7. We will use these metrics in our framework and calculations.
At the end of our research we will try to find the optimum service granularity that gives the most reliable performance cost of a service and we will be able to see the effect of granularity on service performance.
10.2 SOA Optimum Service Granularity Framework & Scenario
Framework that we created is based on three main metrics I/O cost, ESB and execution cost. Now we will describe how we used these metrics in our framework.
We assumed that there is a scenario with 50 fine-grained services and 5 processes. The framework is generic so that the number of services and processes can be changed using the configuration parameters. We assigned random I/O and execution costs for all services which can be a decimal number. Our framework is not only
54
generated for a specific scenario but also generated for all projects which are developed in Service Oriented Architecture.
In our case study, cluster group 1 and cluster group 50 are the extreme points, because “cluster group 50” has 50 services which are distributed into 50 groups while “cluster group 1” has 50 services in one group.
We assumed that, the ESB cost between two services is 1 for all service’s communication time. You can find how to assign services into processes in Table 1.
Process 1 Process 2 Process 3 Process 4 Process 5
24 49 33 31 22 42 17 1 20 40 34 8 23 3 47 2 26 41 10 15 19 44 48 28 37 11 36 16 35 5 29 4 38 18 12 21 46 6 25 30 39 14 45 43 9 7 32 13 50 27 21 21 21 21 39 39 39 39 7 7 7 7 46 46 46 14 14 32 32 Table 1- Processes
Green services are used by all processes.
Red services are used by Processes 2,3,4,5. Blue services are used by Processes 2, 3, 4. Yellow services are used by Processes 2, 3, 5.
55
10.2.1 Clustering
First of all, Monte Carlo simulation programme generated 50 clusters. Each cluster has 50 services. We created each cluster for 100 times to get accurate results.
In our case study, clusters contain one or more groups that use our existing services which are distributed randomly into these cluster groups.
Pseudo Code of Clustering:
Start
Read Nr. Of Service, Nr. Of Sample i= 1, j=1, k=1
DOWHILE Nr. Of Service >= i
DOWHILE Nr. Of Sample >= j
remainServices= Nr. Of Service
DOWHILE k<= i+1 // k is Nr. of cluster groups Assign Random Services to Group (); k =k+1 ENDDO j= j+1 ENDDO i= i+1 ENDDO Stop
56
Figure 15 represents the first 5 clusters for the first sampling.
Figure 15- First 5 clusters for the first sampling.
10.2.2 Finding Execution Cost and ESB Cost
Execution cost can be defined as the run-time that is spent by a service. As a metric, we use execution cost and execution cost factor.
Clustering services increases the execution cost. So, execution cost factor provides to increase the value of execution cost.
Pseudo Code of Execution and ESB Cost Calculation
START
c= 0; s= 0; g= 0; p= 0 NoOfService=50 NoOfService= 100
57 Selected Services= “ ” Index= 0 DOWHILE c < NoOfServices DOWHILE c < NoOfSample DOWHILE g< c+1 SelectedServices= getServicesInGroup() DOWHILE p<NoOfProcesses CreateSetsofGroup() p= p+1 ENDDO g= g+1 ENDDO s=s+1 ENDDO c= c+1 ENDDO ESBandEXECCost= 0
groupEXECCost= 0, GroupEXECCostFactor= 0, EXECCostFactor= 1 index= COUNT(NoOfSets)
ESBCost= 1
ServicesInGroup= 0 DOWHILE i< Index
groupExecCostFactor= ExecCostFactor ServicesinGroup= getNoOfServicesInGroup() i=0
DOWHILE i< ServicesInGroup
GroupExecCostFactor + = 0.05 ENDDO GroupExecCost= getTotalOfGroupExecCost() IF ServicesInGroup > 1 THEN ESBandEXECCost= (GroupExecCost*GroupExecCostFactor)+ESBCost ELSE ESBandEXECCost= (GroupExecCost+ESBCost)
58 ENDDO
Stop
Now, we will give an example of estimating the execution cost of a process.
For Cluster (2) - Sampling (1)
Table 2 illustrates the existing services in Process 1.
Assigned services for PROCESS 1 24-42-34-2-19-11-29-21-39-7
Table 2- Assigned services for a Process
Clustering Sample No. Group ID Services
2 1 1 28-20-38-6-47-15-7- 25-43-35-3-45-12- 30-22-40-32-50-18- 10-19-37-5-44-27-34-2 2 1 2 9-42-49-17-24-31- 46-14-21-39-11-29- 36-4-26-33-1-8-41-48-16-23-13
Table 3- Table of Cluster (2) – Sampling (1)
Table 3 illustrates how clustering (2) sample (1) is generated.
To find the execution cost, we compare the services in Process 1 with the clustering sample groups. Then we find services if they belong to group 1 or group 2.
Execution Cost calculation for Cluster (2) Sampling (1):
Service 24 Group 2 Service 42 Group 2
59
Service 34 Group 1 (Service 34 is in the group 1. So we have to calculate the
execution cost for Service 24 and 42)
Total Execution Cost of 24 and 42:
24 1.3 42 1.0
TOTAL Execution Cost2.3
Execution Cost Factor of SET (24 and 42):
Initial Value of Execution Cost Factor = 1.
Execution Cost Factor of SET (24 and 42) =
Execution Cost Factor + 0.05 + 0.05 = 1 + 0.05 + 0.05 = 1.1.
If there are more than one service inside the set then we add 0, 05 to execution cost factor that is assumed to be the factor of increase.
Execution Cost + ESB Cost of SET (24 and 42):
TOTAL Execution Cost2.3 Execution Cost Factor1.1 ESB 1
Execution Cost + ESB Cost of SET (24 and 42) =
(TOTAL Execution Cost * Execution Cost Factor) + ESB = (2.3 * 1.1) + 1 = 3.53
60 Service 34 Group 1
Service 2 Group 1 Service 19 Group 1
Service 11 Group 2 (Service 11 is in the group 2. So we have to calculate the
execution cost for Service 34, 2 and 19)
Total Execution Cost of 34, 2 and 19:
34 1 2 1.4 19 1.4
TOTAL Execution Cost3.8
Execution Cost Factor of SET (34, 2 and 19):
Initial Value of Execution Cost Factor = 1.
Execution Cost Factor of SET (34, 2 and 19) = Execution Cost Factor = 1 + 0.05 + 0.05 + 0.05 = 1.15
If there are more than one service inside the set then we add 0, 05 to execution cost factor.
Execution Cost + ESB Cost of SET (34, 2 and 19):
TOTAL Execution Cost3.8 Execution Cost Factor1.15 ESB 1
Execution Cost + ESB Cost of SET (34, 2 and 19) =
(TOTAL Execution Cost * Execution Cost Factor) + ESB = (3.8 *1.15) + 1 = 5.37

![Figure 4- The view of a Service [1]](https://thumb-eu.123doks.com/thumbv2/9libnet/4343523.72012/24.892.178.796.490.766/figure-view-service.webp)