ABSTRACT
Background: Alveolar-capillary membrane damage devel-ops as a result of the inflammatory effect of cardiopulmonary bypass (CPB). In the presence of a healthy alveolar-capillary barrier, there is little or no surfactant in the blood. The aim of this study was to evaluate the protective effects of ultraprotec-tive ventilation during CPB by measuring serum and bron-choalveolar lavage (BAL) surfactant protein B (SPB) values in congenital heart surgery.
Methods: This prospective study was designed for 46 patients with congenital heart defects. Patients were clas-sified into two groups: group 1 comprising pulmonary nor-motensive patients and group 2 consisting of pulmonary hypertensive (PH) patients. Each group was divided into two sub-groups: (a) those who received ultraprotective ventilation during CPB and (b) those who did not receive ultraprotec-tive ventilation during CPB. Serum SPB (S-SPB) values were measured preoperatively (ST1); at the fourth hour postop (ST2); and at the 24th hour postop (ST3). BAL SPB values were measured preoperatively (BT1); and at the fourth hour postop (BT2).
Results: ST1, ST2, and ST3 values of group 1a nary normotensive ventilated patients) and group 1b (pulmo-nary normotensive non-ventilated patients) were much lower than those of group 2a (pulmonary hypertensive ventilated patients) and group 2b (pulmonary hypertensive non-venti-lated patients) (P < .05). The evaluation of ST1, ST2, and ST3 values between groups 1a and 1b did not show statisti-cally significant differences. When comparing ST1 to ST3, a decrease in value was observed in group 1a (32.28 ± 13.27 ng/mL to 19.38 ± 7.6 ng/mL) (P = .006). In Group 1b, values increased between ST1 and ST2 before decreasing from ST2 to ST3; however, the ST3 values were still higher than their ST1 counterparts. It was recorded that there was no statisti-cally significant difference between the ST1, ST2, and ST3 values of group 2a and group 2b. A comparison of the BT1 and BT2 values in groups also yielded no statistically signifi-cant differences.
Conclusion: Although pulmonary hypertension is known to result in lung injury, this study is important as it shows
that ultraprotective ventilation protects the alveolar-capillary barrier in pulmonary normotensive congenital heart patients.
INTRODUCTION
Pulmonary surfactant is a membrane-based, lipid-protein complex with surface-active characteristics [Serrano 2006]. Its protein component, which accounts for 10% of the total pulmonary surfactant, is synthesized only by type II pneu-mocystis of the alveolar epithelium. Surfactant proteins are responsible for several innate defense mechanisms and play a key role in stabilizing the surfactant itself, contributing to the maintenance of normal pulmonary biophysics [Poulain 1992]. SPB is one of the four surfactant proteins, with a specific func-tion to stabilize the alveolar surfactant [Agostoni 2011]. SPB is produced in the alveolar cell as an immature 40 kDa form before undergoing complex proteolytic processes inside the type II pneumocytes. It develops through intermediate SPB precursors, weighing 24 kDa and 17 kDa, to its 8 kDa mature and active form [Agostoni 2011]. It is then secreted into the alveolar space [Agostoni 2011]. SPB has a relevant gradient across the alveolar-capillary membrane, so that under physi-ological conditions, only a low concentration of SPB is found in the blood.
Despite continuous improvements in materials and perfu-sion techniques, cardiac surgery still causes lung injury and a delay in pulmonary recovery [Engels 2013]. Lung dysfunc-tion is common after cardiac surgery [Engels 2016]. Ischemia during CPB results in endothelial activation upon reperfu-sion, which promotes the adherence of phagocytes through expression of specific surface adhesion molecules [Engels 2016]. This results in the release of neutrophilic proteases and other inflammatory mediators that cause injury to the alveolar-capillary membrane. The subsequent physiological changes result in impaired lung function [Engels 2016].
Protective mechanical ventilation was first developed to treat acute respiratory distress syndrome [Acute Respiratory Distress Syndrome Network 2000] before being successfully extended to abdominal surgery [Futier 2013]. Protective ventilation that uses low tidal volumes is of benefit in car-diac surgery, with a number of studies reporting that appli-cation of this technique is associated with a lower incidence of pulmonary complications and organ failure and a shorter duration of stay in the ICU [Sundar 2011]. However, studies on ventilatory strategies during CPB [Schreiber 2012] or the postoperative period [Pasquina 2003] are controversial, while there is no clinical guideline available on pulmonary manage-ment in adult cardiac surgery.
Ultraprotective Ventilation during CPB Protects the Alveolar-Capillary
Barrier in Pulmonary Normotensive Congenital Heart Patients
Ugur Gocen, Atakan Atalay
Department of Cardiovascular Surgery, Cukurova University Medical Faculty, Adana, Turkey
Received January 17, 2017; received in revised form April 6, 2017; accepted April 10, 2017.
Correspondence: Ugur Gocen, Cukurova University Medical Faculty, Cardiovascular Surgery, Adana, Turkey 01330; GSM: 5055033009; +90-03223386793; fax: +90-03223386900 (e-mail: [email protected]).
The relationship between ventilatory management and possible prevention of the damaging pulmonary effects of CPB have been investigated in animals and humans using a variety of endpoints [Magnusson 1998]. However, this research has focused solely on ventilatory management of the lungs during CPB [Magnusson 1998]. To date, no investigation has exam-ined the possible beneficial effects of ultraprotective ventila-tion in congenital heart patients exposed to CPB. To address this shortfall, the aim of this study was to provide information on lung injury by analyzing the serum and BAL surfactant protein B values of pulmonary normotensive and hyperten-sive patients who received ultraprotective ventilation.
MATERIALS AND METHODS
Patients
In all, 46 patients requiring congenital heart surgery with CPB, who were admitted to the Department of Cardiovas-cular Surgery, Balcali Hospital, Cukurova University, were included consecutively in our study from September 2015 to February 2016. Informed consent was provided by each patient’s family members. Postoperative standard care in the cardiac intensive unit (CICU) was scheduled as a routine ele-ment for all patients. This protocol was conducted as per the Declaration of Helsinki and was approved by the Cukurova University Medical Faculty Ethics Committee.
Patients were diagnosed with atrial septal defect (ASD), ventricular septal defect (VSD), subaortic membrane (n = 2), partial abnormal venous drainage anomaly (PAPVDA; n = 2), total abnormal venous drainage anomaly (TAPVDA; n = 1), complete atrioventricular septal defect (AVSD; n = 9), and Tetralogy of Fallot (TOF) (n = 8). We performed correc-tive surgery for all patients according to the characteristics of heart defects.
Patients were separated into two groups for examination: pulmonary normotensive (group 1; n = 21) and pulmonary hypertensive patients (group 2; n = 25). Pulmonary hyper-tension was defined as having systolic pulmonary artery pres-sure higher than 50% of the systolic systemic prespres-sure [Berry 1993]. The group 1 patients were further divided into two subgroups: those who received ultraprotective ventilation during CPB (group 1a) and those who did not receive ultra-protective ventilation during CPB (group 1b). The group 2 patients were further divided into two subgroups: those who received ultraprotective ventilation during CPB (Group 2a) and those who did not receive ultraprotective ventilation during CPB (group 2b). PaO2 of the blood gases collected under CPB from all patients was adjusted to be within the 80-150 mmHg range.
Ultraprotective Ventilation Protocol
CPB patients were ventilated as follows: ventilation fre-quency was 8/min; tidal volume was 6 mL/kg; PEEP was 8 cmH2O; peak plateau airway pressure was <25 cmH2O; and FiO2 was 21%. Before initiation of CPB and after CPB stopped, patients were ventilated as follows: ventilation fre-quency was 20-30/min (according to age); tidal volume was
10 mL/kg; PEEP was 3 cmH2O; peak plateau airway pressure was <25 cmH2O; and FiO2 was 50%.
Anesthetic Technique
Prior to surgery, all phenomena were examined preopera-tively. The same anesthetic technique was used in all patients who were taken to the operating room without premedication and according to a suitable fasting period for their age. After ketamine bolus (2 mg/kg, i.v.) was administered in anesthesia induction, vecuronium bromide (0.1 mg/kg) was adminis-tered as a muscle relaxant. When the muscle relaxation was adequate (after about 3 minutes), tracheal intubation was per-formed. Anesthesia maintenance was provided with sevoflu-rane (0.5-2%).
Surgical Technique
All patients operated on had a CPB with or without aortic cross-clamping. The CPB was performed with a basic flow of 2.5 L/min/m2. Myocardial preservation was performed by anterograde blood cardioplegic solution. We used normo-thermic blood cardioplegia with warm induction and reper-fusion. The average interval between the cardioplegia doses was about 15 minutes. Patients cardiac defects were corrected according to their own characteristics.
Extubation Algorithm
Postoperative intensive care unit patients were extubated in an algorithm. This algorithm included: adequacy of neu-romuscular strength clinical strong and leg lift; respiratory rate >20 if <1 year, >12 if >1 year, endtidal CO2 <55 mmHg; adequacy of oxygenation O2 sat >70% stage 2, >75% stage 3 on FiO2 ≤0.4
Specimen Collection
Serum samples for surfactant protein B were collected from the central venous pressure (CVP) line after induction of anesthesia (ST1), 4 hours post-CPB (ST2), and 24 hours post-CPB (ST3). BAL fluid samples were taken from the deep bronchial lavage set after induction of anesthesia (BT1), 4 hours post-CPB (BT2). Blood samples were collected in 5-ml vacuum collection tubes with no anticoagulant (Becton Dickinson Vacutainer ref. 369032) for serum and BAL fluid separation in standardized conditions to minimize sources of preanalytical variation. All samples with visible hemolysis were discarded.
The tubes with no anticoagulant were allowed to clot at room temperature for 15-20 minutes and were separated by centrifugation at 3000 g for 10 minutes; then, the sample was frozen (−80°C) and analyzed within two months. When all specimens were available, they were thawed, mixed, recentrifuged (at 3000 g for 10 minutes) and analyzed at room temperature. The BAL fluid and serum samples were thawed once.
Measurement of the Analyte
The collected serum and BAL fluid samples were analyzed using a Human Pulmonary Surfactant Associated Protein B ELISA kit (Catalogue No: 201-12-1070) according to the
manufacturer’s instructions (Sunred Biological Technology, Shanghai, PR China).
The samples terminating with the enzyme substrate reac-tion were spectrophotometrically measured at a wavelength of 450 nm using Triturus Instruments (Barcelona, Spain). Detection ranges of this kit were 0.3 ng/mL−70 ng/mL.
Statistical Analysis
All analyses were performed using IBM SPSS Statistics Version 20.0 statistical software package (Armonk, NY, USA). Categorical variables were expressed as numbers and percent-ages, while continuous variables were summarized as mean ± standard deviation, and as median and minimum-maximum where appropriate. The normality of distribution for contin-uous variables was confirmed via the Kolmogorov-Smirnov test. For comparison of said variables between two groups, the Student t test or Mann-Whitney U test was used depend-ing on whether the statistical hypotheses were fulfilled. For comparison of two related (paired) continuous variables, a paired samples t test or Wilcoxon Signed Rank test was used, again depending on whether the statistical hypotheses were fulfilled. The statistical level of significance for all tests was considered to be P = .05.
RESULTS
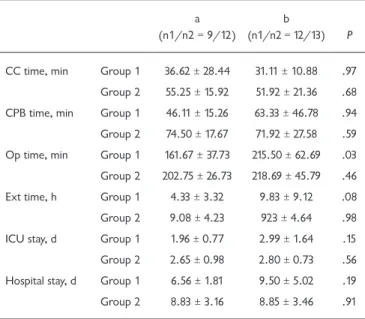
In this study, 46 pediatric heart surgery patients due to undergo elective corrective surgery were assessed. Patients were divided into two groups according to pulmonary arterial pressure, as measured via transthoracic echocardiography in the preoperative examination. There were 21 patients in the pulmonary normotensive group (group 1) and 25 in the PH (group 2) group. Table 1 presents demographic variables (sex, age, heart disease) of the patients. The mean operation time of group 1a patients was found to be shorter than that of their group 2a and group 2b counterparts (Table 2). Although the mean extubation time of group 1a patients was shorter than that of group 1b participants, no statistically significant dif-ference was detected (P = .08) (Table 2). This difdif-ference may Table 1. Distribution of the 46 patients with Congenital Heart
Defects Regarding Demographic Characteristics, Type of Heart Disease, Operations
Variables Frequency % Operations
Sex Female 24 52.2 Male 22 47.8 Age 6 months to 1 year 17 37 >1 year to 5 years 20 35.7 >5 to 10 years 7 15.2 >10 years 2 4.3 Heart defects
ASD 7 15.2 Primer repair
VSD 17 37 Patch plasty
Subaortic Membrane 2 4.3 Membrane resection
PAPVDA 2 4.3 Patch plasty
TAPVDA 1 2.2 Total correction
Complete AVSD 9 19.6 Total correction
TOF 8 17.4 Total correction
Total 46 100
ASD indicates atrial septal defect; VSD, ventricular septal defect; PAPVDA, partial abnormal pulmonary venous drainage anomaly; TAPVDA, total ab-normal pulmonary venous drainage anomaly; AVSD, atrioventricular septal defect; TOF, tetralogy of Fallot. P < .05.
Table 2. Comparison of Operative and Postoperative Data between Groups
a (n1/n2 = 9/12)
b
(n1/n2 = 12/13) P
CC time, min Group 1 36.62 ± 28.44 31.11 ± 10.88 .97 Group 2 55.25 ± 15.92 51.92 ± 21.36 .68 CPB time, min Group 1 46.11 ± 15.26 63.33 ± 46.78 .94 Group 2 74.50 ± 17.67 71.92 ± 27.58 .59 Op time, min Group 1 161.67 ± 37.73 215.50 ± 62.69 .03 Group 2 202.75 ± 26.73 218.69 ± 45.79 .46 Ext time, h Group 1 4.33 ± 3.32 9.83 ± 9.12 .08 Group 2 9.08 ± 4.23 923 ± 4.64 .98 ICU stay, d Group 1 1.96 ± 0.77 2.99 ± 1.64 .15 Group 2 2.65 ± 0.98 2.80 ± 0.73 .56 Hospital stay, d Group 1 6.56 ± 1.81 9.50 ± 5.02 .19
Group 2 8.83 ± 3.16 8.85 ± 3.46 .91
Data are presented as mean ± SD unless otherwise indicated. a indicates ventilated; b, non-ventilated; CC, cross clamp; CPB, cardiopulmonary bypass; Op, operation; Ext, extubation; ICU, intensive care unit; n1/n2 = group 1/group 2. P < .05.
Table 3. Distribution of the 46 patients as to RACHS-1 Score Risk Categories and Distribution of In-Hospital Mortality Regarding RACHS-1 Score Risk Categories
RACHS-1 Frequency (%) Observed Mortality (%) Expected Mortality (%) Category 1 9 (19.6) — 0.4 Category 2 28 (60.8) 1 (3.6) 3.8 Category 3 9 (19.6) 1 (11.1) 9.5 Total 46 2 (4.34)
be statistically significant in wider patient groups. In addi-tion, no statistically significant difference was found between groups 1 and 2 in other demographic data (Table 1).
When the risk-adjusted classification for congenital heart surgery (RACHS-1) was used, it was observed that the RACHS-1 category frequencies in our population were as follows: category 1, 19.6%; category 2, 60.8%; category 3, 19.6%. The latter was excluded from the statistical analysis. There were no patients in categories 4, 5, and 6 (Table 3).
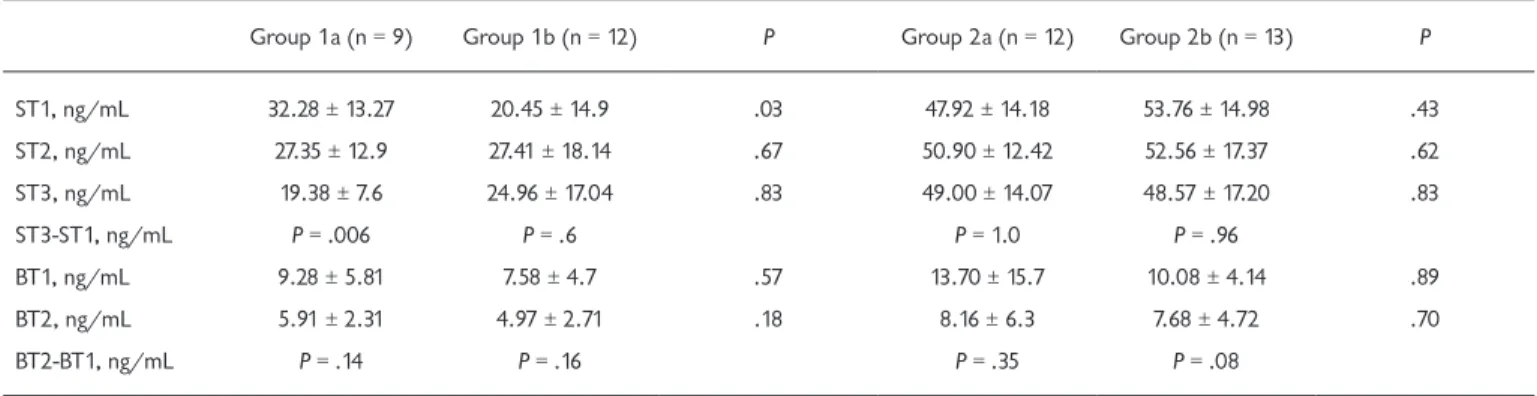
Every of the groups were selected randomly in their own situation. So the initial values (ST1) of these groups were not important for statistical comparison on their own. Tables 4 and 5 demonstrate serum SPB levels before the opera-tion (ST1) as well as 4 hours (ST2) and 24 hours afterward (ST3). Initial serum SPB values of group 1a (ST1: 32.28 ± 13.27 ng/mL) were significantly higher than group 1b (ST1: 20.45 ± 14.90 ng/mL) (P = .03). Postoperative values (ST2: 27.35 ± 12.9 ng/mL; ST3: 19.38 ± 7.6 ng/mL) were seen to be reduced compared to preoperative values (ST1: 32.28 ± 13.27 ng/mL) in group 1a, which is a significant finding, as it shows that lung protection provided by ventilation results in less CPB-dependent alveolar-capillary barrier damage. The serum SPB values were increased during postop 4th hour (ST2: 27.41 ± 18.14 ng/mL) and decreased during postop 24th hour (ST3: 24.96 ± 17.04 ng/mL) when these values were compared to the preoperative value of SPB (ST1: 20.45 ± 14.9 ng/mL) in group 1b (Table 4). A significant decrease was recorded in mean values of SPB during ST3 (19.38 ± 7.60 ng/mL) compared to ST1 (32.28 ± 13.27 ng/mL) in group 1a (P = .006). But in group 1b, mean values of SPB increased during ST2 (27.41 ± 18.14 ng/mL) compared to ST1 (20.45 ± 14.9 ng/mL) and then decreased during ST3 (24.96 ± 17.04 ng/mL), although this decrease of SPB values was observed to be higher during ST3 compared to ST1 in group 1b. While BT values decreased postoperatively (BT2) (Table 4), no sta-tistically significant result was found between the BT1 (group 1a: 9.28 ± 5.81 ng/mL; group 1b: 7.58 ± 4.7 ng/mL) and BT2 (group 1a: 5.91 ± 2.31 ng/mL; group 1b: 4.97 ± 2.71 ng/mL)
in groups 1a and 1b (Table 4). Similarly, no statistical differ-ences were found in group 2a and 2b. But in group 2a and 2b, the values of BT1 (group 2a: 13.7 ± 15.7 ng/mL; group 2b: 10.08 ± 4.14 ng/mL) and BT2 (group 2a: 8.16 ± 6.3 ng/mL; group 2b: 7.68 ± 4.72 ng/mL) were prominently higher than group 1a and group 1b values (Table 4).
The mean serum SPB values of groups 1a and 1b were found to be lower than those of groups 2a and 2b (Table 4). The ST1 mean values of groups 2a (47.92 ± 14.18 ng/mL) and 2b (53.76 ± 14.98 ng/mL) were found to be significantly higher than those of groups 1a (32.28 ± 13.27 ng/mL) and 1b (20.45 ± 14.9 ng/mL) (Table 4). No statistically signifi-cant difference was detected between the ST1, ST2, and ST3 values of groups 2a and 2b (Table 4). There was also no statis-tically significant difference between the BT1 and BT2 values of groups 2a and 2b (Table 4). It was observed that ST1 and ST2 values were not affected by ventilation in either group (Table 4).
Table 5 provides a comparison of serum and BAL SPB values between groups 1a and 2a. The same comparison was made between group 1b and 2b. ST1, ST2, ST3, BT1, and BT2 mean values of groups 1a and 2a were evaluated among themselves, producing interesting results (Table 5). ST1 (P = .033), ST2 (P = .003), and ST3 (P < .001) mean surfactant pro-tein B values of group 1a were found to be significantly lower, statistically, than those of group 2a, and this discrepancy was found to widen from ST1 to ST3 (Table 5). No statistically significant difference was revealed between the BAL values of these two groups (Table 5). Table 5 illustrates the comparison of serum and BAL SPB values between groups 1b and 2b. ST1 (P = < .001), ST2 (P = .003), and ST3 (P = .003) values of group 1b were observed to be significantly lower, statistically, than those of group 2b (Table 5). There was no statistically significant difference between the BAL-SPB values of these two groups (Table 5). However, the evaluation of the same two groups produced a remarkable result: the ST1, ST2, and ST3 values of group 1a and 1b were far lower than those of group 2a and 2b.
Table 4. Comparison of Group 1a-Group 1b and Group 2a-Group 2b Patients’ Serum and Bronchoalveolar Lavage Surfactant Protein B Values
Group 1a (n = 9) Group 1b (n = 12) P Group 2a (n = 12) Group 2b (n = 13) P
ST1, ng/mL 32.28 ± 13.27 20.45 ± 14.9 .03 47.92 ± 14.18 53.76 ± 14.98 .43 ST2, ng/mL 27.35 ± 12.9 27.41 ± 18.14 .67 50.90 ± 12.42 52.56 ± 17.37 .62 ST3, ng/mL 19.38 ± 7.6 24.96 ± 17.04 .83 49.00 ± 14.07 48.57 ± 17.20 .83 ST3-ST1, ng/mL P = .006 P = .6 P = 1.0 P = .96 BT1, ng/mL 9.28 ± 5.81 7.58 ± 4.7 .57 13.70 ± 15.7 10.08 ± 4.14 .89 BT2, ng/mL 5.91 ± 2.31 4.97 ± 2.71 .18 8.16 ± 6.3 7.68 ± 4.72 .70 BT2-BT1, ng/mL P = .14 P = .16 P = .35 P = .08
Data are presented as mean ± SD unless otherwise indicated. ST1 indicates preoperative values of serum surfactant B; ST2, serum surfactant protein-B values at the fourth hour postoperative; ST3, serum surfactant protein-protein-B values at the 24th hour postoperative; protein-BT1, preoperative bronchoalveolar lavage surfactant protein-B values; BT2, bronchoalveolar lavage surfactant protein-B values at the fourth hour postoperative. P < .05.
DISCUSSION
CBP operations expose the blood to large areas of syn-thetic materials that trigger the production and release of numerous chemotactic and vasoactive substances [Royston 1997]. Activation of neutrophils, with subsequent trapping in the pulmonary circulation, causes profound pulmonary endo-thelial, epiendo-thelial, and interstitial damage [Westaby 1985]. This may contribute to increases in pulmonary capillary endothelial permeability, reductions in lung compliance, and impaired gas exchange [Hachenberg 1994].
SPB is a substance that is produced solely by the lungs, and is synthesized and secreted into the alveolar space when-ever needed to ease surfactant tension. An interruption of lung perfusion during CBP results in ischemia, inflammation, and ceased lung ventilation and, in turn, alveolar atelectasis, alveolar-capillary barrier damage, and a resultant increase in barrier permeability. Under normal conditions, surfactant protein B (which is either absent from or present in trace quantities in the serum) penetrates into the serum through the alveolar-capillary barrier. An increase in the amount of surfactant protein B in the serum is an important indicator of the damage caused to the alveolar-capillary membrane during CBP. In our study, there was no statistically significant differ-ence between the BT1 and BT2 values of the BAL samples collected from pulmonary normotensive and hypertensive patients; this is a key finding, as it shows that surfactant syn-thesis and secretion into the alveolar space continues nor-mally in a healthy lung if required.
SPB has been proposed as a marker of lung damage by several groups who evaluated patients with both lung and car-diac disease [De Pasquale 2003]. A rapid SPB increase post-CPB (with mean duration of 2 hours), and a return to almost normal values within 24 hours, was shown [Dobbs 1989]. Therefore, SPB can be seen as a rapid and sensitive marker of lung distress [Dobbs 1989]. In experimental studies, the lung is ventilated at high volumes and increasing the ventila-tion speed boosts surfactant secreventila-tion [Hamm 1992]. By trig-gering respiratory alkalosis, hyperventilation also augments said secretion. It has been suggested that apnea during CPB promotes activation of lysosomal enzymes in the pulmonary
circulation, which in turn is correlated with the incidence of postoperative pulmonary dysfunction. Certain maneuvers can be applied to prevent this dysfunction, such as intermit-tent ventilation or application of continuous airway pressure (CPAP) during CPB [Ng 2002]. John et al showed in their randomized study that constant ventilation during CPB at a tidal volume of 5 mL/kg resulted in a significant reduction in extravascular lung water and a shorter extubation time. To date, the evidence for the benefits of maintaining ventilation alone during CPB has been inconsistent, with most studies showing no significant preservation of lung function [Berry 1993]. Similarly, no differences in pulmonary membrane per-meability were found between ventilated and nonventilated patients undergoing CPB [Keavey 1997].
In summary, in this study we investigated the effect of intraoperative protective ventilation on lung injury follow-ing congenital heart surgery. We found that such ventila-tion mitigated damage to the alveolar-capillary membrane, as evidenced by the serum and BAL marker surfactant tein B. We also found a reduction of serum surfactant pro-tein B in group 1a. The serum ST1 values of said group decreased when compared to those of serums ST2 and ST3, while in group 1b, ST2 was found to rise and ST3 was observed to fall (although it remained higher than ST1). In this regard, the statistically significant differences, particu-larly between serum ST1 and ST3 (P = .006), are interest-ing. This is deemed an important finding, as it shows that ultraprotective ventilation reduces the lung damage caused by CPB in pulmonary normotensive patients. Pulmonary hypertension leads to an increase in pulmonary arterial pressure and, naturally, to capillary endothelium deterio-ration at the alveolar-capillary level. A statistically higher S-SPB value, as recorded during the present study in the pulmonary hypertensive patients, is an important indicator of preoperative alveolar-capillary barrier damage in these subjects. Ultraprotective ventilation provided during the operation did not reduce S-SPB values in the nonpulmo-nary hypertensive patients, which is a pertinent finding as it signifies preoperative damage. In light of the compari-son between the durations of the operation and disease in Table 5. Comparison of Group 1a-Group 2a and Group 1b-Group 2b Patients’ Serum and Bronchoalveolar Lavage Surfactant Protein B Values
Group 1a Group 2a P Group 1b Group 2b P
ST1, ng/mL 32.28 ± 13.26 47.92 ± 14.18 .033 20.45 ± 14.9 53.76 ± 14.98 < .001
ST2, ng/mL 27.34 ± 12.9 50.90 ± 12.42 .003 27.41 ± 18.13 52.56 ± 17.35 .003
ST3, ng/mL 19.38 ± 7.59 49.00 ± 14.06 < .001 24.96 ± 17.03 48.57 ± 18.2 .003
BT1, ng/mL 9.27 ± 5.8 13.70 ± 15.7 .67 7.58 ± 4.7 10.08 ± 4.14 .174
BT2, ng/mL 5.91 ± 2.31 8.16 ± 6.3 .49 4.97 ± 2.71 7.67 ± 4.72 .057
Data are presented as mean ± SD unless otherwise indicated. ST1 indicates preoperative values of serum surfactant protein-B; ST2, serum surfactant protein-B values at the fourth hour postoperative; ST3, serum surfactant protein-B values at the 24th hour postoperative; BT1, preoperative bronchoalveolar lavage surfactant protein-B values; BT2, bronchoalveolar lavage surfactant protein-B values at the fourth hour postoperative. P < .05.
the pulmonary hypertensive patients, it would be wrong to expect that ventilation could effectively protect the alveo-lar-capillary barrier.
It is well known that CPB is responsible for an inflamma-tory reaction that leads to diffuse tissue injury and increased (pulmonary) vascular permeability. In part, this is caused by the retransfusion of unwashed cardiotomy suction blood, which is used as a basic blood conservation strategy. This retransfused blood has been shown to be proinflammatory [De Haan 1995] and detrimental to hemostasis [Greene 1999]. In a similar way to adults who undergo cardiac sur-gery, CPB also occasions a strong systemic inflammatory response in children [Chang 2003]. The intensity of the inflammation is, to some extent, related to the extent of the lung injury incurred during CPB, as evidenced by the reduction of postoperative pulmonary dysfunction through the strategies aimed at inhibiting systemic inflammatory response, especially sequestration of neutrophils in the lung tissue [Gott 1998].
Inflammation is exacerbated in patients who undergo CBP for longer periods, meaning that they are exposed to more lung damage. This finding has prompted research-ers to conduct studies regarding interventions aimed at shortening operation times, as well as lung protection stud-ies; as was the case here, with ultraprotective ventilation deployed as the approach. The results of this study suggest that it would be useful to conduct further studies on pedi-atric heart surgery, with a particular emphasis on the use of ultraprotective ventilation.
Conclusion
A key finding of this study was that there is no statis-tically significant difference between the BAL-SPB values of pulmonary normotensive and pulmonary hypertensive pediatric patients on CPB. This is highly pertinent in that it indicates sufficient secretion to the alveolar space of the healthy lung. Since the permeability of the alveolar-capil-lary barrier was compromised in the preoperative period in the PHT congenital cardiac patients, we inferred in this study that this permeability could not be protected by ultraprotective ventilation. Based on the decreased serum SPB levels of the pulmonary normotensive congenital car-diac patients who received ultraprotective ventilation, it was found that the permeability of the alveolar-capillary barrier was reduced and, therefore, the lung was protected in this group of patients.
ACKNOWLEDGMENT
We thank Ilker Unal for statistical analysis. REFERENCES
Acute Respiratory Distress Syndrome Network. 2000. Ventilation with lower tidal volumes as compared with traditional tidal volumes for acute lung injury and the acute respiratory distress syndrome. N Engl J Med 342:1301-8.
Agostoni P, Banfi C, Brioschi M, Magrì D, Sciomer S, Berna G, et al.
2011. Surfactant protein B and RAGE increases in the plasma during cardiopulmonary bypass: a pilot study. Eur Respir J 37:841-7.
Berry CB, Butler PJ, Myles PS. 1993. Lung management during cardio-pulmonary bypass: Is continuous positive airway pressure beneficial? Br J Anaesth 71:864-8.
Chang AC. 2003. Inflammatory mediators in children undergoing car-diopulmonary bypass: is there a unified field theory amidst this biomo-lecular chaos? Pediatr Crit Care Med 4:386-7.
De Haan J, Boonstra PW, Monnink SH, Ebels T, van Oeveren W. 1995. Retransfusion of suctioned blood during cardiopulmonary bypass impairs hemostasis. Ann Thorac Surg 4:901-7.
De Pasquale CG, Arnolda LF, Doyle IR, Grant RL, Aylward PE, Bersten AD. 2003. Prolonged alveolocapillary barrier damage after acute cardio-genic pulmonary edema. Crit Care Med 31:1060-7.
Dobbs LG. 1989. Pulmonary surfactant. Ann Rev Med 40:431-46. Engels GE, Gu YJ, van Oeveren W, Rakhorst G, Mariani MA, Erasmus ME. 2013. The utility of lung epithelium specific biomarkers in cardiac surgery: a comparison of biomarker profiles in on- and off-pump coro-nary bypass surgery. J Cardiothorac Surg 8:4.
Engels GE, van Klarenbosch J, Gu YJ, van Oeveren W, de Vries AJ. 2016. Intraoperative cell salvage during cardiac surgery is associated with reduced postoperative lung injury. Interactive Cardiovasc Thorac Surg 22:298-304.
Futier E, Constantin JM, Paugam-Burtz C, et al. 2013. A trial of intra-operative low-tidal-volume ventilation in abdominal surgery. N Engl J Med 369:428-37.
Gott JP, Cooper WA, Schmidt FE Jr, Brown WM 3rd, Wright CE, Mer-lino JD, et al. 1998. Modifying risk for extracorporeal circulation: trial of four antiinflammatory strategies. Ann Thorac Surg 66:747-53.
Greene KE, Wright JR, Steinberg KP, Ruzinski JT, Caldwell E, Wong WB, et al. 1999. Serial changes in surfactant-associated proteins in lung and serum before and after onset of ARDS. Am J Respir Crit Care Med 160:1843-50.
Hachenberg T, Tenling A, Nyström SO, Tyden H, Hedenstierna G. 1994. Ventilation perfusion inequality in patients undergoing cardiac surgery. Anesthesiology 80: 509-19.
Hamm H, Fabel H, Bartsch W. 1992. The surfactant system of the adult lung: Physiology and clinical perspectives. Clin Invest 70:637-57. Keavey PM, Hasan A, Au J, Dark JH. 1997. The use of 99Tcm-DTPA aerosol and caesium iodide mini-scintillation detectors in the assess-ment of lung injury during cardiopulmonary bypass surgery. Nucl Med Commun 18:38-43.
Magnusson L, Zemgulis V, Tenlig A, et al. 1998. Use of a vital capacity maneuver to prevent atelectasis after cardiopulmonary bypass: An experi-mental study. Anesthesiology 88:134-42.
Ng CS, Wan S, Yim AP, Arifi AA. 2002. Pulmonary dysfunction after cardiac surgery. Chest 121:1269-77.
Pasquina P, Tramer MR, Walder B. 2003. Prophylactic respiratory phys-iotherapy after cardiac surgery: systematic review. BMJ 327:1379. Poulain FR, Allen L, Williams MC, Hamilton RL, Hawgood S. 1992. Effects of surfactant apolipoproteins on liposome structure: implications for tubular myelin formation. Am J Physiol 262:730-9.
Royston D. 1997. The inflammatory response and extracorporeal circu-lation. J Cardiothorac Vasc Anesth 11:341-54.
Schreiber JU, Lancé MD, de Korte M, Artmann T, Aleksic I, Kranke P. 2012. The effect of different lung-protective strategies in patients during cardiopulmonary bypass: a meta-analysis and semiquantitative review of randomized trials. J Cardiothorac Vasc Anesth 26:448-54.
Serrano AG, Perez-Gil J. 2006. Protein-lipid interactions and surface activ-ity in the pulmonary surfactant system. Chem Phys Lipids 141:105-18.
Sundar S, Novack V, Jervis K, et al. 2011. Influence of low tidal volume ventilation on time to extubation in cardiac surgical patients. Anesthesi-ology 114:1102-10.
Westaby S, Fleming J, Royston D. 1985. Acute lung injury during cardio-pulmonary bypass, the role of neutrophil sequestration and lipid peroxi-dation. Transam Soc Artif Intern Organs 31:604-9.