http://journals.tubitak.gov.tr/agriculture/ © TÜBİTAK
doi:10.3906/tar-1204-58
Dry matter accumulation and forage quality characteristics
of different soybean genotypes
Esvet AÇIKGÖZ1,*, Mehmet SİNCİK1, Gary WIETGREFE2, Mustafa SÜRMEN3, Semiha ÇEÇEN4, Tamer YAVUZ5, Cengiz ERDURMUŞ4, Abdurrahim Tanju GÖKSOY1
1 Department of Field Crops, Faculty of Agriculture, Uludağ University, 16059 Bursa, Turkey 2 Syngenta Seeds, Inc., Sioux Falls, South Dakota, USA
3 Department of Field Crops, Faculty of Agriculture, Iğdır University, Iğdır, Turkey 4West Mediterranean Agricultural Research Institute, Antalya, Turkey
5 Department of Field Crops, Faculty of Agriculture, Ahi Evran University, Kırşehir, Turkey
1. Introduction
Soybean [Glycine max (L.) Merr.] is a productive, high-quality summer annual forage legume (Hintz et al. 1992), but for several decades limited soybean acreage has been used for hay, silage, or green manure. However, interest in new high-yielding forage soybean varieties for dairy and livestock production (Devine and Hatley 1998; Sheaffer et al. 2001) and cover crops (Abdul-Baki et al. 1997) for wildlife nutrition (McPeake et al. 2010), as well as sourcing native strains for genetic diversity (CSIRO 2004), has increased.
Cultivar and management practices affected dry matter (DM) yield and nutritive value in soybean. Forage yields of grain-type cultivars vary depending on the location and maturity stage at harvest (Hintz et al. 1992; Altinok et al.
2004). Sheaffer et al. (2001) found no yield differences between later-maturing forage-type and earlier-maturing grain-type soybeans grown for forage; however, forage soybeans have superior DM yields to grain types if harvested at a similar maturity stage (Devine and Hatley 1998; Sheaffer et al. 2001). Forage soybean yields vary by year and geography. In south-central United States studies at Fayetteville and Rohwer, Arkansas, the forage soybean cultivars Derry, Donegal, and Tyrone produced DM
yields ranging from 5216 to 7118 kg ha–1 (Nayigihugu et
al. 2000). In the northeastern United States, DM yield of
Donegal ranged from 4500 to 6300 kg ha–1 and from 8700
to 13,900 kg ha–1 in 2000 and 2001, respectively. In the
United Kingdom, DM yields of Derry and Donegal ranged
from 5910 to 6090 kg ha–1 for the early harvest and 7680 to
Abstract: Three different soybean [Glycine max (L.) Merr.] cultivars (A-3127, Derry, and Yemsoy) were evaluated for dry matter (DM)
yield, plant components, and crop growth rate (CGR) at different row spacings and harvesting stages in 3 locations with Mediterranean-type climate in a split-split plot design with 3 replications in 2009 and 2010. In addition, crude protein (CP), crude protein yield (CPY), acid detergent fiber (ADF), neutral detergent fiber (NDF), total digestible nutrients (TDN), and relative feed value (RFV) of harvested forage soybeans were determined at the Bursa (Turkey) location. Increased row spacings significantly reduced DM yield at all locations. Combined over other main effects, the 25-cm row spacing produced 35% more DM yield than the 75-cm row spacing. Row spacings greatly affected DM yield at the R5 and particularly the R7 stage, but this effect was minimal at the R1 stage. The forage-type cultivar Derry produced significantly higher DM yield in all locations, particularly at the R5 and R7 stages. The constituent components of DM were similar at different row spacings of soybean cultivars. In general, the CGR decreased from 25-cm row spacing to 75-cm row spacing in all locations, and the CGR of the cultivars varied significantly according to harvest period, row spacing, and location. Derry had a significantly higher CGR than the other cultivars in the Antalya and Bursa locations. Quality characteristics of soybean forage were not significantly affected by row spacing and showed little effect by cultivar. Harvest stage significantly affected CP, ADF, NDF, TDN, and RFV concentrations of soybean forage. It was concluded that in Mediterranean environments forage-type soybeans (i.e. Derry) can be seeded in narrow rows (25 cm) at high plant population (100 kg ha–1) and offer the most DM yield when harvested at later R stages (e.g.,
R7) rather than at the early reproductive stage.
Key words: Glycine max (L.) Merr., row spacing, harvest stage, chemical composition, crop growth rate
Received: 26.04.2012 Accepted: 15.07.2012 Published Online: 15.01.2013 Printed: 15.02.2013
7950 kg ha–1 DM for the late harvest. In the second season
Donegal was the highest yielding at the early harvest with
12,100 kg ha–1, and line SG13#169 also produced 12,100 kg
ha–1 at the late harvest (Koivisto et al. 2003). Recent studies
at 3 different locations with Mediterranean climates in Turkey demonstrated that soybeans managed for forage
can average 9300 and 11,300 kg ha–1 DM yield at the R4
and R6 stages, respectively, and contain 13.3% crude protein (CP), 8.2% degradable protein, and 60.6% in vitro DM digestibility (Acikgoz et al. 2007).
The DM partitioning and nutritive value of soybean plant parts was not affected by population density or row spacing; harvest maturity had the greatest effect in the soybean cultivars Corsoy 79, Pella, and Williams 82 (Hintz et al. 1992; Hintz and Albrecht 1994). Similarly, forage quality of total herbage and leaf and pod fractions were not affected by row spacing (Sheaffer et al. 2001). Acikgoz et al. (2007) indicated no significant difference between row spacings of 20, 40, or 60 cm, while 80 cm provided the lowest forage yield. Increased seeding rates increased DM yield. Harvest maturity affected DM yield, which averaged
2373, 5559, 9255, and 11,266 kg ha–1 at the V5, R2, R4,
and R6 stages, respectively, in this study. Seiter et al. (2004) reported that population densities had no consistent effect on forage yield or quality. However, Munoz et al. (1983) reported increased DM yields and reduced digestibility as plant density increased when harvest was delayed until late reproductive growth. Soybean harvested for forage from R6 to R7 maximized both the DM yield and forage quality compared to earlier or later-stage harvesting (Munoz et al. 1983; Hintz et al. 1992; Blount et al. 2003).
Whether they are used for beef, dairy, or wildlife (e.g., deer), optimal forage plants are very digestible, have low fiber, and are high in protein and energy (McPeake et al. 2010). Soybean can serve as high-quality alternative forage in summer, fall, and winter, but little is known about DM accumulation, plant components, forage quality, recommended row spacing, and forage-type seed yield, especially when soybean cultivars are produced in a Mediterranean environment. This study was conducted to evaluate different types of soybean cultivars for DM yield, plant components, and crop growth rate (CGR) at different row spacings and harvesting stages in 3 different Mediterranean-type environments. In addition, at the Bursa, Turkey, location, CP, crude protein yield (CPY), acid detergent fiber (ADF), neutral detergent fiber (NDF), total digestible nutrients (TDN), and relative feed value (RFV) of the harvested forage soybeans were determined. 2. Materials and methods
Field studies were conducted in 2009 and 2010 at 3 different locations in Turkey: Antalya (36°53′N, 30°42′E), Bursa (40°11′N, 29°04′E), and Samsun (41°17′N, 36°20′E).
All experimental fields are located in the coastal area of Turkey at a very low elevation (42–70 m above sea level). Location soils are clay or clay loam, slightly alkaline
(pH 7.1–8.2), rich in potassium (840–1313 kg ha–1), and
poor–medium in phosphorus (73–133 kg ha–1), and they
contain 1.6%–2.8% organic matter. All locations have a Mediterranean-type climate. This climate is characterized by cool and wet winter and spring seasons and hot and dry summers. Long-term average total precipitation varies
from 685 to 801 mm year–1 with an average of 23%–29%
falling during the soybean growing period (April– September). The long-term mean yearly temperature is 16.2 °C, relative humidity is 68.4%, and mean temperature during the growing period is 21.1 °C at the test locations.
A typical grain-type soybean [Glycine max (L.) Merr.] cultivar A-3127 (group III), a typical forage-type soybean cultivar Derry (group VI), and an intermediate-type soybean cultivar Yemsoy (group IV) were used in this study. Yemsoy is a tall and robust soybean cultivar registered for forage production in Turkey. The cultivars were grown at 3 row spacings (25, 50, and 75 cm) and harvested at 4 stages, R1 (beginning bloom), R3 (beginning pod), R5 (beginning seed), and R7 (beginning maturity), to evaluate the integrated effects of cultivar, row spacing, cutting stage on DM yield, and other yield components in a randomized split-split plot design with 3 replications. Row spacings were main plots and cultivar subplots, and harvesting stages were also at sub-subplots. Individual
subplot size was 4.8 × 6.0 m = 28.8 m–2.
The seeding rate was 100 kg ha–1. Seedings were made
by hand in mid-April at all locations in each experimental year. The soybean crop was not inoculated. In both
growing seasons, 100 kg ha–1 N fertilizer was applied after
seeding. Weed control was achieved manually. Irrigation was applied 3 times, at the V5 (5 unfolded trifoliate leaves), R2 (full bloom), and R5 (beginning seed) stages, with a rotary sprinkler to maintain the soil near field capacity. The timing of irrigation was estimated visually as the soil surface dried.
Plant counts were made in 2 randomly selected rows (2 m in length) in each plot at the V4 (4 unfolded trifoliate leaves) stage. DM yield data were collected 4 times and corresponded to reproductive growth stages at R1, R3, R5, and R7. At each sampling date, 2-m sections of the center rows were harvested for DM production in each
plot, and yield was calculated in kg ha–1 according to row
spacings. The 500-g samples from each plot were dried at 70 °C for 48 h for DM yield determination. Randomly selected plants (10 from each plot) were measured for stem diameter and plant height, separated for constituent plant components (leaflet, pedicel, stem, and flower plus pods), and then weighed on all sampling dates. The components were dried and weighed again. Crop growth rates (CGRs)
(g m–2 day–1) during the VE (emergence) to R1, R1–R3,
R3–R5, and R5–R7 periods were determined for each plot according to the method of Pedersen and Lauer (2004). In the periods, CGR is believed to be linear (Pederson 2004).
The CP, CPY, ADF, NDF, TDN, and RFV of DM were determined only at the Bursa location in both experimental years. During every harvest stage, N was determined by the micro-Kjeldahl technique on duplicate DM for each treatment. CP content (N × 6.25) was calculated. ADF and NDF concentrations were measured according to the standard laboratory procedures for forage quality analysis
of Ankom Technology (Ankom2000 Fiber Analyzer,
Ankom Technology Corp., Fairport, NY, USA). Total digestible nutrients and RFV were estimated according to the methods of Rohweder et al. (1978) and Aydin et al. (2010).
Data for each location were analyzed separately. All data were subjected to analysis of variance for each character using MINITAB (University of Texas, Austin) and MSTAT-C (Version 2.1, Michigan State University, 1991) software. The significance of treatment, main effects, and interactions were determined at the 0.05 and 0.01 probability levels by F-test. The F-protected least significant difference (LSD) was calculated at the 0.05 probability level.
3. Results
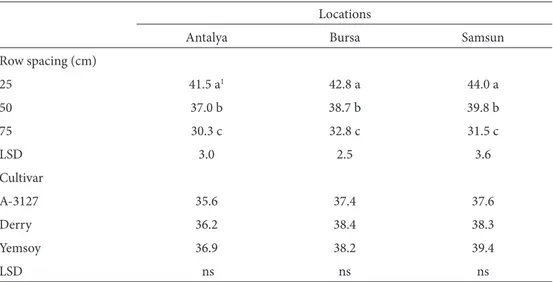
Realized plant stands of soybean cultivars according to row spacings were statistically significant at Antalya, Bursa, and Samsun (Table 1). The highest final plant population was obtained from 25-cm row spacing. However, realized plant stands according to cultivar were not statistically significant at all locations.
An analysis of variance for the combined data of the 2 years indicated that year significantly affected all characters measured except DM yield in Samsun. With the exception of plant height for row spacing in Antalya, row spacing, cultivar, and harvest stage were significant for all parameters in all locations. On the other hand, row spacing × cultivar, row spacing × harvest stage, and cultivar × harvest stage interactions were significant at the 1% level of probability for DM yield in all locations, with the exception of row spacing × cultivar interaction in Bursa.
Plant height increased slightly with row spacing at the Bursa and Samsun locations, and the differences between row spacings were statistically significant. The plant height of the forage cultivar Derry was greater than the intermediate-type soybean cultivar Yemsoy and the typical grain-type soybean cultivar A-3127 in all locations. Plant height averaged 86.7 cm at R1, and reached 152.9 cm at the R7 stage (Table 2). Although the differences were statistically significant, stem diameter varied slightly between row spacings and cultivars. Stem diameter significantly increased with advancing stages.
At all locations increased row spacing significantly
reduced DM yield, which averaged from 14,094 kg ha–1 at
25-cm row spacing to 9135 kg ha–1 at 75-cm row spacing
(Table 2). Combined over other main effects, the 25-cm row spacing produced 35% more DM yield than the 75-cm row spacing. The effect of row spacing × cultivar interaction on DM yield was statistically significant in Antalya and Samsun but insignificant at the Bursa location (Table 3). The DM yield of all cultivars decreased with increasing row spacing, but the cultivars responded differently according to row spacing. In row spacing ×
Table 1. Realized stand (plants m–2) at V4 according to row spacing and seeding rate at 100 kg ha–1.
Locations
Antalya Bursa Samsun
Row spacing (cm) 25 41.5 a1 42.8 a 44.0 a 50 37.0 b 38.7 b 39.8 b 75 30.3 c 32.8 c 31.5 c LSD 3.0 2.5 3.6 Cultivar A-3127 35.6 37.4 37.6 Derry 36.2 38.4 38.3 Yemsoy 36.9 38.2 39.4 LSD ns ns ns
Ta bl e 2. P la nt h eig ht (cm), s tem di am et er (mm), a nd D M y ie ld (kg h a –1) o f 3 s oy be an c ul tiva rs (R1–R7) a t 3 lo ca tio ns (2-y ea r a vera ge). Loc at io ns A nt al ya Bu rs a Sa m sun Pl ant heig ht St em di am et er D M y ie ld Pl ant heig ht St em di am et er D M y ie ld Pl ant heig ht St em di am et er D M y ie ld Ro w s pacin g (cm) 25 125.7 8.7 b 1 13,822.4 a 118.3 b 10.5 b 13,884.0 a 123.8 c 8.4 a 14,576.1 a 50 128.2 9.4 a 11,188.0 b 123.4 a 11.2 a 11,306.2 b 127.2 b 8.3 a 9944.5 b 75 127.4 9.5 a 9207.3 c 122.0 a,b 10.7 b 9586.7 c 130.3 a 7.9 b 8612.8 c LS D (0.05) ns 0.3 366.1 3.7 0.4 329.2 2.3 0.4 316.3 Cul tiv ar A-3127 108.9 c 9.1 b 10,030.4 c 107.6 c 10.0 c 10,444.6 c 117.9 c 8.4 a 10,480.5 c Ye m so y 114.2 b 8.7 c 11,658.3 b 115.8 b 10.6 b 11,503.0 b 122.3 b 7.9 b 10,985.1 b De rr y 158.2 a 9.8 a 12,529.1 a 140.3 a 11.8 a 12,828.2 a 141.3 a 8.3 a 11,667.3 a LS D (0.05) 2.0 0.2 252.6 3.0 0.2 206.4 3.2 0.3 218.4 H ar ve st st ag e R1 98.7 d 8.3 c 7812.6 d 83.5 d 8.8 c 6990.3 d 77.9 d 5.1 c 5846.1 d R3 130.1 c 9.6 a 10,764.0 c 119.2 c 11.3 b 9668.2 b 122.9 c 8.4 b 9849.5 c R5 136.3 b 9.6 a 13,069.1 b 129.5 b 11.2 b 13,514.7 d 145.0 b 9.8 a 13,228.2 b R7 143.2 a 9.2 b 13,978.3 a 152.7 a 11.9 a 16,195.1 a 162.8 a 9.5 a 15,252.7 a LS D (0.05) 1.7 0.3 262.8 2.3 0.4 330.6 3.5 0.4 296.1 1M ea ns f ol lo w ed b y t he s am e let ter n ot sig nific an tly diff er en t a t 0.05 le ve l b y LS D t es t; n s: n ot sig nific an t.
cultivar interaction testing, the highest DM yield (15,802
kg ha–1) was produced by Derry at 25-cm row spacing
at Samsun with the 3 locations averaging an impressive
15,437 kg ha–1 for Derry. However, the 3-location average
for Derry in 75-cm rows was only 9831 kg ha–1. Over 2
years at the 3 locations, the all-cultivar interaction averages
in 25-, 50-, and 75-cm rows were 14,094, 10,813, and 9135
kg ha–1 DM, respectively.
Significant row spacing × harvest stage interactions were found in all locations (Table 4). This interaction indicated that harvest stages affected DM yield differently according to row spacings in each location. Row spacings
Table 3. Row spacing × cultivar interactions of DM yield (kg ha–1) in soybean at 3 locations (2-year average).
Row spacing (cm)
Cultivar
A-3127 Yemsoy Derry
Antalya 25 12,002.3 c1 14,150.0 b 15,316.5 a 50 9842.1 e,f 11,403.4 d 12,318.2 c 75 8246.0 g 9421.8 f 9953.7 e Bursa 25 12,657.1 13,802.2 15,192.3 50 10,067.0 11,168.1 12,682.1 75 8610.5 9539.5 10,611.8 Samsun 25 13,339.0 c 14,588.0 b 15,801.5 a 50 9627.4 e 9931.3 d,e 10,273.2 d 75 8473.1 g 8434.1 g 8928.4 f
1Means followed by the same letter in each location not significantly different at 0.05 level by LSD test.
Table 4. Row spacing × harvest stage interactions of dry matter yield (kg ha–1) in soybean at 3 locations (2-year average).
Row spacing (cm) Harvest stage R1 R3 R5 R7 Antalya 25 8821.3 g1 13,226.1 d 15,968.0 b 17,274.0 a 50 7341.0 h 10,537.3 e,f 12,985.2 d 13,887.7 c 75 7273.8 h 8529.4 g 10,253.7 f 10,773.1 e Bursa 25 8869.3 i 11,284.2 f 17,038.5 b 18,344.2 a 50 6569.0 k 9622.9 h 13,204.1 e 15,828.7 c 75 5533.5 l 8099.3 j 10,301.6 g 14,412.5 d Samsun 25 7499.0 i 11,468.5 d 18,252.1 b 21,085.2 a 50 5277.3 j 9389.4 g 11,336.3 d,e 13,773.0 c 75 4761.4 j 8690.6 h 10,097.8 f 10,899.5 e
greatly affected DM yield at the R5 and particularly the R7 stage, but this effect was minimal at the R1 stage. The
highest 3-location DM yield average (18,901 kg ha–1) was
obtained at a row spacing of 25 cm at the R7 stage while
the lowest combined average (5856 kg ha–1) was at the row
spacing of 75 cm at the R1 stage. Grouping all 4 harvest stages at the 3 locations at row spacings of 25, 50, and 75
cm the results were 13,261, 10,813, and 8739 kg ha–1 DM,
respectively.
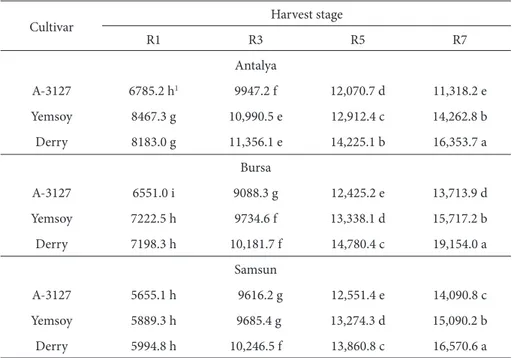
Cultivar × harvest stage interactions were also detected for DM yield in all locations (Table 5). DM yield differences between cultivars were not similar at all harvesting stages. At the first sampling stages (R1 and R3), DM yields of the cultivars were similar, and no significant yield difference was observed between Derry and Yemsoy. At the later stages, particularly at R5 and R7, forage cultivar Derry was significantly superior to the other cultivars. In this study, the highest 3-location average DM yields were from Derry
at R7, yielding 17,359 kg ha–1 compared to 15,023 kg ha–1
for intermediate-type cultivar Yemsoy and 13,041 kg ha–1
for A-3127, a typical grain cultivar.
Harvest maturity had a significant effect on DM partitioning of plant parts (Table 6). The average stem part of total plant mass increased from R1 to R3, from 32.1% to 39.8% at Antalya, 36.4% to 43.2% at Bursa, and 30.9% to 36.7% at Samsun, and then decreased significantly in the
R5 and R7 stages. On the other hand, the average leaf blade fractions decreased continually as plants were harvested at later growth stages (from R1 to R7) with the average leaf blade declining from 47.6% to 17.1%. Meanwhile, the flower-plus-pod fraction increased from R1 to R7, as expected. The average flower-plus-pod percentage was negligible at the R1 (2.3%), R3 (4.6%), and R5 (11.4%) stages, then rapidly increased at R7 (37.7%).
The CGR decreased significantly from 25-cm row spacing to 75-cm row spacing in all locations, except in the R5–R7 period in Antalya and the R1–R3 period in Samsun. The highest CGRs were found in the R1–R3 and R3–R5 periods, and CGR was clearly reduced in the
R5–R7 period in all locations (Table 7).The CGRs of the
cultivars varied significantly according to harvest period, row spacing, and location. With the exception of the R1– R3 periods, Derry had a significantly higher CGR than the other cultivars in the Antalya and Bursa locations. In the Samsun location, the CGRs of the cultivars were not significantly different at the VE–R1, R1–R3, and R3– R5 periods. In the last period (R5–R7), Derry advanced with a significantly higher CGR than the other cultivars in all locations. Grain-type soybean cultivar A-3127 had a negative CGR in the R5–R7 period in Antalya due to leaf dropping at the beginning of maturity due to the hot climate of Antalya.
Table 5. Cultivar × harvest stage interactions of DM yield (kg ha–1) in soybean at 3 locations
(2-year average).
Cultivar Harvest stage
R1 R3 R5 R7 Antalya A-3127 6785.2 h1 9947.2 f 12,070.7 d 11,318.2 e Yemsoy 8467.3 g 10,990.5 e 12,912.4 c 14,262.8 b Derry 8183.0 g 11,356.1 e 14,225.1 b 16,353.7 a Bursa A-3127 6551.0 i 9088.3 g 12,425.2 e 13,713.9 d Yemsoy 7222.5 h 9734.6 f 13,338.1 d 15,717.2 b Derry 7198.3 h 10,181.7 f 14,780.4 c 19,154.0 a Samsun A-3127 5655.1 h 9616.2 g 12,551.4 e 14,090.8 c Yemsoy 5889.3 h 9685.4 g 13,274.3 d 15,090.2 b Derry 5994.8 h 10,246.5 f 13,860.8 c 16,570.6 a
1Means followed by the same letter in each location not significantly different at 0.05 level by
Ta bl e 6. C on sti tuen t p la nt co m po nen ts (%) o f D M in s oy be an f ora ge (R1–R7) a t 3 lo ca tio ns (2-y ea r a vera ge). Loc at io ns A nt al ya Bu rs a Sa m sun M ain s tem Pet io le Le af b lade Flo w er/p od M ain s tem Pet io le Le af b lade Flo w er/p od M ain s tem Pet io le Le af b lade Flo w er/p od Ro w s pacin g (cm) 25 34.8 a 1 18.2 30.0 17.0 39.1 a 16.6 33.4 10.8 32.7 a 18.3 35.4 13.6 50 34.7 a 17.7 30.2 17.4 39.2 a 16.2 33.7 10.9 32.9 a 17.8 35.4 13.8 75 33.9 b 18.2 30.4 17.5 38.4 b 16.5 33.9 11.1 32.1 b 18.3 35.7 13.9 LS D 0.5 ns ns ns 0.3 ns ns ns 0.5 ns ns ns Cul tiv ar A-3127 33.6 b 18.1 29.3 c 19.0 a 38.2 b 16.3 33.4 12.1 a 31.7 b 17.9 34.7 c 15.7 a Ye m so y 34.2 b 18.5 30.1 b 17.2 b 38.7 b 16.7 33.6 11.0 b 32.3 b 18.4 35.4 b 13.8 b De rr y 35.6 a 18.2 30.9 a 15.3 c 39.8 a 16.4 34.1 9.7 c 33.7 a 18.0 36.5 a 11.8 c LS D 0.9 ns 0.5 0.8 0.8 ns ns 0.4 0.8 ns 0.6 0.8 H ar ve st st ag e R1 32.1 c 17.6 b 44.9 a 5.4 d 36.4 c 15.8 b 47.1 a 0.7 d 30.9 c 17.4 b 50.8 a 0.8 d R3 39.8 a 20.2 a 32.5 b 7.5 c 43.2 a 18.7 a 35.2 b 2.9 c 36.7 a 20.6 a 39.2 b 3.4 c R5 34.8 b 21.6 a 28.9 c 14.7 b 39.5 b 19.1 a 32.7 c 8.7 b 33.1 b 21.1 a 34.7 c 10.9 b R7 31.1 d 12.7 c 14.4 d 41.8 a 36.5 c 12.2 c 19.8 d 31.5 a 29.5 d 13.4 c 17.2 d 39.8 a LS D 1.0 0.9 0.8 0.8 1.0 0.7 1.0 0.5 1.0 0.8 1.0 0.9 1M ea ns f ol lo w ed b y t he s am e let ter n ot sig nific an tly diff er en t a t 0.05 le ve l b y LS D t es t; n s: n ot sig nific an t. Ta bl e 7. Cr op g ro wt h ra tes (C GR) (g m –2 d ay –1) o f s oy be an acco rdin g t o g ro wt h s ta ges a t 3 lo ca tio ns (2-y ea r a vera ge). Loc at io ns A nt al ya Bu rs a Sa m sun VE–R1 R1–R3 R3–R5 R5–R7 VE–R1 R1–R3 R3–R5 R5–R7 VE–R1 R1–R3 R3–R5 R5–R7 Ro w s pacin g (cm) 25 12.3 a 1 21.1 a 17.0 a 3.4 10.3 a 15.3 a 34.0 a 13.5 a 12.6 a 25.8 28.8 a 8.6 a 50 9.7 b 15.3 b 15.1 a,b 2.5 6.9 b 12.8 a,b 21.6 b 8.7 b 8.8 b 26.5 8.7 b 7.0 a 75 10.1 b 6.0 c 10.2 b 1.5 5.9 c 12.1 b 13.8 c 4.3 c 7.8 b 25.4 6.1 b 2.3 b LS D 0.6 5.3 5.2 ns 0.5 2.7 4.0 2.3 1.0 ns 3.8 2.9 Cul tiv ar s A-3127 9.1 b 12.3 11.7 b –1.9 c 7.2 b 12.7 19.9 b 4.3 c 9.3 25.8 13.1 4.2 b Ye m so y 11.6 a 15.1 13.1 b 3.6 b 8.1 a 12.6 21.9 b 7.7 b 9.9 24.5 15.2 5.5 b De rr y 11.3 a 15.1 17.5 a 5.8 a 8.0 a 14.9 27.6 a 14.6 a 10.0 27.5 15.2 8.2 a LS D 0.7 ns 3.7 1.3 0.5 ns 3.3 3.1 ns ns ns 1.8 1M ea ns f ol lo w ed b y t he s am e let ter n ot sig nific an tly diff er en t a t 0.05 le ve l b y LS D t es t; n s: n ot sig nific an t.
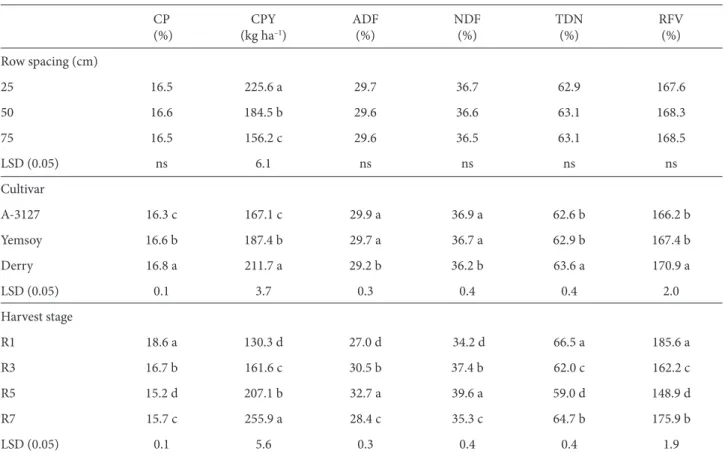
Overall CP, ADF, NDF, TDN, and RFV concentrations of soybean forage were not affected by row spacing. The highest CPY was obtained from 25-cm row spacing due to the higher DM yield (Table 8). For support, reference Tables 3, 4, and 5. Although differences among the cultivars were small, Derry had the highest CP, CPY, TDN, and RFV values. Quality characteristics of soybean forage were significantly affected by harvesting stage. The CP content decreased significantly with advancing maturity between the R1 and R5 growing stages. At the R7 growing stage, CP increased slightly because of the seed components of the plants. The R5 growing stage had the highest ADF and NDF values. However, the highest TDN and RFV values were obtained at the R1 growing stage.
4. Discussion
Selecting the appropriate seeding rate for a soybean production system can affect optimal yield potential and economic net returns, as well as some negative factors including the potential for lodging. Choosing the optimal seeding rate for a given production system should be based on several factors. Desired plant population, soil
type, planting date, and maturity group influence the recommended seeding rate. Other factors that affect optimal seeding rates include roughness of soil, type of planter or drill, percent germination of seed, and, in some cases, seed vigor. In this study, 25-cm row spacing produced a higher final plant stand than 50- and 75-cm row spacing. In close agreement with our findings, De Bruin and Pedersen (2008) indicated that establishment was greater in narrow rows (38 cm) compared with wide rows (76 cm). Similarly, greater establishment in narrow rows was observed by other researchers (Oplinger and Philbrook 1992; Elmore 1998).
The effects of row spacing on plant height were limited; however, plant height increased slightly with row spacing in the Bursa and Samsun locations, and the differences between row spacings were statistically significant. Seiter et al. (2004) indicated that forage soybean plants were shorter in 18-cm rows compared with 76-cm rows at most sampling dates. Saitoh et al. (2007) also documented that narrow row plots were 7–16 cm shorter than wide row plots. A linear decrease with increasing row width was observed for plant height (Bullock et al. 1998). Plant
Table 8. Crude protein (CP), crude protein yield (CPY), acid detergent fiber (ADF), neutral detergent fiber (NDF), total digestible
nutrients (TDN), and relative feed value (RFV) of soybean forage for Bursa location. CP (%) (kg haCPY–1) ADF(%) NDF(%) TDN(%) RFV(%) Row spacing (cm) 25 16.5 225.6 a 29.7 36.7 62.9 167.6 50 16.6 184.5 b 29.6 36.6 63.1 168.3 75 16.5 156.2 c 29.6 36.5 63.1 168.5 LSD (0.05) ns 6.1 ns ns ns ns Cultivar A-3127 16.3 c 167.1 c 29.9 a 36.9 a 62.6 b 166.2 b Yemsoy 16.6 b 187.4 b 29.7 a 36.7 a 62.9 b 167.4 b Derry 16.8 a 211.7 a 29.2 b 36.2 b 63.6 a 170.9 a LSD (0.05) 0.1 3.7 0.3 0.4 0.4 2.0 Harvest stage R1 18.6 a 130.3 d 27.0 d 34.2 d 66.5 a 185.6 a R3 16.7 b 161.6 c 30.5 b 37.4 b 62.0 c 162.2 c R5 15.2 d 207.1 b 32.7 a 39.6 a 59.0 d 148.9 d R7 15.7 c 255.9 a 28.4 c 35.3 c 64.7 b 175.9 b LSD (0.05) 0.1 5.6 0.3 0.4 0.4 1.9
heights in the forage cultivar Derry were greater than plant heights in the intermediate-type soybean cultivar Yemsoy and typical grain-type soybean cultivar A-3127 in all locations. Darmosarkoro et al. (2001) also stated that plant heights in the forage cultivars were greater than in the grain cultivars. Plant height increased with advancing stages.
In our study, 25-cm row spacing produced 35% more DM yield than 75-cm row spacing. The literature concluded that narrow rows resulted in higher forage yield. Hintz et al. (1992) reported that narrow row spacing produced greater DM yields than wide row spacing. Seiter et al. (2004) also documented that, averaged over population treatments, DM yields at 18-cm row spacing were 32% and 49% higher than at 76-cm row spacing in 2000 and 2001, respectively. In several studies with grain soybean, an increase in aerial biomass, light interception, and assimilate utilization were all factors that contributed to seed yield increases in narrow rows compared with wide rows. Results indicated that narrow rows had greater radiation use efficiencies than wide rows (Board and Harville 1992; Savoy et al. 1992; Bullock et al. 1998). Those characteristics were probably the main reasons for the higher DM yield at narrow row spacings. Forage-type cultivar Derry provided the highest DM yield in all locations. The general averages of DM yield in Derry, Yemsoy, and A-3127 were 12,341, 11,382, and
10,319 kg ha–1, respectively. Darmosarkoro et al. (2001)
compared 13 forage and 5 grain soybean cultivars for forage and agronomic performance in Iowa. They reported that forage cultivars produced more DM than grain cultivars. The DM yield significantly increased at advanced harvest stages at all locations. It is well known that harvest maturity has the greatest effect on soybean forage yield. Harvesting soybean forage during vegetative and early reproductive development resulted in significantly lower DM yields than harvesting at later reproductive stages. The general average of our soybean cultivars and locations from R1 to R7 coincided with a 54% DM yield increase
from 6883 to 15,142 kg ha–1. As plants begin to concentrate
DM in pods and seeds, an enhanced forage yield with
advancing maturity is consistent with the resultsof several
studies (Munoz et al. 1983; Hintz et al. 1992; Coffey et al. 1995; Osborne and Riedell 2006).
The effects of row spacing and cultivar on the constituent components of DM were of small magnitude in all locations, and the differences were mostly not significant. Similarly, Savoy et al. (1992) indicated that leaflet, stem, and petiole DM accumulation was similar in different row spacings of Williams 82 soybean. Little information is presently available on the effect of harvesting stages on DM partitioning in soybean (Table 6). However, our results were consistent with earlier researchers who
reported that as soybeans matured, theleaf proportion
rapidly declined, stem and petiole proportions were stable or declined slowly, and pod proportion rapidly increased. For example, Hintz and Albrecht (1994) reported that the leaf percentage of grain-type soybean decreased from 70.8% at R1 to 16.8% at R7. Meanwhile, the stem fraction
increased from 29.2% at R1 to 38.3% at R5and then
declined to 28.3% at R7 as the pod and seed components increased up to 48.5%. In grain soybeans, an average of 40% pod was found at the R6 stage (Sheaffer et al. 2001; Altinok et al. 2004). However, Sheaffer et al. (2001) found a very high leaf percentage (40%) at the R7 stage in forage soybean. This leaf percentage was much higher than the results from the current study.
The CGRs of the 3 soybean cultivars ranged from –1.9
to 27.6 g m–2 day–1, with an average across 3 locations of
12.6 g m–2 day–1. The CGRs observed in this study were
similar to CGRs observed in other studies. Pedersen and Lauer (2004) reported CGRs for 3 cultivars that ranged
from 11.4 to 13.0 g m–2 day–1. De Bruin and Pedersen
(2009) reported CGRs of 4 soybean cultivars that ranged
from 9.7 to 18.0 g m–2 day–1, with an average across 3
locations of 13.2 g m–2 day–1. Furthermore, the average
of CGR was 13.6 g m–2 day–1 from R1 until R5 in Pioneer
94Y60 soybean harvested weekly (Jordan 2010).
Our CP values are in accordance with the findings of Altinok et al. (2004), who found 15.2% in 6 soybean cultivars at the R6 stage, and other findings of 15.5% CP
betweenR3 and R5 (Seiter et al. 2004). Hintz et al. (1992)
also reported that CP contents declinedfrom R1 to R3,
remained constant between R3and R5, and increased
from R5 to R7. Nutrient content and forage quality of whole-plant soybeans does not change as drastically with advancing maturity because the seed is much higher in protein (Munoz et al. 1983). The ADF concentration values, consisting of cellulose and lignin, are important because they describe the ability of an animal to digest the forage. As the ADF increases, the digestibility of the forage usually decreases. The NDF value refers to the total cell wall and is composed of the ADF fraction plus hemicelluloses. As NDF percentages increase, the DM intake will generally decrease (Joachim and Jung 1997). In this study, row spacing and cultivar did not significantly affect ADF and NDF values (Table 8). On the other hand, harvesting stage affected ADF and NDF values, which varied from 27% (R1) to 32.7% (R5) and 34.2% (R1) to 39.6% (R5), respectively.
The TDN refers to the nutrients that are available for livestock. This variable is related to the ADF concentration of the forage. As ADF increases, TDN declines. The RFV is an index that is used to predict the intake and energy value of forages. Forages with RFV values over 151, in ranges of 150–125, 124–103, 102–87, and 86–75, and less than 75
are categorized as prime, premium, good, fair, poor, and rejected, respectively (Linn and Martin 1999; Aydin et al. 2010). In this study, with the average of row spacings and cultivars, the RFV ranged from 167.6 to 170.9 and corresponded to prime quality. The RFV of soybean forage decreased from 185.6 at the R1 stage to 148.9 at the R5 stage and then increased again to 175.9 at the R7 stage (Table 8). This shows that soybean cut during the R1 to R7 stages produced high quality forage for livestock.
Soybeans can be harvested for grain or grazed, used as cover crop or green manure, cut for hay or silage, left standing for wildlife feed and erosion control, or used as a soil-building nitrogen-producing crop. Comparing 3 types of soybeans, forage (Derry), intermediate (Yemsoy), and a group III grain (A-1327), this study found statistically significant differences in many areas including cultivar, yearly climate, location, row spacing, plant height, plant stand, stem diameter harvesting stage, feed quality characteristics, DM partitioning of plant components, DM yield and row spacing interaction, and row spacing × harvest stage interaction.
This study also contributed to the body of information regarding 3 soybean types during a 2-year study at 3 Mediterranean locations in Turkey in terms of row spacing, plant stand, plant height, stem diameter, DM yield, main stem, petiole, leaf blade, flower-plus-pod ratios, crop growth rates, and harvest stage. CP, CPY, ADF, NDF, TDN,
and RFV were also tested at the Bursa location, where soybean forage quality characteristics were significantly affected by harvest stage, as CP decreased significantly with advancing maturity.
Narrow rows had greater stand establishment, and as mature leaf proportion rapidly declined, stem and petiole were stable or declined slowly and pod proportion rapidly increased, which agrees with previous research. We also found a much lower leaf percentage at R7 compared with some previous studies. Harvest stage affected ADF and NDF. All 3 cultivars produced high-quality forage as measured by relative feed value. Forage variety Derry produced significantly higher DM than other soybean types, especially in narrow rows. However, harvest stages affected the DM yield of each cultivar differently at different row spacings at each location, although the DM yields of all cultivars were similar at V4. Interestingly, feed quality characteristics (CP, ADF, NDF, TDN, and RFV) were not affected by row spacing. Crop growth rate varied by cultivar, harvest period, row spacing, and location but was highest in narrow rows, and it decreased moving through the reproductive stages.
Based on this and previous research, we recommend planting narrow rows (25 cm) at high plant population for the highest DM yield, planting a forage variety (i.e. Derry), and harvesting at later R stages (e.g., R7) rather than at a late vegetative stage.
References
Abdul-Baki A, Morse RD, Devine TE, Teasdale JR (1997) Broccoli production in forage soybean and foxtail millet cover crop mulches. Hortic Sci 32: 836–839.
Acikgoz E, Sincik M, Oz M, Albayrak S, Wietgrefe G, Turan ZM, Goksoy AT, Bilgili U, Karasu A, Tongel O, Canbolat O (2007) Forage soybean performance in Mediterranean environments. Field Crop Res 103: 239–247.
Altinok S, Erdoğdu I, Rajcan I (2004) Morphology, forage and seed yield of soybean cultivars of different maturity grown as a forage crop in Turkey. Can J Plant Sci 84: 181–186.
Aydin N, Mut Z, Mut H, Ayan I (2010) Effect of autumn and spring sowing dates on hay yield and quality of oat (Avena sativa L.) genotypes. J Anim Vet Adv 9: 1539–1545.
Blount AR, Wright DL, Sprenkel RK, Hewitt TD, Hiebsch CK, Myer RO (2003) Forage Soybeans for Grazing, Hay and Silage. University of Florida IFAS Extension, AG184.
Board JE, Harville BG (1992) Explanations for greater light interception in narrow-row vs wide-row soybean. Crop Sci 32: 198–202.
Bullock D, Khan S, Rayburn A (1998) Soybean yield response to narrow rows is largely due to enhanced early growth. Crop Sci 38: 1011–1016.
Coffey KP, Granade GV, Moyer JL (1995) Nutrient content of silages made from whole-plant soybeans. Prof Anim Sci 11: 74–80. CSIRO (2004) Soybean Research for a Growing Industry: Soybean in
Australia. Commonwealth Scientific and Industrial Research Organisation, CSIRO Plant Industry, Victoria, Australia. Darmosarkoro W, Harbur MM, Buxton DR, Moore KJ, Devine
TE, Anderson IC (2001) Growth, development, and yield of soybean lines developed for forage. Agron J 93: 1028–1034. De Bruin JL, Pedersen P (2008) Effect of row spacing and seeding
rate on soybean yield. Agron J 100: 704–710.
De Bruin JL, Pedersen P (2009) Growth, yield, and yield component changes among old and new soybean cultivars. Agron J 101: 124–130.
Devine TE, Hatley EO (1998) Registration of ‘Donegal’ forage soybean. Crop Sci 38: 1719–1720.
Elmore RW (1998) Soybean cultivar responses to row spacing and seeding rates in rainfed and irrigated environments. J Prod Agric 11: 326–331.
Hintz RW, Albrecht KA (1994) Dry matter partitioning and forage nutritive value of soybean plant components. Agron J 86: 59– 62.
Hintz RW, Albrecht KA, Oplinger ES (1992) Yield and quality of soybean forage as affected by cultivar and management practices. Agron J 84: 795–798.
Joachim H, Jung G (1997) Analysis of forage fiber and cell walls in ruminant nutrition. J Nutr 127: 810–813.
Jordan DL (2010) Impact of High-Input Production Practices on Soybean Yield. MSc Thesis. University of Kentucky, College of Agriculture. Available at http://uknowledge.uky.edu/ gradschool_theses/36.
Koivisto JM, Devine TE, Lane GPF, Sawyer CA, Brown HJ (2003) Forage soybeans [Glycine max (L.) Merr.] in the United Kingdom: test of new cultivars. Agronomie 23: 287–291. Linn JG, Martin NP (1999) Forage quality tests and interpretations.
University of Minnesota Ext. Ser. Publ. FO-02637, University of Minnesota, St Paul, MN, USA.
McPeake R, Robwerg R, Self C, Long D (2010) Establishing wildlife food plots, University of Arkansas, Ext. Ser. Publ. FSA9092-PD-12-10RV, University of Arkansas Division of Agriculture, Little Rock, AR, USA.
Munoz AE, Holt EC, Weaver RW (1983) Yield and quality of soybean hay as influenced by stage of growth and plant density. Agron J 75: 147–148.
Nayigihugu V, Kellogg W, Longer D, Johnson Z, Anschutz K (2000) Performance and ensiling characteristics of tall growing soybean lines used for forage. Anim. Sci. Dep. Rep. 470. Arkansas Agric. Exp. Stn., University of Arkansas, Fayetteville, pp. 142–147.
Oplinger ES, Philbrook BD (1992) Soybean planting date, row width, and seeding rate response in three tillage systems. J Prod Agric 5: 94–99.
Osborne SL, Riedell WE (2006) Soybean growth response to low rates of nitrogen applied at plantings in the Northern Great Plains. J Plant Nutr 29: 985–1002.
Pederson P (2004) Soybean growth and development. Iowa State University Ext. Publ. PM-1945. Iowa State University, Ames, IA, USA.
Pedersen P, Lauer JG (2004) Soybean growth and development in various management systems and planting dates. Crop Sci 44: 508–515.
Rohweder DA, Barnes RF, Jorgensen N (1978) Proposed hay grading standards based on laboratory analyses for evaluating quality. J Anim Sci 47: 747–759.
Saitoh K, Hirata K, Kashiwagi Y (2007) Effect of row-spacing and planting density on podding and yield performance of early soybean cultivar ‘Enrei’ with reference to raceme order. Jpn J Crop Sci 76: 204–211.
Savoy BR, Cothren JT, Shumway CR (1992) Soybean biomass accumulation and leaf area index in early-season production environments. Agron J 84: 956–959.
Seiter S, Altemose CE, Davis MH (2004) Forage soybean yield and quality responses to plant density and row distance. Agron J 96: 966–970.
Sheaffer CC, Orf JH, Devine TE, Jewett JG (2001) Yield and quality of forage soybean. Agron J 93: 99–106.