Determination of grindability characteristics of zeolite
Article in Physicochemical Problems of Mineral Processing · January 2011
CITATIONS 14 READS 285 2 authors: H. Ipek
Eskisehir Osmangazi University
21PUBLICATIONS 158CITATIONS SEE PROFILE Ferihan Göktepe Balikesir University 22PUBLICATIONS 78CITATIONS SEE PROFILE
All content following this page was uploaded by Ferihan Göktepe on 22 December 2014.
Physicochem. Probl. Miner. Process. 47(2011) 183-192 Physicochemical Problems of Mineral Processing
w w w . m i n p r o c . p w r . w r o c . p l / j o u r n a l / ISSN 1643-1049 Received March 15, 2011; reviewed; accepted May 21, 2011
Determination of grindability characteristics of zeolite
Halil IPEK *, Ferihan GOKTEPE **
* Department of Mining Engineering, Osmangazi University, 26480, Eskisehir, Turkey, [email protected] ** Balikesir Technical College, Balikesir University, Balıkesir,Turkey, [email protected]
Abstract. In this study grindability of zeolite was studied. The work index of zeolite was determined for three different test sieves. In terms of work indexes, there was insignificant difference between the test sieves. Additionally, the breakage rate and distribution parameters were also determined. The fastest breakage rate was obtained for -1700+1180 μm feed sizes and found breakage distributions functions were non-normalisable.
keywords: Bond work index, zeolite, breakage rate function, breakage distribution function, ball milling
1. Introduction
Zeolites are crystalline aluminosilicates of the alkaline and alkaline earth minerals. Zeolites are widely used in mineral industries such as animal nutrition, detergent, pozzolanic cement and agricultural products (Englert and Rubio, 2005). They posses many desirable properties (ion exchange, molecular sieving, catalytic etc.) which make them valuable mineral commodities (Clifton, 1987). In recent years, natural zeolites, especially clinoptilotile (CLN), are gaining growing interest in environmental application such as ammonium and heavy metal removal from wastewater. They are readily available from several producers, less expensive then synthetic counter parts and have advantages of high selectivity towards the ammonium ions removal from wastewater.
Grinding is an important industrial operation that is used for size reduction of materials, production of large surface area and liberation of valuable minerals from their matrices. As it is known, a significant amount of energy, which is used in grinding, turns into heat energy and cannot be used in grinding effectively. However, it is possible to obtain a more effective grinding by setting up more effective grinding systems which consume less energy (Ipek et.al, 2004). Increased rates and efficiencies of milling have been sought through the optimization of milling by providing favorable physical and operational conditions for the mills used (Ozkan et.al, 2009).
Therefore, the design and scale-up of ball mills are important issues in size reduction processes.
The objective of this study is to determine the grindability characteristics of zeolite and to investigate the effect of feed particle size upon grinding.
2. Theoretical background
The Bond ball mill grindability test gives the Bond ball mill work index. This index expresses the resistance of a material to ball milling since the higher the value of the Bond ball mill work index, the more difficult it is to grind the material using a ball mill. This index is widely used in the mineral industry for comparing the resistance of difference material to ball milling, estimating the energy required for ball milling and scaling-up ball mill (Man, 2002). Test results were converted to a work index (in kWh/Mg)by the following empirical equation:
[
]
,kWh/Mg 10 10 95 . 48 5 . 0 80 5 . 0 80 82 . 0 23 . 0 F P G P W t i− − (1)where: Pt is selected test size (μm); G is net mass (grams) of undersize product per
unit revolution of the mill, in g/rev; P80 is the 80% passing product particle size (μm);
F80 the 80% passing feed particle size (μm).
The value of Wi obtained by above equation is representative of the required
energy to tumble the charge of a 30.5 cm interior diameter overflow ball mill dry grinding in a closed circuit. Estimation of Wi is realized only after attainment of
steady-state conditions for a locked-cycle batch grinding test. A grinding cycle consists of the following two parts:
- dry grinding of 700 cm3 bulk volume of material prepared to -3350 micrometers
in a 30.5 by 30.5 cm ball mill rotating at 70 rpm and charged with 22,648 grams of grinding balls. Balls plus ore charge is ground for desired revolutions which is usually 50 or 100 revolutions,
- removal by sieving the portion of the product which was ground finer than a pre-selected test size, Pt. In preparation for the next cycle, the undersize portion
is replaced by an equivalent amount of fresh feed in order to maintain constant charge.
The duration of grinding is establish as the time required to produce, for the next cycle, a simulated 250% re-circulating load of particles coarser than the selected test size. An estimate of the grinding time is obtained using the grindability, G, of the previous cycle. G is defined as the grams of particles finer than test size produced per mill revolution. An initial value of G is obtained by waiving the 250% re-circulating load requirement for the first cycle and replacing it with a grind period of 100 mill revolutions. When G reverses its direction and remains constant from cycle to cycle, steady-state grinding conditions are said to prevail. The average value of G for the final three cycles is taken as G, the steady, state grindability (McIntyre and Plitt, 1980, Deister, 1987).
Determination of grindability characteristics of zeolite 185
Selection of the test size, Pt, is usually based on the fineness of grind desired in
the milling operation. Typical choices for Pt are 106, 75 and 53 micrometers. Care
must be taken to minimize the possibility of sieve blinding. Blinding will cause underestimation of G, with direct consequences on the calculate value of Wi. (Bond,
1961)
In the analysis of the breakage materials, it is useful to make the initial assumption that the breakage of each size fraction is first order in nature. The rate of disappearance of size 1 due to breakage is proportional to the amount of size 1 material in the mill holdup (Yan and Eaton, 1994):
( )
[
]
( )
W t w dt W t w d 1 1 ∝ −(2)
Since the mill hold up, W, is constant, this becomes:
( )
t dt S w( )
tdwi =− 1 1 (3)
where S1 is a proportionality constant and it is called the specific rate of breakage,
with units of time-1. If S
1 does not vary with time (Austin at.al, 1984)
( ) ( ) (
t w St)
w1 = 10exp− 1 (4) that is, 3 . 2 / )] 0 ( log[ )] ( log[w1 t = w1 −S1t (5)where w1(t) is the weight fraction of mill hold up that is of size 1 at time t (Austin and
Bagga, 1981). The formula proposed by Austin et al. (1984) for the variation of the specific rate of breakage Si with particle size is
i i T i x Q x a S α ⎟ ⎠ ⎞ ⎜ ⎝ ⎛ = 0 (6)
where xi is the upper limits of the size interval indexed by i, x0 is 1 mm, aT and α are
model parameters that depend on the properties of the material and the grinding conditions. Qi is a correction factor which is 1 for smaller sizes (normal breakage) and
less than 1 (abnormal breakage) for particles too large to be nipped and fractured properly by the ball size in the mill. In abnormal breakage region, each size behaves as if it has some fraction of weak material and the remaining fraction of stronger material. Using a mean value for Si in this region, values of Qi are empirically
described by
(
)
, 0 1 1 Λ≥ + = Λ μ i i x Q (7)where μ is the particle size at which correction factor is 0.5 and Λ a positive number which an index of how rapidly the rates of breakage fall as size increases that is the higher the value of Λ, the more rapidly the values decrease.
The Cumulative Breakage Distribution, Bi,j, is defined as “the weight fraction of
material broken from size j which falls less than the upper size of size interval i” is commonly used to characterize the size distribution resulting from breakage of
material from a particular size interval to a smaller size (Austin at.al, 1984,Austin and Luckie, 1971/72).
The values of the primary breakage distribution function are deduced from the size distributions at short grinding times where there is mainly size 1 material breaking and only a small amount of smaller sizes to rebreak (Austin at.al, 1984). B values can be calculated by using BII method which is described following formula:
( )
(
)
[
]
[
(
( )
)
]
( )
(
)
[
P]
[
(
P( )
t)
]
t P P B j j i i j i 1 1, loglog11 00 loglog 11 + + − − − − = , (8)
where j is the top size of the charge, Pi(t) is the cumulative percent undersize of size
interval iat the short grinding time which gives no more than about 30% broken out of the top size interval. Cumulative primary breakage distribution function Bi,j is also
defined in an empirical form by
(
)
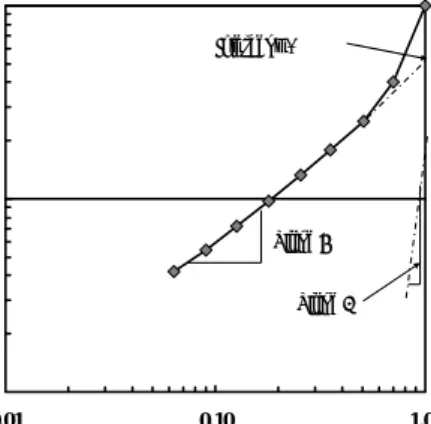
β γ φ φ ⎟⎟ ⎠ ⎞ ⎜ ⎜ ⎝ ⎛ − + ⎟ ⎟ ⎠ ⎞ ⎜ ⎜ ⎝ ⎛ = − − j i j j i j j i x x x x B, 1 1 1 , (9)where xi is the top size and Bi,j is the weight fraction of primary breakage products.
The parameters Φ, γ and β define the size distribution of the material being ground.
On plotting size versus Bi,j on the log scale, the slope of the lower portion of the curve
gives the value of γ while the slope of the upper portion of the curve gives the value of β, and Φ is the intercept as shown in Fig. 1.
0.01 0.10 1.00 0.01 0.10 1.00 Relative Size xi/x1 C u m . B reakage P a ram et er , B i, 1 Slope γ Intercept Φ Slope β
Fig. 1. Obtaining primary breakage distribution function parameters for any single size fraction feed ground in the mill
The primary characteristic of the Bij curves is the final slope of each plot γ. The
smaller the curve of γ, the higher the relative amounts of progeny fines that are produced from breakage. Conversely, materials having a large γ value give less
relative amounts of fines and can therefore be expected to produce steeper size distributions when ground in a given machine. The β, and Φ values show how rapidly
Determination of grindability characteristics of zeolite 187
fractions close to feed size are reduced to a lower size. The Bi,j values are said to be
normalisable if the fraction which appears at sizes less than the starting size is indepented of the starting size. In terms of plots, the curves should be super-imposed on each other if the Bi,j values are normalisable. If the values of breakage distribution
are dependent on starting feed size, that is, if they are normalisable, the Bi,j values are
represented by the following equation (Austin at.al, 1984, Austin and Bagga, 1981, Austin and Luckie, 1971/72):
(
1)
, 0 1 1 1 1 1 , , ⎟⎟ ≤Φ ≤ ⎠ ⎞ ⎜⎜ ⎝ ⎛ Φ − + ⎟⎟ ⎠ ⎞ ⎜⎜ ⎝ ⎛ Φ = − j i j i j j i x x x x B β γ (10) δ − ⎥ ⎦ ⎤ ⎢ ⎣ ⎡ Φ = Φ 1 1 x xj j (11)for normalized B values δ=0.
3. Materials and experimental methods 3.1. Material
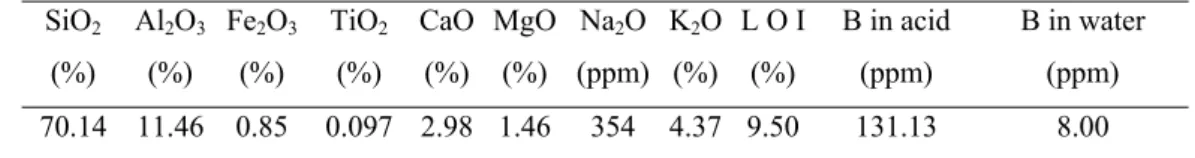
The zeolite sample was taken from Bigadic Boron Works, Balikesir/Turkey. The sample contains zeolite group minerals (heulandite-clinoptilolite) and amorphous materials (www.etimaden.gov.tr). The chemical analysis of sample is given in Table 1.
The sample was crushed to -3350 μm by a laboratory jaw crusher for Bond test. In order to determine the breakage parameters, crushed material of -3350 μm was classified in to seven mono size fractions which were 3350+2360, 2360+1700, 1700+1180,1180+850, 850+600, 600+425, 425+300 μm, where for example -3350+2360 μm denotes that 100 % of the particles are passing by weight at 3350 μm size and 100 % of particles are remaining at 2360 μm. The density of zeolite sample which was determined by a pycnometer and it was averaged 2.07 g/cm3 over thirteen measurements. Mohr’s hardness of sample was measured by hardness pens and it was found to be 3.5-4.
Table 1. Chemical composition of materials SiO2 (%) Al2O3 (%) Fe2O3 (%) TiO2 (%) CaO (%) MgO (%) Na2O (ppm) K2O (%) L O I (%) B in acid (ppm) B in water (ppm) 70.14 11.46 0.85 0.097 2.98 1.46 354 4.37 9.50 131.13 8.00 3.2. Experimental
The stainless steel Bond mill used in the experiments was 30.5 cm in diameter and 30.5 cm in length. The mill was loaded with 22,648 g of 38.1, 31.75, 25.40, 19.05 and 12.70 mm diameters of stainless steel balls which correspond to 22% of the struck
volume of the mill and mill was operated at 70 rpm which was 86% of its critical speed.
In Bond test experiment, the mill was loaded to 32.6% of the interstitial void volume of the ball charge and was filled with the -3350 microns of sample. Test was done in the three different test sieves.
In the kinetic tests, the mill was loaded to 100% of the interstitial void volume of the ball charge, U. The breakage parameters were determined experimentally using one size fraction technique (Austin and Bagga, 1981). Tests were carried out for 7 different mono size fractions which were mentioned above. In order to obtain the breakage parameters, the mono size fractions were ground dry for 0.5, 1.0, 2.0, 4.0, 8.0 minutes separately. At the end of the each run, the ground product was weighed and the loss was no more than 0.15% of the total charge. Due to grinding, sampling, sieving and regrinding the same sample for several times, some weight losses are expected. The loss in this study was less than 1 % which is acceptable.
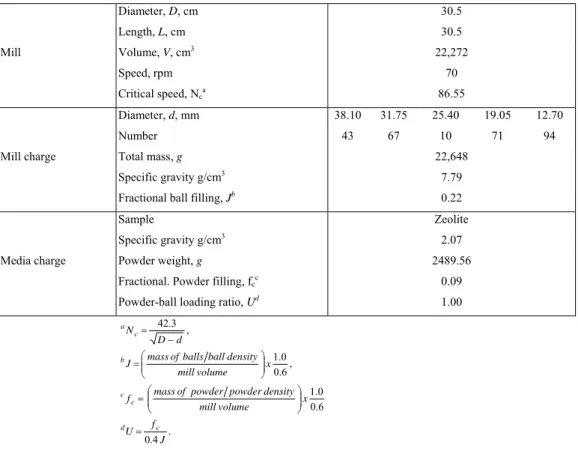
The characteristics of the Bond mill used in grinding tests and test conditions are outlined in Table 2.
Table 2. Bond mill characteristic and test conditions for grinding of zeolite
Diameter, D, cm 30.5 Length, L, cm 30.5 Mill Volume, V, cm3 22,272 Speed, rpm 70 Critical speed, Nca 86.55 Diameter, d, mm 38.10 31.75 25.40 19.05 12.70 Number 43 67 10 71 94
Mill charge Total mass, g 22,648
Specific gravity g/cm3 7.79
Fractional ball filling, Jb 0.22
Sample Zeolite
Specific gravity g/cm3 2.07
Media charge Powder weight, g 2489.56
Fractional. Powder filling, fcc 0.09
Powder-ball loading ratio, Ud 1.00
. 4 . 0 6 . 0 0 . 1 , 6 . 0 0 . 1 , 3 . 42 J f U x volume mill density powder powder of mass f x volume mill density ball balls of mass J d D N c d c c b c a = ⎟⎟ ⎠ ⎞ ⎜⎜ ⎝ ⎛ = ⎟⎟ ⎠ ⎞ ⎜⎜ ⎝ ⎛ = − =
Determination of grindability characteristics of zeolite 189
4. Results and Discussion 4.1. Bond Work Index
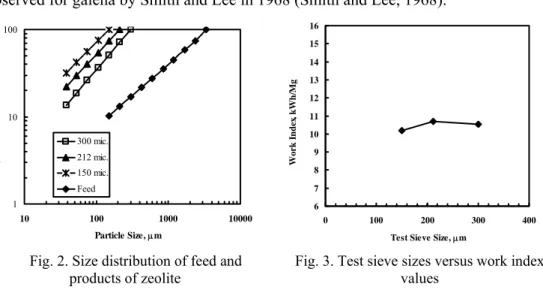
Bond work tests were done in three different test sieves which were 300, 212 and 150 micrometers. The average size distribution of feed and products were given in Fig 2. Bond work indexes were 10.55, 10.71, 10.18 kWh/t respectively for this zeolite sample. Fig 3 shows the test sieve sizes versus work index values. These results are very close to each other which is unusual situation. Generally, it is expected that, the less the test sieve sizes, the higher the work index. Therefore, all tests were repeated 3 times and the difference was not more than 2%. In literature, similar results were observed for galena by Smith and Lee in 1968 (Smith and Lee, 1968).
1 10 100 10 100 1000 10000 Particle Size, μm C u m . % U n d ersi ze . 300 mic. 212 mic. 150 mic. Feed 6 7 8 9 10 11 12 13 14 15 16 0 100 200 300 400
Test Sieve Size, μm
Wo rk I n d ex , kW h/ M g
Fig. 2. Size distribution of feed and
products of zeolite Fig. 3. Test sieve sizes versus work index values
4.2. Determination of the breakage rate function
Figure 4 shows the initial grinding results of sample plotted in first-order form for varying feed size fractions. Samples were ground individually as batch-wise for 0.5, 1.0, 2.0, 4.0, and 8.0 minutes to obtain both the breakage parameters and particle size distributions. It can be seen that, all feed size fractions match first-order rate kinetics. Coefficients of correlation are between 0.9989 to 0.9863.
Variation of the specific rates of breakage (Si) with particle size of the sample is
shown in Fig. 5. It is clearly seen that Si values increase up to a maximum particle size
then started to decrease at 1700 μm. This was due to the inefficiency of the largest feed sizes that were not nipped properly in the mill.
The initial grinding results obey the first-order breakage form as in Eq.
(6).
When the values of Si are fitted to the expression (6), the aT value is obtained byinserting α, xi and x0. Using Eq.(6), Si, aT, α, μ and λ parameters were obtained and
0.0 0.1 1.0 10.0 100.0 0 2 4 6 8 10
Grinding Time, min
M a ss F rac ti on of f ee d R em a in in g 3350 2360 1700 1180 850 600 425 0.1 1.0 100 1000 10000 Particle Size, μm B reak a ge R a te , S i
Fig. 4. First order plots for dry grinding of
different feed sizes of zeolite Fig. 5. Variation of the Sparticle size i values zeolite with Table 3. The overall breakage parameters for zeolite sample
aT α μ Λ Φ γ β δ
0.98 1.23 1.65 3.10 0.44 1.09 2.52 0.16
4.3. Determination of the primary breakage distribution function
The values of Bi,j were determined from the size distributions at short grinding
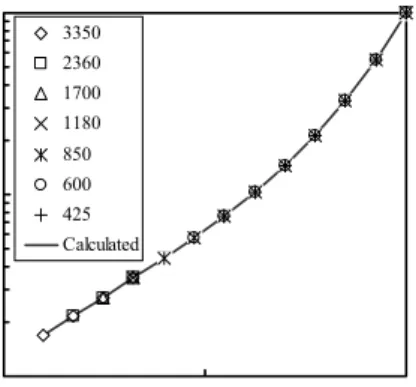
times using the BII method (Eq. 8). The primary breakage distribution function variations at different particle feed sizes are shown in Fig 6. The primary breakage distribution parameters were determined as indicated in Fig. 1and results are listed in Table 4. 0.01 0.1 1 0.01 0.10 1.00 Relative Size, xi/x1 Bi, j 3350 2360 1700 1180 850 600 425 0.01 0.10 1.00 0.01 0.10 1.00 Relative Size, xi/x1 Bi, 1 3350 2360 1700 1180 850 600 425 Calculated
Fig. 6. Primary breakage distribution
Determination of grindability characteristics of zeolite 191
Figure 6 and Table 4 show that, the primary breakage distribution functions were dependent on feed size. In order to normalize breakage distribution parameters, nonlinear regression technique was used to obtain the sum of the square of differences between the measured and calculated breakage distribution values. In this calculation, Eq. 11 was used instead of φ in Eq. 10. These parameters (φ, γ, β, δ) are listed in Table 3 and normalized breakage distribution functions are shown in Fig.7. This figure shows that calculated and experimental data were in good agreements.
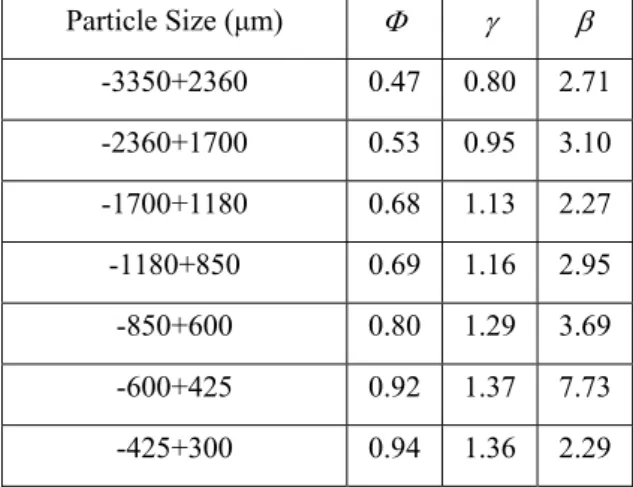
Table 4. The primary breakage distribution parameters obtained from short grinding times
Particle Size (μm) Φ γ β -3350+2360 0.47 0.80 2.71 -2360+1700 0.53 0.95 3.10 -1700+1180 0.68 1.13 2.27 -1180+850 0.69 1.16 2.95 -850+600 0.80 1.29 3.69 -600+425 0.92 1.37 7.73 -425+300 0.94 1.36 2.29 5. Conclusion
No significant differences in the Bond work index test were found for three different test sieves. That means that the work index values of zeolite was independent of test sieve sizes. The grinding of zeolite obeys the first order breakage kinetics in the case of all feed sizes. Faster breakage (represented by α parameters) from higher values to lower values were at –1700+1180 micrometers fraction. Different Bi,j values
(φ, β and γ) were obtained for each feed size fractions. It was seen that the breakage distributions obtained by the BII method were dependent on all starting feed sizes and this could not be normalized. When all model parameters were used, it was determined that all sizes were in conformity with all laboratory grinding data. The breakage parameters, obtained from the laboratory size mill, could be used for scaling up the industrial mills. This is performed by choosing the scale-up option in the simulation program for the mineral studied.
References
Austin, L.G., Bagga, P., 1981, An analysis of fine dry grinding in ball mills, Powder Tech, 28, 836-90
Austin, L.G., Klimpel, P.T., Luckie, P.T., 1984, The Process Engineering of Size Reduction, SME-AIME, New York, p. 561
Austin, L.G., Luckie, P.T., 1971/1972, Methods for determination of breakage distribution parameters, Powder Tech, 5, 215-221
Bond, F.C., 1961, Crushing and grinding calculations. Part I, British Chemical Eng. 6, 378-385
Clifton, R.A., 1987, Natural and Synthetic Zeolites, US Bureau of Mines Inf. Cir., IC 9140,1987.
Deister, R.J., 1987. How to determine the Bond work index using lab ball mill grindability tets, Engineering and Mining Journal, 188 (2), 42-45
Englert, A. H., Rubio, J., 2005, Characterization and environmental application of a Chilien natural zeolite. Int. J. Miner. Process. 75, 21-29.
Ipek, H., Ucbas, Y., Hosten, C., Determination of the grindability characteristics of ceramic raw materials, 10th Int. Mineral Processing Symposium, 5-7 October, Cesme, Turkey, 113-117, 2004.
Man., Y.T., 2002, Why is the Bond Ball Mill Grindability Test done the way it is done? The European Journal of Mineral Processing and Environmental Protection, 2, 34-39.
McIntyre, A., Plitt, L.R., 1980, The interrelationship between Bond and Hardgrove grindabilities, Canadian Institute of Mining, Metallurgy and Petroleum Bulletin, June, 149-155
Ozkan, A., Yekeler, M., Calkaya, M., 2009, Kinetics of fine wet grinding of zeolite in a steel ball mill in comparison to dry grinding. Int. J. Miner. Process. 90, 67-73. Smith, R.W., Lee, K. H., 1968, A comparison of data from Bont type simulated
closed-circuit and batch type grindability tests, AIME, Transactions, 241, 91-101. www.etimaden.gov.tr-Etimaden, Bigadic Bor Works report.
Yan, D., Eaton, R., 1994, Breakage properties of ore blends, Minerals Eng. 7, 1485-199
View publication stats View publication stats