Routing-based reactive scheduling policies for machine failures in
dynamic job shops
E. KUTANOGLUy* and I. SABUNCUOGLUz
A scheduling and control system can be viewed as a vital component of modern manufacturing systems that determines companies’ overall performance in their respective supply chains. This paper studies reactive scheduling policies developed against unexpected machine failures. These reactive policies are based on rerout-ing the jobs to their alternative machines when their primary machine fails. Depending on the subset of the jobs considered for rerouting, the long-term performance of four policies are tested under various conditions. Expecting that these rerouting policies would bring an extra load for a material-handling system (MHS), a dynamic job shop environment was studied with and without a MHS. It is shown that the proper selection of a good reactive policy is based not only on the system characteristics such as utilization, machine down times and frequency of machine failures, but also on the MHS capacity (in terms of speed and number of MH devices). The extensive experiments show that when the MHS is not a bottleneck and/or the down times are long enough to compensate the cost of extra rerouting, rerouting all aŒected jobs to their alternative machines proves to be the best policy. However, when the MHS cannot handle the extra load due to rerouting or the down times are relatively short, then rerouting only the jobs that will arrive to the failed machine during repair performs the best.
1. Introduction
EŒective production planning and scheduling is increasingly becoming an im-portant component of more general supply chain management activities. This makes e cient resource scheduling crucial for a possible supply chain-wide success. Along with the inherent but implicit opportunities that the combinatorial nature of sched-uling brings, a dynamic and stochastic production environment under which many plants operate makes eŒective scheduling even harder and more important. From this perspective, it is almost inevitable for researchers to focus on the realities of the underlying environment where unexpected events and interruptions occur any time. This paper investigates eŒects of random machine breakdowns on system perform-ance and it tests alternative policies to cope with the adverse eŒects of these unex-pected interruptions. From the control point of view, the study takes a reactive approach as the policies developed against machine failures are `reactive’ in nature, i.e. there is no provision of uncertainty in the planning/scheduling stage, instead dynamic (on-line) policies are triggered when a machine fails. We try to undercover the eŒectiveness of these policies under various conditions and system settings by conducting extensive computational experiments.
International Journal of Production Research ISSN 0020± 7543 print/ISSN 1366± 588X online # 2001 Taylor & Francis Ltd http://www.tandf.co.uk/journals
DOI: 10.1080/00207540110057909 Revision received April 2001.
{ Department of Industrial Engineering, University of Arkansas, Fayetteville, AR 72701, USA.
{ Department of Industrial Engineering, Bilkent University, Ankara, 06533, Turkey. * To whom correspondence should be addressed. e-mail: [email protected]
Many scheduling techniques are inherently reactive in the sense that they take into account the disruptions and adjust the scheduling decisions accordingly. One such technique is dynamic scheduling, also called priority dispatching, where an on-line schedule is generated over time by choosing the highest priority job when a machine becomes available. The inherent reaction of these methods is due to the fact that the decisions are made one at a time when they are needed which allow them to use up-to-date information about the shop conditions including machine availability. This is especially true for dynamic and state-dependent priority rules. In a way, self-updating nature of priorities makes corrections (reactions) against unex-pected events and disruptions. Hence, reactive scheduling and control is relatively easy using (dynamic) priority dispatching. (For some computational evidence of eŒectiveness of dynamic state-dependent priority dispatching especially against static and ® xed scheduling which aims to ® nd ® ne-tuned pre-planned schedules, see Lawrence and Sewell 1997 and Kutanoglu and Sabuncuoglu 1999.)
Even if the dynamic priority dispatching techniques are reactive in nature, the conjecture is that one can improve these heuristic techniques using additional poli-cies speci® cally designed to reduce the eŒects of disruptions. For example, a priority dispatching-base d schedule can be enhanced using explicit reactive policies against machine failures. For machine failures, the main concern of this paper, one such policy might be increasing the priorities of the aŒected important jobs (relative to the others). We can also reroute the jobs aŒected by the failure to alternative machines if the repair is expected to last long. As we will see, there are many variations of these techniques and others, and we will test a select group of them here.
As expected, these policies involve extra computation and information that is in addition to what is needed for a priority dispatching scheme. But we expect that simple reactive policies with little extra burden can be developed and used to get the bene® ts in the form of performance improvement. These policies, however, can perform diŒerently under diŒerent conditions. The easy-to-guess factors are the average frequency of machine failures, the length of failures/repairs, and other shop characteristics such as machine utilization and due date tightness. However, there are other factors that would certainly aŒect the policy selection. For example, a policy based on rerouting the jobs that are aŒected by a failed machine is expected to increase the load on the material handling system (MHS). Therefore, we need to make sure that the existing MHS can handle the extra load due to the selected rerouting policy. This study investigates the eŒects of reactive policies with and without MHS consideration, at diŒerent levels of MHS settings, as well as afore-mentioned non-MHS factors. From this perspective, the current paper is a continua-tion of previous work in which we did not consider the MHS (Kutanoglu and Sabuncuoglu 1995).
The next section reviews the relevant literature. We then explain our framework for scheduling and reactive policies for machine failures with selected performance measure of weighted tardiness. We use a priority dispatching rule, called Bottleneck Dynamics (BD) that is rather recent and designed for mainly due-date-related per-formances (Morton and Pentico 1993). BD is a more developed version of ATC (Apparent Tardiness Cost) that has been shown to perform well for weighted tardi-ness (e.g. Kutanoglu and Sabuncuoglu (1999). Moreover, BD comes with a routing scheme that is customized for our rerouting-base d reactive policies. This is explained in section 3; section 4 summarizes the experimental factors and conditions. This is
followed by the discussion of the experimental results in section 5. Finally, conclu-sions are drawn in section 6.
2. Literature review
The bulk of the published literature on scheduling problem deals with the task of schedule generation. Reactive scheduling and control issues under disruptions have not been adequately addressed in the literature. Most of the previous work either starts with a static ® ne-tuned schedule and uses rescheduling algorithms that may or may not be in response to the disruption, or utilizes reactive policies speci® c to the disruption along with the dynamic priority dispatching.
In the ® rst group, one of the early computational studies is by Muhlemann et al. (1982). They investigated how the frequency of scheduling in a dynamic job shop environment aŒected the performance where the processing time variations and machine breakdowns may occur randomly. From this perspective, it is not exactly a reactive scheduling study since rescheduling points may not coincide with the failure times. At each rescheduling point, a static schedule for current jobs is gener-ated by a dispatching rule. As anticipgener-ated, performance generally deteriorates when the rescheduling period increases. A similar but more extensive study by Sabuncuoglu and Karabuk (1999) investigated the interaction between rescheduling frequency and factors that represented ¯ exibilities in an FMS under machine failures and processing time variations. Sabuncuoglu and Bayiz (2000) showed the potential eŒectiveness of partial scheduling as compared with complete rescheduling at the rescheduling points which are not reactive similar to Muhlemann et al. (1982).
Again, in the ® rst group there are studies that propose to monitor the actual performance and take corrective actions if it is too diŒerent from the expected performance (of a preplanned schedule). Nof and Grant (1991) proposed a control mechanism that frequently monitored the current progress of the actual execution of a generated schedule, and selected a corrective action in the form of rescheduling if the deviation between the schedule and its execution was beyond a certain limit. The experiments with processing time variations where a right-shifting approach was used when the deviation was acceptable (rescheduling otherwise) show the eŒective-ness of the approach. In the experiments with machine failures, they tested three reactive policies when the deviation was not acceptable: (1) rerouting the jobs to alternative machines, (2) order-splitting (for batch production) and (3) rescheduling all the jobs without considering the alternative machines. While rescheduling was better than the rerouting policy, even a relatively weak recovery policy yielded better performance than no recovery at all. Kim and Kim (1994) proposed a mechanism that periodically monitored the system that ran a dispatching rule found by means of initial simulation runs with multiple rules. Similar to Nof and Grant (1991), if the diŒerence between the actual performance, which deteriorates under machine fail-ures, and the estimated performance exceeds a given limit, then a new set of simula-tion runs is performed to select a new dispatching rule. The experiments show that the monitoring interval and performance limits should be carefully designed to achieve better performances.
Finally, in the ® rst group, there are studies that take completely reactive approach, i.e. when a disruption occurs while executing a preplanned schedule, a policy is activated. Schedule revisions only after machine breakdowns are investi-gated by Yamamoto and Nof (1985). An initial schedule is generated by a branch-and-bound (B&B) method using makespan as an objective. When a machine fails,
one of the two approaches is taken: (1) right-shift the initial schedule and (2) re-schedule by B&B. These schemes are compared with pure priority dispatching. The experimental results show that using B&B in both scheduling and rescheduling per-forms better than right-shifting, which outperper-forms priority dispatching. This is possibly due to the robustness of the initial schedule generated by B&B. This implies that if the original schedule is well-planned, too frequent rescheduling may be unne-cessary. Similarly, Jain and Foley (1987) considered a case where the objective was to follow a preplanned schedule as closely as possible. The reactive scheduling policies for random machine failures are (1) rerouting the jobs scheduled to failed machine to alternative machines and (2) holding the interrupted jobs with high priority until the machine is repaired. The experiments show that rerouting always outperforms hold-ing in all levels of machine breakdown under all utilization levels tested. Dutta (1990) proposed a method that took corrective actions in case of unexpected events. An initial static schedule was generated by using static job-based priorities. When a machine failed, one of the corrective actions was taken: (1) rerouting the aŒected jobs to the alternative machines and (2) pre-empting scheduled jobs. The experi-ments showed that good performances can be achieved by taking any one of the corrective actions.
Bean et al. (1991) considered reconstruction of a part of preplanned schedule when a machine failed to match up with the preschedule at some future time. This approach was compared with the preplanned static scheduling, dynamic priority dispatching with several rules and total rescheduling, and the results of the test problems demonstrate the advantages of the match-up approach. Based on the match-up idea, Akturk and Gorgulu (1998) proposed a new rescheduling and a match-up point determination procedure through a feedback mechanism to increase the schedule quality and stability. Wu et al. (1993) adopted a similar approach to minimize the deviation between the new schedule and the preplanned one.
In the second group (no preplanned schedule but it unfolds in a dynamic way), there are not too many studies. As an example, Matsuura et al. (1993) compared (static) sequencing and (dynamic) dispatching under machine failures, rush job arri-vals and job speci® cation changes. When the disruptions and changes were small in scale, the sequencing strategy produced a better make-span. As the disruptions were larger in scale, dispatching outperformed sequencing. A hybrid approach in which sequencing is followed until the ® rst disruption after which dispatching is used is shown to be a good performer overall.
There are other studies that do not actually investigate the reactive scheduling problem but analyse related issues such as robustness (e.g. He et al. 1994, Leon et al. 1994, Byeon et al. 1998, Wu et al. 1999, for studies with processing time variations, and Mehta and Uzsoy 1998 for machine breakdowns), and Arti® cial Intelligence (AI)-based systems (e.g. Fox and Smith 1984, Smith et al. 1990, Szelke and Kerr 1994).
As we mentioned above, there is not much work in the second category where the scheduling tool is dynamic priority dispatching and the reactive policies involve just more than the inherent update of priorities. That is, we can improve these heuristic techniques using additional policies speci® cally designed to reduce the eŒects of the disruptions. It is observed that the majority of the studies treat the reactive sched-uling problem as reschedsched-uling (of all jobs). We will, however, speci® cally design rerouting policies for machine breakdowns instead of unresponsive rescheduling approaches. An observation that we can make for the rerouting policies in the above studies is that their eŒect on the MHS have not been tested although it
seems that this would be signi® cant if there were frequent and long failures. For example, some factors such as load and speed of the MHS become important for these rerouting mechanisms. Finally, the aim is to consider all the other related factors in the experiments along with MHS to get the whole picture of interactions and generalize the results.
3. Reactive scheduling
This section outlines the priority dispatching approach and reactive scheduling policies tested.
3.1. Dynamic scheduling with priority dispatching
As mentioned in the Introduction, dynamic and state-dependent priority rules show inherent reactions to the disruptions by adjusting the priorities of the jobs. This study uses a rather recent priority scheme called Bottleneck Dynamics (BD) for scheduling (Moron and Pentico 1993, Kutanoglu and Sabuncuoglu 1999). BD is the more developed version of the Apparent Tardiness Cost (ATC), which has been shown to be a good performer for due-date-related performance measures such as weighted tardiness. Another advantage of BD is that it comes with a routing scheme that it customized here for rerouting-based reactive policies.
The BD heuristic estimates the cost of delaying each operation (activity price) and estimates costs of using each resource (resource price) and trades oŒthese prices leading to a bene® t/cost ratio. BD uses the ratio as a priority to dynamically schedule the jobs. The notations used are given in the appendix.
BD prioritizes the jobs with most (estimated) urgency (calculated in its numera-tor called activity price), while penalizing the jobs with relatively long processing times on bottleneck machines (in its denominator, called total remaining resource usage). Urgency is dynamically captured computing the local resource constrained slack, which takes into account the waiting times on downstream machines:
SSij…t† ˆ di Xmi
qˆj‡1
…Wiq‡ piq† pij t;
where the summation is over all un® nished downstream operations indexed as
j‡ 1; . . . ; mi and Wiq is the estimated waiting time for operation q of job i. (The negative local slack can also be interpreted as estimated lateness if the job is scheduled immediately at time t so that its estimated completion time is
t‡ pij‡Pmqˆj‡1i …Wiq‡ piq†.) A standard and previously used technique is used to estimate waiting times inspired from the total work content rule: calculate Wiq propor-tional to the operation’s processing time as Wiqˆ bpiq, where b is a constant multiplier. One issue in this method is selecting the right value of the multiplier. In actual systems this can be done by using regression analysis on historically collected waiting times. In the present study, we tried several values for b in the preliminary simulation runs and ® xed at one level (see section 4 and Morton and Pentico 1993 for more on waiting time estimation techniques and their eŒect on the system performance).
The re¯ ection of this on the overall weighted tardiness is calculated using an exponential cost function that produces the following formula, called urgency factor:
Uij…t† ˆ exp …SSij…t†† ‡
Kpavg
Á !
where K is the look-ahead parameter, which could be set similar to parameter b. Although there are alternative ways to decide the proper value of K, some of which are tested in the literature, K was ® xed at a value after running preliminary experi-ments with diŒerent values (see Kutanoglu and Sabuncuoglu 1999 for a review of these methods).
The BD priority is the ratio between the current activity price (or estimated tardiness cost) and the resource usage cost:
BDij…t† ˆ wiUij…t† Xmi qˆj Rk…q†…t†piq ;
where Rk…q† is the resource price calculated for machine k…q†, the primary machine that will process operation q of the job. The resource usage on the denominator of the BD formula is calculated by summing the terms (resource price times operation processing times) over the remaining operations for the job under consideration. Resource price estimation is an important factor on the performance of BD (Morton and Pentico 1993, Kutanoglu and Sabuncuoglu 1999). Although diŒerent resource pricing methods could be used for this purpose, a dynamic resource pricing based on queuing analysis is used due to its better performance reported in Kutanoglu and Sabuncuoglu (1999). In this method, the resource price of machine
k at time t…Rk…t†) is based on both the current jobs in the queue and the overall utilization:
Rk…t† ˆ X Lk…t†
iˆ1
wiUij…k†…t† ‡ …wU†avgLk…t† »k 1:0 »k;
where Lk…t† is the current length of the queue in which jobs are numbered from 1 to
Lk…t†, Uij…k†…t† is urgency factor for operation j…k† of job i that requires machine k, …wU†avg is average delay cost, and »kis the average utilization of the machine. If the machine’ s queue is long with mostly urgent jobs, and/or the machine is busy most of the time, the machine’s price will be larger, which will aŒect the resource usage cost of a job in a negative way. For a broader discussion of BD, see Kutanoglu and Sabuncuoglu (1999) and Morton and Pentico (1993).
3.2. Reactive scheduling by rerouting
In this study, machine breakdowns are used as unexpected disruptions. Although there are countless possible policies that can be considered as a response to machine failures, we focus on several rerouting policies. In these, we use dynamic BD dis-patching as long as there are no disruptions. When there is a machine failure that prevents further processing of jobs, then we reroute the jobs that are or will be aŒected by the failure to alternative machines. In this way, each operation of every job has a primary machine and multiple alternative machines. If the primary machines of a job’s routing are all available, then the alternative machines are not visited and the original routing is used. When the primary machine breaks down, the job is rerouted to one of the alternative machines which is a subset of existing machines. Of course, the alternative that the job is sent should be selected very carefully, otherwise we may not get any bene® t from rerouting the jobs.
We will test several rerouting policies. Along with the policy of no rerouting that is included here as a benchmark, there are four alternative reactive scheduling poli-cies to test:
(1) No rerouting (NR): when a machine failure occurs, it will be down for some time (i.e. during repair time) which makes the machine unavailable. If the machine fails during processing a job, then the job is preempted. The effect of the failure depends on whether the machine has jobs in its queue and whether there is any preempted job. In no rerouting policy, all these jobs `wait’ for the repair to be ® nished and they are kept in the queue of the failed machine. After the machine’ s repair is completed, the preempted job is ® rst ® nished. Then, the dynamic BD priorities are calculated, and the job with the highest priority starts being processed.
(2) Queue rerouting, (QR): as an alternative to the `no rerouting’ policy, one can reroute the jobs affected by the machine failure to alternative machines. The queue rerouting policy transfers these jobs from the broken machines to alternative machines. Considering that the time spent while waiting in the queue for repair (as in no rerouting) will be lost, this policy could expedite the processing of jobs.
(3) Arrival rerouting (AR): in the queue rerouting policy, the broken machine still receives jobs (as new arrivals), although they will not be processed right away due to machine failure. The arrival rerouting policy keeps the jobs in the queue of the failed machine and reroutes the new arrivals to alternative machines directly from the machine that just completed their processing (this is done only during the repair time). This policy aims to save the MHS from extra load due to queue routing. Since new arrivals will eventually have to be moved from wherever they are processed to a machine for their next opera-tion, that might as well be the alternative (but working) machine.
(4) All rerouting (AAR): this is a combination of QR and AR. It reroutes all the jobs in the queue plus all the new arrivals (during the repair time) to the alternative machines. This policy aims to do whatever possible to move the jobs away from the broken machine, and it does not have any consideration for the extra MHS load that it brings.
Rerouting of a job to one of the alternative machines is performed by using BD routing principles. For this purpose, a `routing cost’ is calculated for each alternative machine, and the machine with the minimum cost is selected. The cost function contains the resource prices of one of the alternative machines and downstream machines, processing times on these machines and the expected completion time of each downstream operation. In this way, BD tries to select the alternative machine which is non-bottleneck in the job’s (new) route.
The cost of a route for job i whose operation j cannot be processed on its primary machine due to a failure is:
Cirˆ Rr…t†prij‡ Xmi
qˆj‡1
Rk…q†…t†piq‡ wiUijr…t†;
where r is both the route and the alternative machine. Note that Rr…t† is the resource price of the alternative machine r for jth operation whose primary machine k… j† is down. Note also that the processing time prijnow depends on the alternative machine
under consideration, which might be diŒerent from the primary or other alternative machines. Hence, the ® rst term is the resource usage for the current operation j. The second term is the resource usage for downstream machines, which is the same for all alternative routes assuming that the job follows primary machines, included here for completeness of the cost function. The last term is the relative urgency cost of the route. Since the completion time of the job will be diŒerent under diŒerent routes, the urgency factor now depends on the route, which is represented by superscript r. The cost of each alternative route r is calculated and the route with the minimum cost is chosen. The job is then transferred to the alternative machine whose route produces the minimum cost. Note that if the selected alternative machine is busy, then the job is placed in the queue to wait its turn, otherwise it is immediately processed.
3.3. Material handling system considerations
As mentioned in the Introduction, a strong interaction is expected between MHS characteristics and the performance of the rerouting policies, which in turn deter-mine the overall system performance. For example, the load, speed and capacity of the MHS can aŒect the performances of diŒerent rerouting mechanisms diŒerently. Moreover, the rerouting policies aŒect the load on the MHS. Hence, we consider existence of MHS as a factor and model both a system with an MHS and without one. For the system with the MHS, the BD priority dispatching is used to schedule MH devices. For this reason, we calculate resource prices for MH devices similar to the machine prices. We also include the prices of the MH devices when we calculate the cost of the alternative machines explained above.
Note that the resource prices for alternative machines and MH devices are quite signi® cant in the sense that they are based on the relative urgencies of the jobs that they are processing or carrying, how busy they are, etc. These prices are in turn used for two operational purposes: (1) job dispatching, which makes the BD dispatching signi® cantly diŒerent from its earlier versions, and (2) routing or alternative machine selection. In a way, the method used to quantify the machine and MH prices will in part determine the overall ¯ ow of the jobs in the system.
4. Experiments
In simulation experiments, a hypothetical re-entrant job shop with weighted tardiness performance measure is modelled with the following characteristics. Jobs arrive continuously according to a Poisson process. The jobs have a ® xed number of operations selected from a discrete uniform distribution from 1 to 10. The primary routing of the jobs is determined randomly among 10 machines available in the shop. Job weights are drawn from Uniform[1,30]. Due dates are assigned randomly over a full range of ¯ ow allowances, with an average of 6.0 and 2.0 times the mean total job processing time for relatively loose and tight due date setting respectively. There are 10 machines that are subject to fail. The average utilization of the shop is determined by calibrating the arrival rate of the jobs. There are two utilization levels: low (52% ) and high (68% ). The utilization levels are calculated without considering the down times of the machines (see Kutanoglu and Sabuncuoglu 1999 for more details on the data generation).
Machine breakdowns are modelled by using the busy time approach proposed by Law and Kelton (1991). With this approach, a random uptime is generated for each machine from a busy time distribution. The machine is considered as up until its
total accumulated busy time reaches the end of the generated uptime. Then it fails for a random time drawn from a down time distribution, after which an uptime is generated. Law and Kelton (1991) recommended that in the absence of real data, busy time distribution is most likely to be a Gamma distribution with a shape par-ameter (¬b) which is equal to 0:7 and a scale parameter to be speci® ed according to the experimental conditions. The authors also state that Gamma distribution with a shape parameter (¬d) ® xed at 1:4 is appropriate for the distribution of down times. In this framework, the level of machine breakdown is measured by the e ciency level that gives the long-run ratio of machine busy time to total busy and down time. In fact, this ratio is changed to generate the desired levels of machine breakdowns. This is done by ® xing the ratio of mean busy time to the sum of mean busy and down time. In this way, the duration of each breakdown (which is also repair time) comes from
Gamma…¬bˆ 1:4; bˆ davg=1:4† and busy time between two successive failures is drawn from
Gamma ¬d ˆ 0:7; d ˆ davg£ e 0:7…1 e†
³ ´
;
where davgis the mean duration of breakdown and e is the e ciency level. The mean duration of failure (mean repair time) can take values pavg, 5pavg, 10pavg, 15pavg, 20pavg where pavg is the average operation processing time. The e ciency has two levels as 80 and 90% . In this way, a smaller mean failure time with the same e ciency represents a higher frequency of short breakdown times.
In addition to the main machine, two machines are randomly selected from existing machines that will be considered as an alternative in case of machine break-downs. The processing time on the alternative machine may be the same as on the primary machine (equal alternative machine) or it can be 20% larger (unequal
alter-native machine). Note that the latter represents a more realistic case, where, for
example, the alternative machine might be older technology, which might be the reason for having the other machine as primary.
For the systems simulated with a hypothetical MHS, transfer times are drawn from a uniform distribution and have a mean according to the ratio between the mean transfer and mean processing times. The ratio is set to one of the values: 0.15, 0.30 and 0.35. This means that when the ratio is set 0.30, for example, the mean of the MH time is set to 0:30pavg. The loaded MH device is 20% slower than the empty device and the loading and unloading times are both equal to 0.25 time units. Four or ® ve MH devices are in the system, which determines the changing capacity of the MHS. All these factors and their levels are summarized in table 1.
The system is simulated by using SIMAN (Pegden et al. 1990) simulation language with linked C subroutines in a UNIX environment. The method of batch means is used to compare the results. We determine a warm-up period for the system as 1200 job-completion. The batches with 1500 jobs each are made, leading to a 16 200-job run, which produce results for long-term performance analysis.
5. Experimental results
Kutanoglu and Sabuncuoglu (1995) analysed the no material handling case con-ducting extensive experiments with full-factorial design (for the non-MHS factors). The main conclusions of that study were as follows.
. The weighted tardiness-based system performance deteriorated signi® cantly when there were machine failures, regardless of the level of disruption (fre-quency and length). When the due dates were tight and/or utilization was high, this deterioration was more visible. The most robust reactive policies that did not show much deterioration were arrival rerouting (AR) and all rerouting (AAR).
. The relative performances of the reactive policies were not aŒected by the due date tightness level.
. The AAR policy was the best among the tested ones almost in all conditions. The main exception was when the utilization was high overall, the alternative machine is unequal (20% more processing time) and when the machines were repaired very quickly (mean down time davgis pavg), in which arrival rerouting (AR) was the best performer. In almost all cases, NR was outperformed, while the QR policy was the second worst. For more detailed analysis of the results, see Kutanoglu and Sabuncuoglu (1995).
In the present study, the main computational focus is on the investigation of MHS so that a more complete picture can be drawn for more general cases. Using the full-factorial experiments from our previous study as screening experiments for the current work, we chose to conduct a more selective set of experiments. Speci® cally, we will analyse the eŒects of utilization, e ciency, alternative machine penalty (equal/unequal) and mean down time from the previous experiments, but at their selected levels. For this set of experiments, for example, we set due dates as tight in all conditions. We again form a base case for the MH considerations: four MH devices, material handling/processing time (MH/PT) ratio set at 0.30. The base level for machine failures is an 80% e ciency level with equal alternative machines. We present these results with the detailed analysis of MHS-based factors.
5.1. Utilization and mean down time
Using the base levels of the factors, we conducted a set of experiments to see the eŒects of utilization on our system with MHS. The results of this set of experiments are presented in tables 2 and 3, where * denotes that the system explodes (saturates) because of the insu ciency of the (® xed) MHS capacity. This is due to the extra
Factor Number of levels Levels
Due date 2 tight (2), loose (6)
Utilization 2 low (52% ), high (68% )
E ciency (% ) 2 80, 90
Mean down time 4 0 (no down), pavg, 5pavg, 10pavg, 15pavg, 20pavg
Alternative machine 2 equal, unequal
Number of MH devices 2 4, 5
MH/processing ratio 3 0.15, 0.30, 0.35
(sometimes heavy) load that the rerouting policies (queue and all) bring that the current MHS cannot carry. Note that there are more saturated cases in the high utilization case, which is expected since the high utilization means more jobs for the MHS to carry. It becomes again possible for MHS to handle the extra load under all rerouting and queue rerouting when the repairs take longer. This is probably due to the load reduction eŒect of the down times since when during a long down time fewer jobs are ® nished, which in turn reduces the demand for MH devices. When the MHS is capable of handling the extra load introduced by AAR, then the AAR policy is the best followed by AR. However, when the system explodes because of this extra load, then AR is the best performer overall with a high level of robustness. This suggests that AAR is not always the best policy; when the MHS is a constrained resource, other policies such as AR can become more eŒective in circulating the jobs on the shop ¯ oor. This results, in fact, contradicts with the results from Kutanoglu and Sabuncuoglu (1995), where we did not consider a MHS and found that AAR is the best across in almost all conditions. Seeing the magnifying eŒect of high utilization, we set the utilization high in the rest of experiments.
5.2. EYciency
The results of the experiments with 90% e ciency as compared with 80% base level are presented in table 4. When tables 3 and 4 are compared, we see that the higher e ciency level has an eŒect similar to lowering the utilization in the sense that the MHS is more capable of handling load due to AAR and QR. However, unlike low utilization results, the AR policy produces lowest weighted tardinesses across all down times. This result again depicts another diŒerence from the results in Kutanoglu and Sabuncuoglu (1995), where under the same conditions (without
Mean down time No down: 953.05
Policy pavg 5pavg 10pavg 15pavg 20pavg
No rerouting 1929.84 2971.34 3988.73 4736.03 5610.80
Queue rerouting * 2104.56 2895.99 3547.09 4390.91
Arrival rerouting 1550.36 1643.71 1670.29 1669.76 1705.24
All rerouting * 1340.63 1273.00 1240.51 1256.82
Table 2. Average weighted tardiness for diŒerent mean down times. Number of MH devices ˆ 4; MH/processing time ˆ 0:30; tight due dates; low utilization; equal alt. mach., efficiency ˆ 80% .
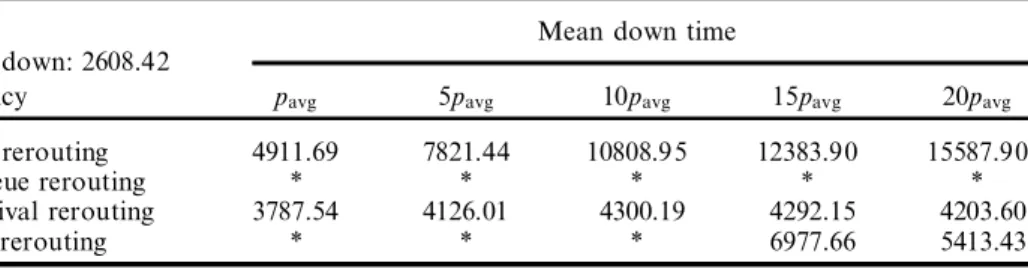
Mean down time No down: 2608.42
Policy pavg 5pavg 10pavg 15pavg 20pavg
No rerouting 4911.69 7821.44 10808.95 12383.90 15587.90
Queue rerouting * * * * *
Arrival rerouting 3787.54 4126.01 4300.19 4292.15 4203.60
All rerouting * * * 6977.66 5413.43
Table 3. Average weighted tardiness for diŒerent mean down times. Number of MH devices ˆ 4; MH/processing time ˆ 0:30; tight due dates; high utilization; equal alt. mach., efficiency ˆ 80% .
MHS) AAR performs the best. With the explicit consideration of MHS, the AR policy outperforms AAR at all levels, although the performance of AAR approaches to that of AR as the mean down times become longer. The improvement that one could get from AR over AAR depends on the down time factors (i.e. e ciency and mean down time) since the diŒerence between them is not constant if the results in tables 3 and 4 are compared. In both low and high e ciency levels, the NR and QR policies are not a sound alternative since they are the worst performers in the group. 5.3. Alternative machine penalty and MH/PT ratio
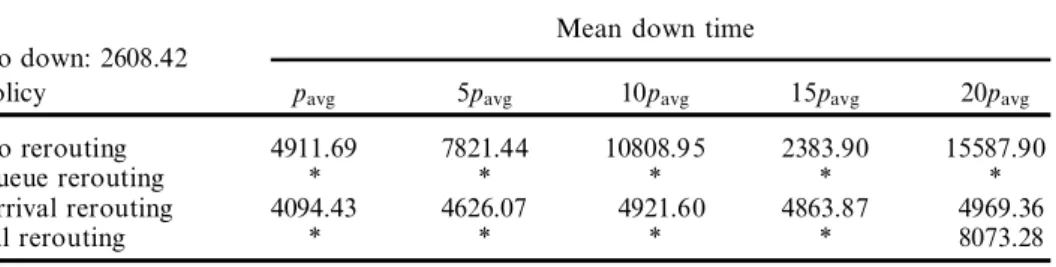
The results of the experiments with unequal machines and all other factors being at their base levels are given in table 5. Comparing tables 3 and 5, we see the adverse eŒects of alternative machines with longer processing times. All weighted tardinesses go up for all policies, and MHS cannot handle the extra load from all rerouting even in relatively long down times (15pavg). We expect that with a higher penalty than 20% longer processing time, the situation would get worse. In all these cases, the AR policy is again the best across all down times. This is again a diŒerent observation from the one obtained in our previous study in which the AAR was dominant in all conditions. The new results show that depending on the relative penalty on the alternative machines, it might be more desirable to reroute only the new arrivals instead of all aŒected jobs.
To see how the material handling/processing time ratio aŒects the overall picture, we conducted additional experiments with MH=PT ˆ 0:15. This means that the MH devices are faster relative to the ratio of 0.30 used as base level. The results are shown in table 6. Comparison with table 5 shows that most of the negative eŒects of having unequal alternative machines can be eliminated with a speedy and responsive MHS
Mean down time No down: 2608.42
Policy pavg 5pavg 10pavg 15pavg 20pavg
No rerouting 3393.46 4206.99 5190.09 5954.67 7063.31
Queue rerouting * 13402.28 7668.58 6720.89 7302.83
Arrival rerouting 2955.99 3107.68 3188.59 3143.97 3104.84
All rerouting * 6588.54 4062.29 3620.61 3227.67
Table 4. Average weighted tardiness for diŒerent mean down times. Number of MH devices ˆ 4; MH/processing time ˆ 0:30; tight due dates; high utilization; equal alt. mach., efficiency ˆ 90% .
Mean down time No down: 2608.42
Policy pavg 5pavg 10pavg 15pavg 20pavg
No rerouting 4911.69 7821.44 10808.95 2383.90 15587.90
Queue rerouting * * * * *
Arrival rerouting 4094.43 4626.07 4921.60 4863.87 4969.36
All rerouting * * * * 8073.28
Table 5. Average weighted tardiness for diŒerent mean down times. Number of MH devices ˆ 4; MH/processing time ˆ 0:30; tight due dates; high utilization; unequal alt.
(for all reactive policies). The 50% improvement on the MH speed proves to be one of the best investments to make if one wants to implement AAR since this policy again becomes the best except in cases with very short down times.
5.4. Alternative machine penalty and number of MH devices
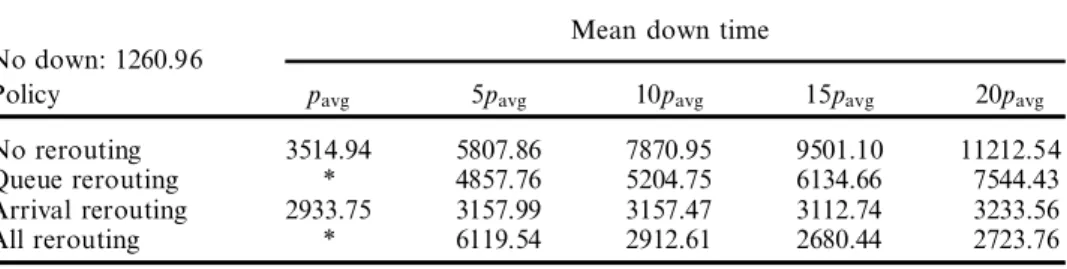
To see if we can get some bene® ts by increasing the number of MH devices, we conducted additional experiments with ® ve devices instead of four (see table 7 for the results of the equal alternative machine case). Note that the MH/PT ratio is set again to its base level of 0.30. If we compare tables 3 and 7, we see that having more MH devices relieves the system from problems due to the rerouting policies and improves the performance of the all policies. While the AR policy is the best for mean down times of pavg and 5pavg, AAR performs the best for the longer down times. To see the eŒect of unequal machines for the system with ® ve devices, we conducted more experiments (table 8). The results show that although all policies (except NR) are
Mean down time No down: 943.27
Policy pavg 5pavg 10pavg 15pavg 20pavg
No rerouting 3010.28 5379.26 6891.18 9113.84 11101.08
Queue rerouting * 3065.25 4339.05 5266.18 6610.42
Arrival rerouting 2460.64 2646.03 2671.78 2602.70 2758.43
All rerouting * 2642.94 2206.58 2098.61 2187.05
Table 6. Average weighted tardiness for diŒerent mean down times. Number of MH devices ˆ 4; MH/processing time ˆ 0:15; tight due dates; high utilization; unequal alt.
mach., efficiency ˆ 80% .
Mean down time No down: 1260.96
Policy pavg 5pavg 10pavg 15pavg 20pavg
No rerouting 3514.94 5807.86 7870.95 9501.10 11212.54
Queue rerouting * 4109.59 4962.48 5865.39 7348.54
Arrival rerouting 2532.20 2731.07 2748.05 2779.43 2788.55
All rerouting * 2826.40 2316.75 2212.76 2237.45
Table 7. Average weihgted tardiness for diŒerent mean down times. Number of MH
devices ˆ 5; MH/processing time ˆ 0:30; tight due dates; high utilization; equal alt. mach., e ciency ˆ 80% .
Mean down time No down: 1260.96
Policy pavg 5pavg 10pavg 15pavg 20pavg
No rerouting 3514.94 5807.86 7870.95 9501.10 11212.54
Queue rerouting * 4857.76 5204.75 6134.66 7544.43
Arrival rerouting 2933.75 3157.99 3157.47 3112.74 3233.56
All rerouting * 6119.54 2912.61 2680.44 2723.76
Table 8. Average weighted tardiness for diŒerent mean down times. Number of MH
devices ˆ 5; MH/processing time ˆ 0:30; tight due dates; high utilization; unequal alt. mach., efficiency ˆ 80% .
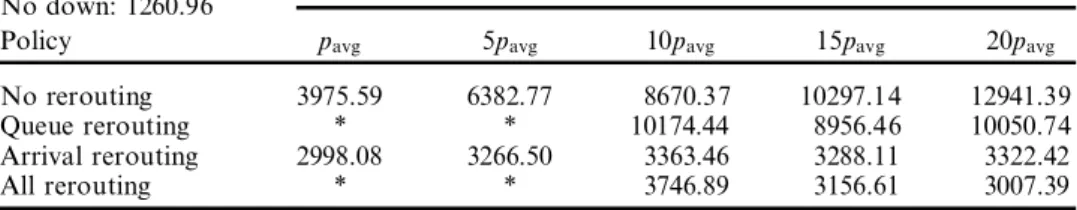
aŒected negatively, the relative performances of the policies AR and AAR remain the same. We ® nally ran experiments with ® ve MH devices and with equal alternative machines, but set MH=PT ˆ 0:35 (table 9). Having a slower MHS even with more MH devices aŒects all the policies negatively, and we have little more cases with saturation. Comparing tables 7 and 9 shows that slowing the MHS down bring costs for all policies. Moreover, we have more saturated cases and even in down times of 10pavg the AR policy is better than AAR. This again shows that even if the MHS is capable of handling the extra load, the performance of AAR is poor. To see if having more MH devices (four versus ® ve) or faster MHS (0.30 versus 0.35 MH/PT ratio), we compare tables 3, 7 and 9. We see that in terms of increasing the `capacity’ of the MHS, having ® ve relatively slow devices is more advantageou s than having four fast ones. However, we expect that there is a certain MH/PT ratio >0.35 that would produce closer results to the four MH devices case.
5.5. Discussion
When we compare the results of the systems with and without MHS, we see that when there are large number of MH devices and/or a relatively fast MHS transpor-tation (low MH time/processing time ratio), the observations are very similar to the ones that have been made for the no-MHS case. In such cases, the capacity of the MHS is not an important issue in the overall system, and the relative performances of the reactive policies are the same as in the no-MH case. Except for the very short down times, the AAR policy consistently performes well. Experiments also indicate that when the down times (or repair times) are short, it is not worthy to send the jobs in the queue of the failed machine to the alternative machine; transferring only the new arrivals to the alternative (AR policy) performs better in these cases. This is especially true when there are additional penalties for rerouting such as unequal alternative machines and higher utilization.
When the MHS capacity is limited, either in terms of speed or the number of MH devices, then the MHS may not handle the extra load due to rerouting of the jobs in the queue. In these cases, only if the repairs take longer times, the AAR should be the preferred policy. In other cases where the MHS is not capable of handling the extra load or the repair times are short, the AR policy yields very good weighted tardiness results. Even in the cases with down times up to 15pavg, AR is better than AAR, especially at higher utilization levels and with unequal alternative machines. This was not observed in the experiments without the MHS. As examples, we present the results of no MH case along with current results for medium level down times (10pavg) in ® gures 1 and 2. Figure 1 shows that when the MHS is not explicitly
Mean down time No down: 1260.96
Policy pavg 5pavg 10pavg 15pavg 20pavg
No rerouting 3975.59 6382.77 8670.37 10297.14 12941.39
Queue rerouting * * 10174.44 8956.46 10050.74
Arrival rerouting 2998.08 3266.50 3363.46 3288.11 3322.42
All rerouting * * 3746.89 3156.61 3007.39
Table 9. Average weighted tardiness for diŒerent mean down times. Number of MH
devices ˆ 5; MH/processing time ˆ 0:35; tight due dates; high utilization; equal alt.
High Utilization, High Efficiency, Equal Alt. Mach., MH=4, MH/PT=0.30, 10p Down 0 500 1000 1500 2000 2500 3000 3500 4000 4500 A vg . W ei gh te d Ta rd in es s AR 1104 3188 AAR 866 4062 No MH With 4 MH AR AR AAR AAR
Figure 1. Average weighted tardiness for systems with an without MHS (tight due dates, high utilization, high eYciency, equal alternative machines, four MH devices, MH/PT ratio ˆ 0:30, mean down time ˆ 10pavg.
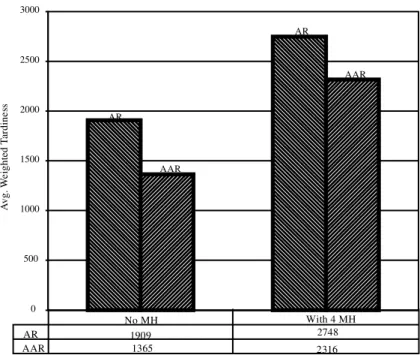
0 500 1000 1500 2000 2500 3000 AR AR AAR AAR AR 1909 2748 AAR 1365 2316 No MH With 4 MH
High Utilization, Low Efficiency, Equal Alt. Mach., MH=5, MH/PT=0.30, 10p Down
A vg . W ei gh te d Ta rd in es s
Figure 2. Average weighted tardiness for systems with an without MHS (tight due dates, high utilization, low eYciency, equal alternative machines, ® ve MH devices, MH/PT ratio ˆ 0:30, mean down time ˆ 10pavg.
considered, the AAR policy is better than AR. However, when the MHS is modelled, we see that the AR policy performs far beter than AR even with down times on average 10 times the average processing time (the shorter the down times, the better the AR policy). As a comparison, ® gure 2 presents a similar plot for MHS with a larger capacity (® ve MH devices instead of four) at 10pavg mean down time, in which the AAR policy keeps its best position. Also note that in all conditions, the QR and NR policies are not the solution for reactive scheduling for both cases with and without MHS. In comparison, the AR and AAR policies are more robust and their performances are very good as in no material-handling case. We conjecture that the QR’s low performance is due to its inablity to get the bene® ts of rerouting the arrivals since both AR and AAR improves the performance by rerouting the new arrivals.
6. Conclusions
This study tested several reactive scheduling policies based on rerouting devel-oped speci® cally for machine breakdowns in a dynamic job shop environment. The results showed that the arrival rerouting policy (rerouting the new arrivals to one of the alternative machines while waiting for the repair) should be preferred when the machines are broken often and repaired in a short time or the MHS capacity is low to handle the extra requirements of all rerouting policy (reroute new arrivals and the jobs in the queue of the failed machine to one of their alternatives). No reaction is not seen as an appropriate strategy for reactive scheduling.
From these results, we see that the best reactive scheduling strategy mostly depends on the several factors such as utilization, capacity of the MHS, duration and frequency of the machine failures, and if the alternative machine involves addi-tional penalty. By considering the current system conditions and estimated impacts of the unexpected events, we can select the appropriate reactive policy. Although we tried to cover many factors and their diŒerent levels in this single study, we should note that the results are somewhat dependent on system conditions tested. We think that the results are more generalizable in the dimensions of due date tightness, utilization, mean down time and MHS characteristics. However, one can try diŒer-ent distributions for down times, diŒerdiŒer-ent and more volatile e ciency levels, and diŒerent levels of alternative machine penalty (equal and unequal are tested) to see if the results can be extended into those cases.
This study used Bottleneck Dynamics principles for both dispatching and rerout-ing. We did not test the interaction that we could have if we had a diŒerent dis-patching and/or rerouting scheme. Note that even if the same reactive policies are considered, using a diŒerent routing rule would lead to sending the jobs to diŒerent alternative machines, which would aŒect the results. Similarly, being a ® rst-step analysis, this study did not include tests for more complex reactive policies. One such policy, for example, would selectively and dynamically decide if rerouting is worthy or if the additional MH load can be handled. We leave these issues for a future study.
Appendix: Notation and symbols
i job index,
j; q operation index,
j…i† operation j of job i,
t current time,
mi number of operations of job i,
wi weight or tardiness penalty of job i,
di due date of job i,
Ti tardiness of job i, maxf0; Ci dig,
aij arrival time of job i for operation j to the current machine,
pij processing time of operation j of job i,
pavg average processing time of jobs waiting for a resource,
Wij estimated waiting time for operation j of job i,
SSij…t† local resource constrained slack of operation j of job i at time t,
Uij…t† urgency factor of operation j of job i at time t,
b waiting time estimation multiplier,
K; h look-ahead parameters,
k…q† machine required for operation q of the job under consideration
Rk…t† resource price of machine k at time t, »k utilization of machine k,
Lk…t† queue length of machine k at time t,
WT average weighted tardiness measure, WT ˆPniˆ1wiTi=n, …x†‡ maxf0; xg.
References
Akturk, M. S. and Gorgulu, E., 1998, Match-up scheduling under a machine breakdown. European Journal of Operational Research, 112, 80± 96.
Bean, J., Birge, J. R., Mittenthal, J. and Noon, C. E., 1991, Match-up scheduling with multiple resources, release dates and disruptions. Operations Research, 39, 470± 483. Byeon, E. S., Wu, S. D. and Storer, R. H., 1998, Decomposition heuristics for robust
job-shop scheduling. IEEE Transactions on Robotics and Automation, 14, 303± 313. Dutta, A., 1990, Reacting to scheduling exceptions in FMS environments. IIE Transactions,
22, 300± 314.
Fox, M. S. and Smith, S. F., 1984, ISISÐ a knowledge-based system for factory scheduling. Expert Systems, 1, 25± 49.
He, Y., Smith, M. L. and Dudek, R. A., 1994, EŒects of inaccuracy of processing time estimation on eŒectiveness of dispatching rule. Proceedings of the 3rd Industrial Engineering Research Conference, pp. 308± 313.
Jain, S. and Foley, W. J., 1987, Real-time control of manufacturing systems with redun-dancy. Proceedings of the 1987 ASME International Computers in Engineering Conference and Exhibition, New York, pp. 235± 239.
Kim, M. H. and Kim, Y., 1994, Simulation-based real-time scheduling in a ¯ exible manu-facturing system. Journal of Manumanu-facturing Systems, 13, 85± 93.
Kutanoglu, E. and Sabuncuoglu, I., 1995, An investigation of reactive scheduling policies under machine breakdowns. Proceedings of the 4th Industrial Engineering Research Conference, pp. 904± 913.
Kutanoglu, E. and Sabuncuoglu, I., 1999, An analysis of heuristics in a dynamic job shop with weighted tardiness objectives. International Journal of Production Research, 37, 165± 187.
Law, A. M. and Kelton, W. D., 1991, Simulation Modeling and Analysis (New York: McGraw-Hill).
Lawrence, S. R. and Sewell, E. C., 1997, Heuristic, optimal, static, and dynamic schedules when processing times are uncertain. Journal of Operations Management, 15, 71± 82. Leon, V. J., Wu, S. D. and Storer, R. H., 1994, Robustness measures and robust scheduling
for job shops. IEE Transactions, 26, 1243± 1263.
Matsuura, H., Tsubone, H. and Kanezashi, M., 1993, Sequencing, dispatching, and switch-ing in a dynamic manufacturswitch-ing environment. International Journal of Production Research, 31, 1671± 1688.
Mehta, S. V. and Uzsoy, R. M., 1998, Predictable scheduling of a job shop subject to breakdowns. IEEE Transactions on Robotics and Automation, 14, 365± 378.
Morton, T, E. and Pentico, D., 1993, Heuristic Scheduling Systems with Applications to Production and Project Management (New York: Wiley).
Muhlemann, A. P., Lockett, A. G. and Farn, C. K., 1982, Job shop scheduling heuristic and frequency of scheduling. International Journal of Production Research, 20, 227± 241. Nof, S. Y. and Grant, F. H., 1991, Adaptive/predictive scheduling: review and a general
framework. Production Planning and Control, 2, 298± 312.
Pegden, C. D., Shannon, R. E. and Sadowski, R. P., 1990, Introduction to Simulation Using SIMAN (New York: McGraw-Hill).
Sabuncuoglu, I. and Bayiz, M., 2000, Analysis of reactive scheduling problems in a job shop environment. European Journal of Operational Research, 126, 567± 586.
Sabuncuoglu, I. and Karabuk, S., 1999, Rescheduling frequency in an FMS with uncertain processing times and unreliable machines. Journal of Manufacturing Systems, 18, 1± 16. Smith, S. F., Ow, P. S., Potvin, J. and Matthys, D. C., 1990, An integrated framework for generating and revising factory schedules. Journal of the Operational Research Society,
41, 539± 552.
Szelke, E. and Kerr, R., 1994, Knowledge-based reactive scheduling. Production Planning and Control, 5, 124± 145.
Wu, S. D., Byeon, E. S. and Storer, R. H., 1999, A graph-theoretic decomposition of job shop scheduling problems to achieve scheduling robustness. Operations Research, 47, 113± 124.
Wu, S. D., Storer, R. H. and Chang, P., 1993, One-machine rescheduling heuristics with e ciency and stability as criteria. Computers and Operations Research, 20, 1± 13. Yamamoto, M. and Nof, S. Y., 1985, Scheduling and rescheduling in the manufacturing
operating system environment. International Journal of Production Research, 23, 705± 722.