PEPTIDE DRUG CANDIDATES
FOR PATHOGENIC AMYLOIDS
A THESIS SUBMITTED TO
THE GRADUATE SCHOOL OF ENGINEERING AND SCIENCE OF BILKENT UNIVERSITY
IN PARTIAL FULFILLMENT OF THE REQUIREMENTS FOR THE DEGREE OF
MASTER OF SCIENCE IN
MATERIALS SCIENCE AND NANOTECHNOLOGY
By
CEMİLE ELİF ÖZÇELİK JANUARY 2020
i ABSTRACT
PEPTIDE DRUG CANDIDATE FOR PATHOGENIC AMYLOIDS Cemile Elif Özçelik
M.S in Materials Science and Nanotechnology Advisor: Urartu Özgür Şafak Şeker
January 2020
Amyloid fibrils are very stable, ordered cross-β structured, resistant to protease degradation, proteinaceous composits. All amyloids have different peptide/protein sequences although they express similar structural properties. Some of amyloids possess advantageous functionalities such as protection, cell-cell communication, protein storage. However, most of amyloids are associated with various severe diseases such as neurodegenerative diseases. Although amyloids follow similar formation pathway, pathogenic amyloids are challenging since their formations are supported with secondary pathways. Up to now, there were several therapeutic approaches that are only effective in symptoms of disease conditions by masking or slowing down the symptom developments. Nonetheless, different approaches are developed for inhibiting amyloid aggregation. Today, most of the strategies are aiming to inhibit secondary nucleation, which is not fully understood yet. So, such approaches can be faced with lots of challenge in terms of secondary nucleation kinetics and formation mechanism. Thus, inhibition of monomeric
ii
amyloid units, which are developed into amyloid aggregates, can be another novel approach for halting disease-condition developments. In this thesis, candidate ligand peptides that cease aggregation of huntingtin, α-synuclein and amyloid-β were selected by using different types of display systems, which are bacterial surface display, yeast surface display and phage display. The monomeric amyloid units of these proteins were expressed on surfaces of bacterial cells and yeast cells in order to expressing monomeric units with a proper folding and avoiding aggregation after expression without interacting with each other. Candidate ligand peptides were selected against neurodegenerative amyloids by M13 phage display library. First, M13 phage display library was tried to be produced from using wild type M13 bacteriophage by basic cloning methods as well as commercially available M13 phage display library kit was used for peptide selection since the minor coat protein pIII of M13 is widely used for peptide display and ligand peptide selection studies. Thus, 12 amino acid-long peptides displayed on the minor coat protein pIII were selected against neurodegenerative amyloids for inhibiting protein aggregation purpose in the very first step of aggregation pathway.
Keywords: Amyloid Aggregation, Bacterial Surface Display, Yeast Surface Display, Phage Display Library, Peptide Selection, Biopanning
iii ÖZET
PATOJENİK AMİLOİDLER İÇİN ADAY İLAÇ PEPTİTLERİ
Cemile Elif Özçelik
Malzeme Bilimi ve Nanoteknoloji, Yüksek Lisans Danışman: Urartu Özgür Şafak Şeker
Ocak 2020
Amiloid fibriller oldukça dayanıklı, düzenli karşılıklı-β yapılı, proteaz degradasyonuna dayanıklı proteinli çökeltilerdir. Tüm amiloidler farklı peptit/protein sekanslarına sahip olmalarına rağmen benzer yapısal özellikler gösterirler. Bazı amiloidler koruma, hücre-hücre iletişimi, protein depolama gibi avantajlı işlevsellikler göstermektedir. Buna rağmen, çoğu amiloidler nörodejeneratif hastalıklar gibi çeşitli ciddi hastalıklarla ilişkilendirilmektedirler. Amiloidler benzer oluşma yolağını takip etseler bile patojenik amiloidler oldukça zorludurlar çünkü oluşumları ikincil yolaklarla desteklenmektedir. Şu ana kadar sadece hastalık durumlarınn semptomlarını maskeleyen ya da semptom gelişmelerini yavaşlatan çeşitli terapetik yaklaşımlar bulunmaktadır. Bununla beraber, farklı yaklaşımlar amiloid agregasyonunu inhibe etmek için farklı yaklaşımlar geliştirilmektedir. Günümüzde, çoğu stratejiler henüz tamamen anlaşılmamış olan ikincil nükleasyonu inhibe etmeği amaçlamaktadır. Bu yüzden, bu tarz yaklaşımlar, ikincil nükleasyon kinetiği ve oluşma mekanizması açısından
iv
pek çok zorluklarla karşı karşıya kalmaktadır. Bu nedenle, amiloid agregatlarını oluşturan monomerik amiloid birimlerinin inhibisyonu, hastalık durumu gelişmesinin durdurulması için diğer bir özgül yaklaşım olabilir. Bu tezde, huntingtin, α-sinüklein ve amiloid-β aggregasyonunu durduracak aday ligand peptitler, bakteriyel yüzey gösterimi, maya yüzey gösterimi ve faj gösterimi gibi yüzey gösterim sistemlerinin kullanılmasıyla seçilmişlerdir. Monomerik birimlerin doğru bir şekilde katlanması ve ekspiresyon sonrası agregasyonu, birbirleriyle etkileşmeksizin önlemek için, monomerik amiloid birimler, bakteri ve maya yüzeylerinde ifade edildi. Aday ligand peptitler, M13 faj gösterim kütüphanesi kullanılarak, nörodejeneratif amiloidlere karşı seçildi. İlk olarak, M13 fajının minör kılıf proteini peptit gösterimlerinde ve ligand seçim çalışmalarında yaygın bir şekilde kullanıldığı için, M13 faj gösterim kütüphanesi, temel klonlama metodları kullanılarak, doğal fenotipli M13 bakteriyofajından üretilmeye çalışılmasının yanı sıra, ticari olarak uygun olan M13 faj gösterim kütüphanesi kiti peptit seçimi için kullanılmıştır. Sonuç olarak, protein agregasyonunu, agregasyon yolağının en başında inhibe edilmesi için, minör kılıf proteininde gösterimi yapılan 12-amino asit uzunluğundaki peptiler, nörodejeneratif amiloid proteinlerine karşı seçilmişlerdir/
Anahtar Kelimeler: Amiloid Agragasyonu, Bakteriyel Yüzey Gösterimi, Maya Yüzey Gösterimi, Faj Gösterim Kütüphanesi, Peptit Seçimi, Biopanning
v
Acknowledgements
During my 3 years-long master education, I learnt, experienced ans saw lots of things. Most of the time, I faced with many problems in my project. In such times,
I would like to thank everyone who was with me and supported me at these times. Especially I want to thank my advisor Urartu Özgür Şafak Şeker for opening the door for me to the only lab group I want to be for my master education, was always guiding me and keeping my motivation in high level . Also I am thankful to my jury members, Serap Dökmeci and Fatih İnci.
I feel very luck to be a member in SBL group since being the same working environment with valuable and knowledgeable people has improved me during this 3 years. So, I would like to thank all SBL members, specifically to Ebru Şahin Kehribar. It was a great opportunity for me to work on the project she involved.I would also like to thak to our former lab member Özge Beğli to inducing yeast and sharing the same feelings and fate for our project time to time. Besides, I thank to Nedim Hacıosmanoğlu for inducing yeast cells, helping me modelling and sending me funny videos and memes which cheer me up all the time I received them. Although she is the newest lab member, I would like to thank Anooshay Khan for helping me in the lab during my thesis writing period. Also, I thank to Eray Ulaş Bozkurt for sharing his taste of music with me. Besides, I would like to thank to rest of the SBL members who are Sıla Köse, Julian Ostaku, Çisil Kçksaldı, Gökçe Özkul, Zafer Koşar, Merve Yavuz, Merve Erden and Murat Güngen.
vi
I am also very glad to meet precious people and find my lifelong friends during my master. I would like to thank Onur Rojhat Karasu, Recep Erdem Ahan, Behide Saltepe and Büşra Merve Kırpat for their endless support and friendship. Especially I would like to thank Onur for being such a wonderful person and making me feel well everytime I am with him, Recep for his patience and sharing meals, Behide for endless and deep conversations by whispering, Büşra Merve for sharing coffee and support when I was down. Also I thank to Melis Akdoğan Gün who always supported me, even if she is far away.
Finally, I would like to thank my all family members who support me at every moment of my life and show me the way every time I feel lost. Specifically, I would like to thank my father Ertuğrul for his guidance and support whenever I had a question mark in my head, my mother Menevşe for being a perfect role model with her strong character, my sister Fulya for making me forget all my problems, my brother-in-law Vahit for making me questioning of my future, and my little angel Bade. Besides, I would like to thank to Menekşe ve Mert Taşçılar. Whenever my life was boring and I miss my family, they made me feel I’m home when I’m with them.
This project was supported financially by TUBİTAK with project number 216S127.
vii
Table of Contents
TABLE OF CONTENTS ... Vİİ
CHAPTER 1 ... 1
INTRODUCTION... 1
1.1. The Toxicity of Amyloids ... 7
1.2. Association of Amyloids with Alzheimer’s Disease ... 7
1.3. Association of Amyloids with Parkinson’s Disease ... 9
1.4. Association of Amyloids with Huntington’s Disease ... 10
1.5. Therapeutic Strategies for Amyloid-Associated Pathogenicity... 10
1.6. Ligand Peptide Selection by Phage Display Library for Drug Discovery... 12
1.7. The Aim of Study ... 13
CHAPTER 2 ... 15
MATERIALS AND METHODS ... 15
2.1. Bacterial and Yeast Cell Strains, M13 Bacteriophage, Cell Maintenance and Growth Conditions ... 15
2.2. Chemical Transformation of Bacterial Cells ... 17
2.3. Electrocompetent Cell Preparation and Electroporation of Bacterial Cells 18 2.4. Construction of Plasmid Vectors ... 20 2.5. Plasmid Isolation, Sanger Sequencing and Sequencing Alignments 23
viii
2.6. Construction of Combinatorial M13 Phage Display Library by PCR 26
2.7. Commercially Available Phage Display Library Propagation ... 29
2.8. ESEM Sample Preparation ... 31
2.9. Protein Expression of Bacterial Surface Displayed Proteins and Characterization ... 31
2.10. Protein Expression of Yeast Surface Displayed Proteins by Galactose Induction ... 33
2.11. Biopanning Against Yeast Expressing Neurodegenerative Proteins on the Surface and Bacterial Surface Display System, Phage Amplification and Phage Titering ... 34
2.12. M13 Single Plaque Amplification ... 36
2.13. Protein Modelling for Prediction of Possible Peptide-Protein Interaction ... 37
2.14. ELISA for Selected Phages Against Yeast Cells Expressing Neurodegenerative Proteins ... 38
CHAPTER 3 ... 40
RESULTS AND DISCUSSION ... 40
3.1. Construction of pETcon-Aga2-NDP-sfGFP ... 40
3.2. Neurodegenerative Protein Display by Using Bacterial Surface Display Vector ... 42
3.2.1. Cloning of 25Q-Htt into pET22b-pelB-Ag43-160N Vector ... 43
3.2.2. Cloning of α-synuclein into pET22b-pelB-Ag43-160N Vector ... 45
ix
3.2.4. Surface Displayed 25Q-Htt, α-Synuclein and Amyloid β40 with Heat
Shock ... 49
3.3. Construction of Combinatorial M13 Phage Display Library by PCR and Biopanning against E.coli Expressing Neurodegenerative Amyloids as a Fusion of Autotransporter Ag43 ... 53
3.4. Construction of Combinatorial M13 Phage Display Library by Oligonucleotide Insertion... 58
3.5. Biopanning against Neurodegenerative Proteins to Select Inhibitory Ligand Peptides with Yeast Surface Display Systems and Phage Display Technology ... 63
3.6. Modelling of NDPs, Candidate Ligand Peptides and Docking Predictions ... 76
3.7. Determination of Phage Interaction with α-Synuclein Expressed on Yeast Surface by ELISA ... 85
CHAPTER 4 ... 91
CONCLUSIONS ... 91
BIBLIOGRAPHY ... 92
APPENDIX A ... 101
DNA and selected peptide sequences mentioned in this study ... 101
APPENDIX B... 111
List of primers used in this study ... 111
APPENDIX C... 114
Plasmid maps used in this study ... 114
x
Sanger sequencing results for clonings done in this study ... 125 APPENDIX E ... 150 Additional reaction recipes and methods ... 150
xi
List of Figures
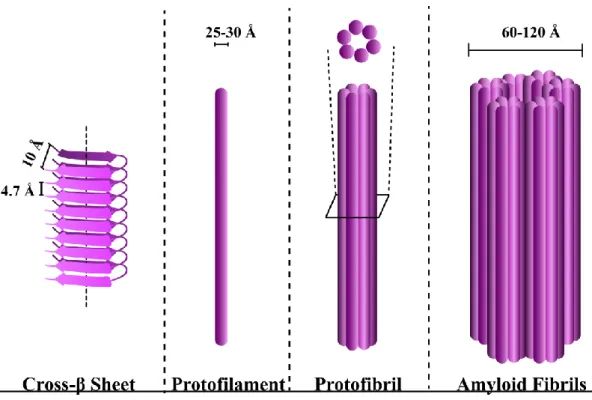
Figure 1: Structures of cross-β sheet, protofilament, protofibril and amyloid fibrils. ... 4
Figure 2: Aggregation phases and amyloid fibril formation mechanism ... 5
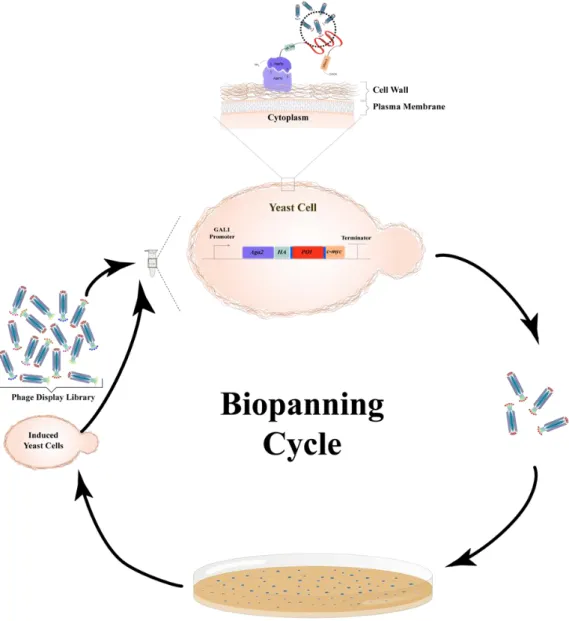
Figure 3: The inhibitory peptide selection by using phage display library and yeast surface display system... 14
Figure 4: sfGFP PCR product on 1% agarose gel. The lanes were loaded with sfGFP gene amplified by primers for cloning into pETcon_Aga2_25Q-Htt, pETcon-Aga2-46Q-Htt, pETcon-Aga2-103Q-Htt, pETcon-Aga2-Amyloid β40, pETcon-Aga2-Amyloid β42 and pETcon-Aga2-α-synuclein respectively. ... 41
Figure 5: BamHI digestion reactions image. The lane was loaded with digested pETcon vector oh which 25Q-Htt, 46Q-Htt, 103Q-Htt, Amyloid β40, Amyloid β42, α-synuclein genes expressed respectively. ... 41
Figure 6: The structure of Ag43 autotransporter-dependent bacterial surface display system ... 43
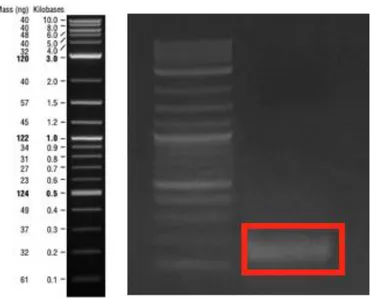
Figure 7: Digestion result of pET22b-pelB-6H-Ag43-160N-sfGFP vector. The backbone was indicated with red rectangle. The expected band size is 7413 bp. The band at the middle of the lane is sfGFP which is 773 bp long after digestion and the band at the bottom is digested part of α-subunit which is 508 bp long after digestion. ... 43
xii
Figure 8: PCR product of β-subunit_160N α-subunit fragment which was amplified by Gibson assembly primers. The expected band size was 2545 bp-long. ... 44
Figure 9: PCR product of 25Q-Htt fragment which was amplified by Gibson assembly primers. The expected band size was 333 bp-long... 44
Figure 10: Digestion reaction results of pET22b-pelB-Ag43-160N-25Q-Htt. ... 45
Figure 11: Digestion reaction results of pET22b-pelB-Ag43-160N-25Q-Htt. The backbone was expected with a size of 7935 bp-long and 25Q-Htt was expected with a size of 294 bp-long. 25Q-Htt band was not obvious in the image since agarose gel was poured as 1%. Thus, small-sized 25Q-Htt was diffused through the gel. ... 46
Figure 12: PCR product of α-synuclein fragment which was amplified by Gibson assembly primers. The expected band size was 512 bp-long... 46
Figure 13: Digestion reaction results of pET22b-pelB-Ag43-160N- α-synuclein. The backbone was expected with a size of 7935 bp-long and α-synuclein was expected with a size of 438 bp-long. ... 47
Figure 14: Digestion reaction results of pET22b-pelB-Ag43-160N-25Q-Htt. The backbone was expected with a size of 7935 bp-long and 25Q-Htt was expected with a size of 294 bp-long. 25Q-Htt band was not obvious in the image since agarose gel was poured as 1%. Thus, small-sized 25Q-Htt was diffused through the gel. ... 48
xiii
Figure 15: PCR product of amyloid β40 fragment which was amplified by Gibson assembly primers. The expected band size was 220 bp-long... 48
Figure 16: Digestion reaction results of pET22b-pelB-Ag43-160N-Amyloid β40. The backbone was expected with a size of 7935 bp-long and amyloid β40 was expected with a size of 141 bp-long. ... 49
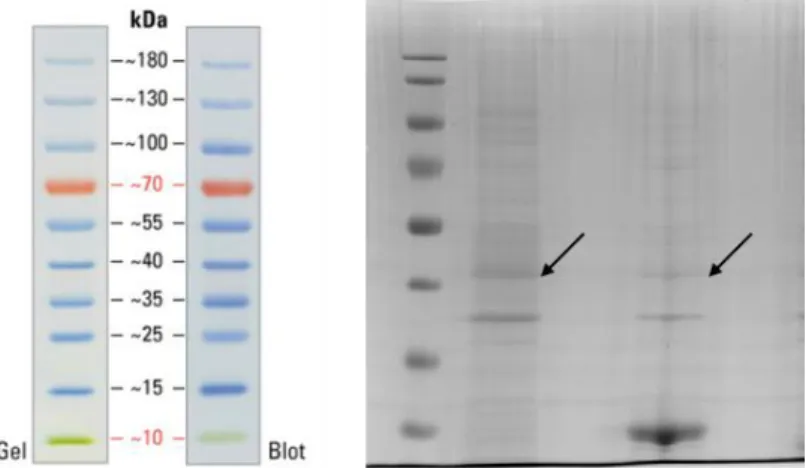
Figure 17: SDS-PAGE gel image result of BL21 cells expressing 25Q-Htt on surface with fusion of Ag43 autotransporter. First indicated band was from heat release-applied sample, second indicated band was from heat release-applied sample which was precipitated with acetone. Third and fourt lanes were loaded with controls prepared with empty BL21 cells by applying same preparation steps for the first sample and the second sample respectively. The expected size was 42 kDa. ... 50
Figure 18: SDS-PAGE gel image result of BL21 cells expressing α-synuclein on surface with fusion of Ag43 autotransporter. First indicated band was from heat release-applied sample which was precipitated with acetone, second indicated band at third lane was from heat release-applied sample. Second and fourt lanes were loaded with controls prepared with empty BL21 cells by applying same preparation steps for the first sample and the second sample respectively. The expected size was 45 kDa.. ... 51
Figure 19: SDS-PAGE gel image result of BL21 cells expressing amyloid-β40 on surface with fusion of Ag43 autotransporter. First indicated band was from heat release-applied sample which was precipitated with acetone, second indicated band was from heat release-applied sample. Third and fourt lanes were loaded
xiv
with controls prepared with empty BL21 cells by applying same preparation steps for the first sample and the second sample respectively. The expected band size was 38 kDa. ... 52
Figure 20: The structure of M13-pIII display system ... 54
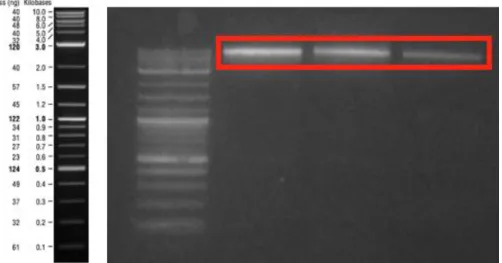
Figure 21: PCR product of M13 genome which was amplified by Gibson assembly primers. The expected band size was 7317 bp-long... 54
Figure 22: Digestion reaction results of M13 genome PCR product. The expected size was 7282 bp-long ... 55
Figure 23: PCR product of M13 genome. The expected band size was 7317 bp-long. ... 55
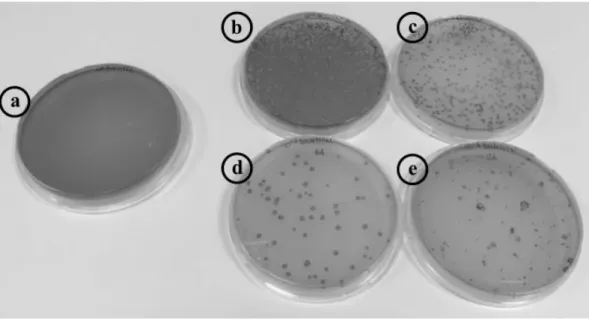
Figure 24: The tittering plates with different dilution factors for determination of library size. a) Phage tittering plate with a dilution factor of 10-2. There were lots of blue plaques that formed smear. b) Phage tittering plate with a dilution factor of 10-3. There were lots of blue plaques that were not countable. ) Phage tittering plate with a dilution factor of 10-4. There were more than 300 blue plaques that were not appropriate for determining phage amount. d) Phage tittering plate with a dilution factor of 10-5. There were 64 blue plaques which was relatable with plate c. e) Phage tittering plate with a dilution factor of 10-6. There were 124 blue plaques that were more than expected. ... 56
Figure 25: PCR product of M13 genome. The expected band size was 7317 bp-long. ... 57
xv
Figure 26: ESEM image of M13 bacteriophages. ... 57
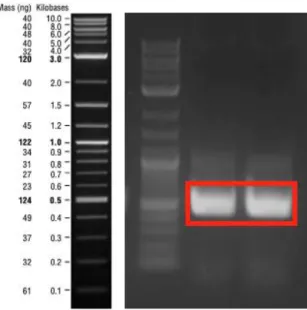
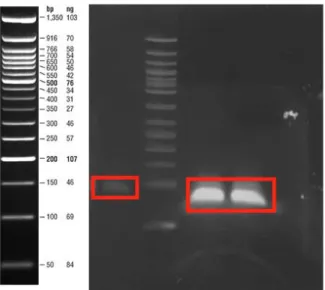
Figure 27: Klenow reaction product and KpnI-digested ds-oligonucleotide. The first lane was Klenow reaction product that is 89 bp-long. The 3rd and 4th lanes were loaded with digestion reaction product that was 72 bp-long. ... 59
Figure 28: Klenow reaction product and KpnI and EagI digested ds-oligonucleotide. The first lane was Klenow reaction product that is 89 bp-long. The 3rd, 4th and 5th lanes were loaded with digestion reaction product that was 55 bp-long. ... 60
Figure 29: PCR product of M13 genome. The expected band size was 7300 bp-long. ... 61
Figure 30: Digestion reaction results of M13 genome PCR product. The expected size was 7227 bp-long. ... 61
Figure 31: PCR product of M13 pIII. The expected band size was 173 bp-long.. 62
Figure 32: Phage ratio calculations and enrichment ration results from biopanning of 25Q-Htt. A) Ratio calculations obtained from ‘output phage (pfu)/ input phage (pfu)’ of 25Q-Htt biopanning results. B) Table for input phage amount, output phage amount, ratio and enrichment ratio obtained from 25Q-Htt biopanning. ... 65
Figure 33: Phage ratio calculations and enrichment ration results from biopanning of 46-Htt. A) Ratio calculations obtained from ‘output phage (pfu)/ input phage (pfu)’ of 46Q-Htt biopanning results. B) Table for input phage amount, output phage amount, ratio and enrichment ratio obtained from 46Q-Htt biopanning. ... 66
xvi
Figure 34: Phage ratio calculations and enrichment ration results from biopanning of 103-Htt. A) Ratio calculations obtained from ‘output phage (pfu)/ input phage (pfu)’ of 103Q-Htt biopanning results. B) Table for input phage amount, output phage amount, ratio and enrichment ratio obtained from 103Q-Htt biopanning. . 67
Figure 35: Phage ratio calculations and enrichment ration results from biopanning of amyloid-β40. A) Ratio calculations obtained from ‘output phage (pfu)/ input phage (pfu)’ of amyloid-β40 biopanning results. B) Table for input phage amount, output phage amount, ratio and enrichment ratio obtained from amyloid-β40 biopanning. ... 68
Figure 36: Phage ratio calculations and enrichment ration results from biopanning of amyloid-β42. A) Ratio calculations obtained from ‘output phage (pfu)/ input phage (pfu)’ of amyloid-β42 biopanning results. B) Table for input phage amount, output phage amount, ratio and enrichment ratio obtained from amyloid-β42 biopanning. ... 69
Figure 37: Phage ratio calculations and enrichment ration results from biopanning of amyloid-β40X2. A) Ratio calculations obtained from ‘output phage (pfu)/ input phage (pfu)’ of amyloid-β40X2 biopanning results. B) Table for input phage amount, output phage amount, ratio and enrichment ratio obtained from amyloid-β40X2 biopanning. ... 70
Figure 38: Phage ratio calculations and enrichment ration results from biopanning of α-synuclein. A) Ratio calculations obtained from ‘output phage (pfu)/ input phage (pfu)’ of α-synuclein biopanning results. B) Table for input phage amount,
xvii
output phage amount, ratio and enrichment ratio obtained from α-synuclein biopanning. ... 71
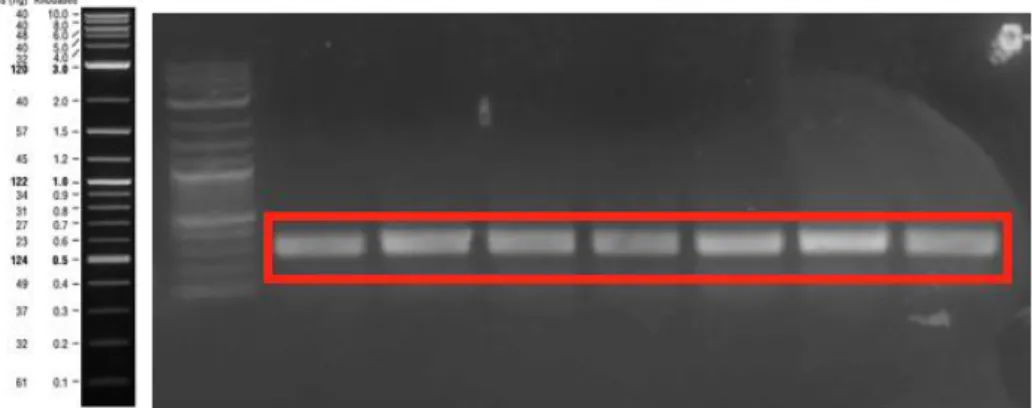
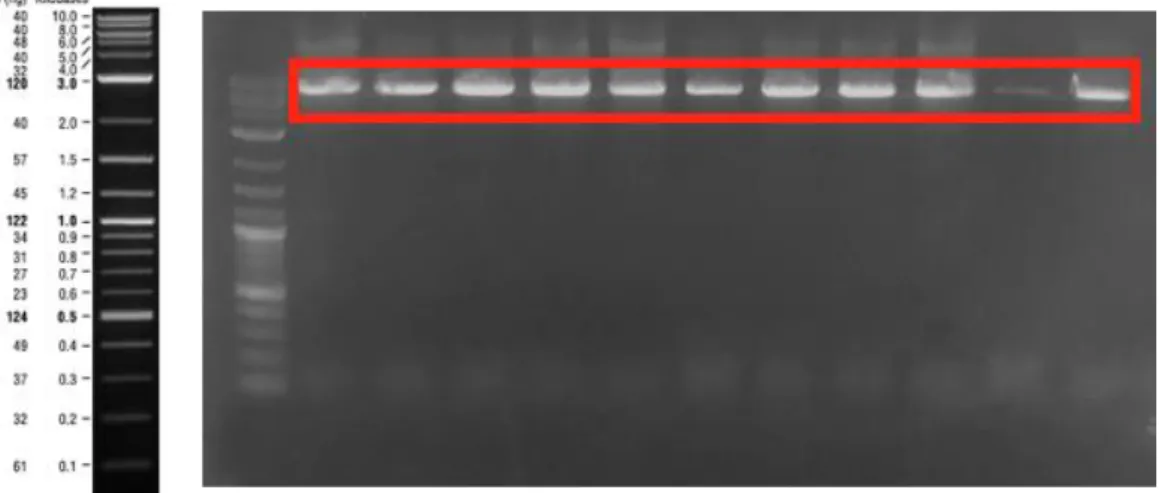
Figure 39: PCR product of M13 pIII genes that were obtained from biopanning of 25Q-Htt for sequencing. The expected size was 433 bp. 10 different samples were loaded and each sample gave same result. The other unexpected bands were originated from unspecific amplification of a region on M13 genome or gemone of remaining ER2738. ... 73
Figure 40: PCR product of M13 pIII genes that were obtained from biopanning of 46Q-Htt for sequencing. The expected size was 433 bp. 10 different samples were loaded and each sample gave same result. The other unexpected bands were originated from unspecific amplification of a region on M13 genome or gemone of remaining ER2738. ... 73
Figure 41: PCR product of M13 pIII genes that were obtained from biopanning of 103Q-Htt for sequencing. The expected size was 433 bp. 10 different samples were loaded and each sample gave same result. The other unexpected bands were originated from unspecific amplification of a region on M13 genome or gemone of remaining ER2738. ... 74
Figure 42: PCR product of M13 pIII genes that were obtained from biopanning of amyloid-β40 for sequencing. The expected size was 433 bp. 10 different samples were loaded and each sample gave same result. The other unexpected bands were originated from unspecific amplification of a region on M13 genome or gemone of remaining ER2738. ... 74
xviii
Figure 43: PCR product of M13 pIII genes that were obtained from biopanning of amyloid-β42 for sequencing. The expected size was 433 bp. !0 different samples were loaded and each sample gave same result. The other unexpected bands were originated from unspecific amplification of a region on M13 genome or gemone of remaining ER2738. ... 75
Figure 44: PCR product of M13 pIII genes that were obtained from biopanning of amyloid-β40X2 for sequencing. The expected size was 433 bp. 10 different samples were loaded and each sample gave same result. The other unexpected bands were originated from unspecific amplification of a region on M13 genome or gemone of remaining ER2738. ... 75
Figure 45: Prediction of docking 25Q-Htt-bound peptide and common peptide on 25Q-Htt. The blue region on the model represents Aga2, and green region on the model represents 25Q-Htt. The peptide is indicated with red color and black boxes. ... 78
Figure 46: Prediction of docking 46Q-Htt-bound peptides and common peptide on 46Q-Htt. The blue region on the model represents Aga2, and green region on the model represents 46Q-Htt. The peptide is indicated with red color and black boxes. ... 79
Figure 47: Prediction of docking 103Q-Htt-bound peptide and common peptide on 103Q-Htt. The blue region on the model represents Aga2, and green region on the model represents 103Q-Htt. The peptide is indicated with red color and black boxes. ... 80
xix
Figure 48: Prediction of docking amyloid-β40-bound peptide and common peptide on amyloid-β40. The blue region on the model represents Aga2, and yellow region on the model represents amyloid-β40. The peptide is indicated with red color and black boxes. ... 81
Figure 49: Prediction of docking amyloid-β42-bound peptides and common peptide on amyloid-β42. The blue region on the model represents Aga2, and cyan region on the model represents amyloid-β42. The peptide is indicated with red color and black boxes. ... 82
Figure 50: Prediction of docking amyloid-β40X2-bound peptide and common peptide on amyloid-β40X2. The blue region on the model represents Aga2, and orange region on the model represents amyloid-β40X2. The peptide is indicated with red color and black boxes... 83
Figure 51: Prediction of docking common peptide on α-synuclein. The blue region on the model represents Aga2, and purple region on the model represents α-synuclein. The peptide is indicated with red color and black boxes. ... 84 Figure 52: ELISA for detection of M13 phages eluted from α-synuclein biopanning against α-synuclein-expressing yeast cells. According to data, some of the phages were interacted with α-synuclein showinh high interaction efficiency. ... 86
Figure 53: ELISA of empty pETcon-expressing yeast cells by using α-synuclein-bound phages. ... 87
xx
Figure 54: ELISA of α-synuclein and empty pETcon-expressing yeast cells by using α-synuclein-bound phages. ... 89
Figure C1: Plasmid map representation of pETcon_Aga2_25Q-Htt_sfGFP vector...114
Figure C2: Plasmid map representation of pETcon_Aga2_46Q-Htt_sfGFP vector ... 115 Figure C3: Plasmid map representation of pETcon_Aga2_103Q-Htt_sfGFP vector ... 116 Figure C4: Plasmid map representation of pETcon_Aga2_ Amyloid-β40_sfGFP vector ... 117 Figure C5: Plasmid map representation of pETcon_Aga2_ Amyloid-β40X2_sfGFP vector ... 118 Figure C6: Plasmid map representation of pETcon_Aga2_ Amyloid-β42_sfGFP vector ... 119 Figure C7: Plasmid map representation of pETcon_Aga2_ α-Synuclein_sfGFP vector ... 120 Figure C8: Plasmid map representation of pET22b_Ag45_160N_25Q-Htt vector ... 121 Figure C9: Plasmid map representation of pET22b_Ag45_160N_ Amyloid-β40 vector ... 122 Figure C.10: Plasmid map representation of pET22b_Ag45_160N_ α-Synuclein vector ... 123 Figure C.11: Plasmid map representation of ss-M13 genome Displaying Peptides on gIII ... 124 Figure D.1: Sequencing result of sfGFP from pETcon_25Q-Htt_sfGFP...127
Figure D.2: Sequencing result of sfGFP from pETcon_46Q-Htt_sfGFP ... 130
xxi
Figure D.4: Sequencing result of sfGFP from pETcon_Amyloid-β40_sfGFP .... 135
Figure D.5: Sequencing result of sfGFP from pETcon_ Amyloid-β42_sfGFP ... 140
Figure D.6: Sequencing result of sfGFP from pETcon_α-synuclein_sfGFP ... 143
Figure D.7: Sequencing result of 25Q-Htt from pET22b_Ag43_160N_ 25Q-Htt ... 144 Figure D.8: Sequencing result of β-subunit and α-subunit from pET22b_Ag43_160N_25Q-Htt vector ... 147
Figure D.9: Sequencing result synuclein from pET22b_Ag43_160N_ α-synuclein ... 148
Figure D.9: Sequencing result Amyloid-β40 from pET22b_Ag43_160N_ Amyloid-β40 ... 149
xxii
List of Tables
Table A.1: DNA sequences of genes and fragments used in this study ... 101
Table A.2: Selected peptide sequences and their translations... 110
Table B.1: PCR primers mentioned in materials and methods section... 111 Table E.1: LB growth medium, LB agar and top agar medium recipes ...150
Table E.2: SOC growth medium recipe ... 150
Table E.3: Selective yeast growth medium recipe ... 151
Table E.4: Selective yeast induction medium recipe ... 151
Table E.5: Single restriction enzyme digestion reaction recipe ... 151
Table E.6: Double restriction enzymes digestion reaction recipe ... 152
Table E.7: Q5 polymerase PCR recipe ... 152
Table E.8: Q5 polymerase PCR conditions... 152
Table E.9: Pfu polymerase PCR recipe ... 153
Table E.10: Pfu polymerase PCR conditions ... 153
Table E.11: Gibson assembly reaction recipe ... 153
xxiii
Table E.13: ss-Oligonucleotide annealing recipe for Klenow fragment amplification ... 154
Table E.14: Klenow fragment amplification reaction recipe ... 154
1
CHAPTER 1
INTRODUCTION
About 400 years ago, amyloids were termed at the first time and amiloids have always attracted the attention of researchers [1]. Although amyloids are emphasized with their functional roles observed in diverse organisms such as bacteria, fungi, insects, silkmoths and even mammalian cells lately, amyloid fibrils are mostly related with numerous conditions that decrease life quality and mostly cause cell death [2].
Up to now, there are about 50 different proteins and peptides that are stated as amyloid forming units associated with life threating diseases [3]. These diseases can be neurodegenerative as observed in Alzheimer’s disease, Parkinson’s disease and dementia and Huntington’s disease, or non-neuropathic amyloidosis such as Type II diabetes. Although most of the diseases related with amyloidosis are caused by different type of amyloid proteins or peptides, they all exhibit similar structural properties and identified by primarily with the amyloid aggregation as proteinaceous plaques in tissues [4-7].
All amyloid fibrils are self-assembled, stabilized with low free energy and express highly ordered structures by forming cross-ß structure as well as having resemblance in interaction with ThT and Congo Red dye which are commonly used as an amyloid indicator[8-10]. Likewise, in order to determine the amyloid fibril structure, first x-ray diffraction analysis was applied in early research of
2
amyloid structures. As a result of X-ray diffraction analysis, all amyloid fibrils are composed of a core structure made up with the amyloid-forming peptides or proteins in ß-strand conformation. These ß-strands interact with each other via hydrogen bonds between carbonyl and amide group of the neighboring amyloid forming peptide or protein, that are parallel to the fiber axis with 4.7–4.8 Å [11, 12]. In the prefibrillar structure, ß-sheets are positioned parallel to each other owe a distance of 6–12 Å [13]. This structural pattern later was confirmed and detailed by different techniques like electron and atomic force microscopy with a detection of length, width and architecture of the fibril, Fourier transform infrared spectroscopy and circular dichorism by investigating secondary structure with different principles, point mutations and using conjugated probes by determining the region affecting amyloid fibril formation, hydrogen-deuterium exchange by studying ß-sheet structure, X-ray crystallography by using crystallized short peptides to get more detailed amyloid structure, solid-state nuclear magnetic resonance by determining orientation of the ß-sheet structure, and cryoelectron microscopy by secondary structure investigation of a single amyloid particle without a necessity to use of crystallized structure of amyloid or isotope-labelling [14-23]. Hence, applications of different techniques enlighten the basic amyloid structures [24]. Still, different approaches proved that the amyloid fibrils are very complicated with a varied assembly combinations as a result of the differences in the amyloid-forming peptide or protein sequences the existence of numerous small precursors, diversity in condition parameters like salt concentrations, pH, temperature and also rate constants of the fibril formation [1].
3
One of these is oligomers which represents the aggregated unit composed of two or more monomeric units of amyloid forming peptide or protein with having low growth rate and different structures than a fibril [25, 26]. The other one is critical nucleus, which is the smallest aggregation unit [27]. Critical nucleus occupies high Gibbs free energy that undergoes fast monomer addition than the dissociation to monomeric units [25, 27]. Fibrillar oligomers are used for oligomers having fibrillar structure with a shorter length than a fibrillar structure [25]. For the fibrillar structures, protofilament is a description of the fibril-like structure with a composition of monomers having intermolecular electrostatic interactions lie parallel to the fibril axis [28]. The transient state of twisting two or three protofilaments forms protofibril that act as kinetic precursor for amyloid fibril formation [29]. The amyloid fibril is the final product of the amyloid formation mechanism, that composed of three or more twisting protofilament to each other resulted in higher level of fibrillar structure with 60-120 Å in cross-section dimension, varying the length and unbranching structure (Figure 1). The mature amyloid fibrils are stabilized by dipolar interactions between each protofibrillar structure and van der Waals interactions between monomeric amyloid units, making fibrils more stiff as in like steel and stabilized more via hydrophobic interactions and hydrogen bonds formed between side-chains [30-32].
All amyloid fibrils, especially the ones associated with different disease conditions, shares a ß-sheet structure and closer dimensions, although they express diverse arrangements of protofibrils, in other words, they owe differences in the assembly of protofilaments, even for a single type of amyloid fibrils formed
4 in the same environment [1].
Figure 1: Structures of cross-β sheet, protofilament, protofibril and amyloid fibrils.
These diversifications in protofilament assembly of same amyloid fibrils are the phenomenon known as polymorphism [25, 31]. Amyloid polymorphs are formed for a one type of amyloid fibrils regardless of the amino acid sequence of the amyloid forming peptide or protein by variation of the orientation in the same environment although concentration of the most stable amyloid polymorph increases during amyloid formation since less stable polymorphs lose their amyloid fibril structure by dissociation [25, 31]. This phenomenon makes disease-related amyloid formation studies more complex. Also, conditions of growth environments affect the pathways of amyloid fibril formation, stability of intermediates and assemblies. However, amyloid fibril formation mechanism can
5
be divided into lag phase, elongation phase and stationary (plateau) phase even if amyloid fibril formation is a dynamic event and cannot be distinctly separated to a single molecular process[32, 33] .In other words, all molecular events show a continuous activity during the whole fibril formation process (Figure 2).
Figure 2: Aggregation phases and amyloid fibril formation mechanism
During the lag phase, primary nucleation and elongation of fibrils and sometimes these events are supported by secondary nucleation and fragmentation events take place, while in the elongation phase, heterogeneous and transient protofibrils are arranged and assembled into mature amyloid fibrils and plaques that are obtained in the stationary phase [33]. In the consideration of lag phase, the amyloid precursor molecule transforms from soluble state to insoluble-aggregating template in the primary nucleation step. Unfolded or misfolded peptides or proteins and also rarely native proteins have a role in the formation of the very first oligomers, which are not persistent and not defined in terms of structural geometry. These oligomers are then involved in amyloid assembly by following
6
on-pathway fibril formation or they sometimes assembled into proteinaceous complexes that are not formed as fibrils but still they posses a cytotoxicity [1].During oligomerization, a oligomer with high free energy, which is called as critical nucleus, undergoes polymerization fast int order to form amyloid fibril. To do so, precursor oligomers changes their initial assembly structure by organizing secondary structure with ß-strands to form preliminary fibrillar structure in a slow transition event, regardless of the initial structural state [34]. Then, addition of monomers to the free and growing ends of the preliminary amyloid-forming assemblies takes place with a rapid growth, which is happened in elongation phase. The elongation phase is followed by the stationary phase n which complete amyloid fibrils are formed with a lowest free energy, highest stability and insolubility [33].
Also, there are secondary processes that feed the whole pathway in order to form amyloid fibrils. One of these processes is the secondary nucleation which is occurred by autocatalysis of sides of pre-fibrillar assemblies to create new amyloid nuclei, and the other one is fragmentation in which small fragments are created by break off the end of the mature amyloid fibrils to produce fibrillar oligomeric structures [30].
As a whole, the duration of the lag phase is mainly dependent on the formation of amyloid nuclei while the sharp growth observed in elongation phase is affected mainly by the secondary processes [34]. In addition to this, the secondary processes have a high impact on the toxicity and pathogenic effect on the disease conditions such as observed in Alzheimer’s disease, Parkinson’s disease and Huntington’s disease [34].
7
1.1.
The Toxicity of Amyloids
Pathogenicity of amyloids is the most challenging and complicated problem because of the differences in growth conditions, polymorphism, genetic factors and mutations, age, and complex fibril formation mechanism [1].
Each disease related with amyloid formation is originated from the assembly of different types of peptides or proteins. Therefore, the origin of the toxicity of amyloid aggregations and dysfunctionality of the cells producing amyloid aggregates have not been answered clearly, but there are some evidences that oligomeric units of the aggregating amyloid fibrils have high impact on pathogenicity [34]. Besides, it is observed that there is an interaction between amyloid-related diseases as well as non-amyloid diseases affecting the development of amyloid-related disease conditions [1]. For instance, Azheimer’s disease condition can be triggered with a high chance in patients having type II diabetes [1], as well as α-synuclein deposition can be observed in the plaques occurred in Alzheimer’s disease patients. Also, Parkinson’s disease occurrence ratio is relatively high in Gaucher disease patients because of the genetic factor influences [35].
1.2.
Association of Amyloids with Alzheimer’s Disease
Alzheimer’s disease (AD) is the most challenging, progressive and common neurodegenerative disorder that is occurred among population of >65 years old people with a prevalence of 10-30% having a frequency of 1-3% [36]. AD
8
patients suffer from cognitive decline and irreversible memory loss [37] due to accumulation of amyloid-β plaques in blood vessels and extracellular environments [36, 37]. This then resulted in increased level of phosphorylation of microtubule-associated tau proteins and hyper-phosphorylated tau proteins form insoluble fibrillous aggregates in neuronal cells [36, 37]. Such aggregates cause synaptic dysfunctioning in early stages in AD, which is followed by loss of synaptic interaction then neuronal death leading dementia [37, 38]. This coupled of events is called as amyloid cascade hypothesis [39].
Alzheimer’s disease is dependent on amyloid-β clearance in brain cells [40]. Overproduction of amyloid-β and low efficiency in clearance lead to neurodegeneration cascade in patients [41]. The aggregative amyloid-β production is associated with processing of amyloid precursor protein (APP), which is a type, I tarnsmembrane protein expressed from APP gene on chromosome 11 [41]. In normal procession of APP, α-secretase enzyme cleaves at amyloid-β sequence into APPsα. The membrane embedded, remaining part of amyloid-β as well as APPsα is further cleaved by ɣ-secretase to form short peptides called p3 [42]. When the mutations occurred on APP, PS1 and PS2 (genes expressing presenilin 1 and presenilin 2 respectively and these are catalytic subunits of ɣ-secretase) are resulted in overproduction of neurodegenerative amyloid- β proteins. by following different APP processing pathway [41,43]. In this pathway, β-secretase cleaves APP at a position of amyloid-β1, then ɣ-secretase cleaves the amyloid-β at position of 40 in periphery and at position of 42 in brain, which is developed into senile amyloid-β plaques [40].
9
1.3.
Association of Amyloids with Parkinson’s Disease
The second most common neurodegenerative disorder is Parkinson’s disease in which symptoms are observed as physically and neuropsychiatrically [44]. The physical symptoms are bradykinesia, hypokinesia, akineasia, hypomimia, hyposmia, hypophonia, drooling, micrograpkia as well as loosing postural reflexes and obesity [45, 48]. For neuropsychiatrical symptoms, decrease in cognitive functioning, depression, and sleep disorders may be given [44]. These symptoms are caused by loss of dopaminergic neurons [46]. This loss of functioning is caused by existence of Lewy bodies whose main component is α-synuclein [46]. α-synuclein is a presynaptic protein and its function is not completely understood. Still, it is thought that synaptic vesicles trafficking and neurotransmitter exocytosis is regulated by α-synuclein [47]. 140 amino acid-long α-synuclein is translated from SNCA gene. 1-60 amino acid residue region of α-synuclein is amphipathic region in which A30P, E46K, H50Q, G51D,A53E and A53T mutations leads to aggregation of α-synuclein [48]. 61-94 amino acid residue region of α-synuclein is called as non-amyloid-β component (NAC) domain that is highly hydrophobic region and formed in β-sheet structure as occurred in amyloid fibrillization [48]. 95-140 amino acid residue region is acidic tail which owe high solubility property [48]. The aggregation of α-synuclein is occurred on presynaptic regions, and this accumulation leads to dysfunctioning, then connection loss between neurons [48].
10
1.4.
Association of Amyloids with Huntington’s
Disease
Huntington’s disease (HD) is the most common inherited neurodegenerative disease occurred by high number of CAG trinucleotide (translated in glutamine amino acid) repeat in IT15 gene, which is called also HTT, located on chromosome 4 [49, 52]. The symptoms of HD are associated with motor dysfunctioning with uncontrolled movement, cognitive and psychiatric problems as well as chorea and dementia [50, 51]. The function of huntingtin protein with 7 to 36 glutamine repeat is not developed in aggregate form and functions in development although the specific role of huntingtin is still not known [53]. Huntingtin protein with more than 36 glutamine repeat with a gain-of-function mutation forms amyloid aggregated which leads to development of the disease condition with progressive neuronal loss [54]. The development of disease condition is dependent to the length of CAG repeat on HTT gene instead of polyglutamine length, which is shown recently [54]. Thus, increase in CAG repeat leads to early development of HD. Also, 10-15 years of onset of HD is concluded to death of patients.
1.5.
Therapeutic Strategies for Amyloid-Associated
Pathogenicity
The reason of formation of amyloid aggregation is different for all neurodegenerative diseases although amyloid formation pathway is similar for
11
all. Besides, underlying mechanisms of pathogenic amyloid formation is unclear. Also, the current developed drugs are just masking the symptoms instead of halting the aggregation. Today, researchers are focused on inhibition of amyloid aggregation at different stages of formation with different strategies [34]. One of the strategy is focused on stabilization of amyloid fibrils and inhibiting secondary pathway products by amyloid remodeling [55]. One example for amyloid remodeling is that epigallocatechin-3-gallate (EGCG) compound is shown that it can decrease synuclein oligomer toxicity as well as remodel by binding to α-synuclein aggregates leading producing non-toxic oligomers instead of toxic oligomers in vitro [55]. Thus such approach is promising for amyloid toxicity inhibition. Another strategy is immunization of amyloids by binding of antibodies to them in order to clear monomeric units. However, studies depending on amyloid immunization failed at each clinical trial with expressing adverse effects [55]. This might be caused by removal of monomeric amyloids since monomeric amyloids may possess functional role as well as disturbance in protein concentration that may trigger secondary pathways [1, 34].
Still, the studies continue to inhibit amyloid formation by targeting monomeric units, secondary nucleation or amyloid aggregate itself and each result, positive or negative, give information about disease mechanism and amyloid functioning as well as an idea for next strategies like selection of small molecules that interact with precursors of amyloid fibrils at early stages to inhibit amyloid formation, secondary nucleation, or proliferation [1, 34].
12
1.6.
Ligand Peptide Selection by Phage Display
Library for Drug Discovery
Drug discovery is a challenging journey where scientist have been faced with variable troubles such as trying different candidates with high amount in variety or failing in clinical trials while in vitro experiments gives promising results. Recently, scientist uses a strategy in which candidate drug molecule is specifically screened against its target, which is called target-based drug discovery strategy [56]. This discovery strategy is applied by using in vitro display techniques which are bacterial surface display, yeast surface display, ribosome display, aptamer display, bead-surface display, cDNA/mRNA display, cis-activity based (CIS) display, covalent antibody display (CAD), SNAP display [57, 58]. Among these display systems, another display technique is phage display that is dominant in use among the other display systems and widely used in drug discovery [56]. In phage display systems, filamentous phages which are M13, f1 and fd, as well as T4, T7 and Lambda phage are used. M13 bacteriophage is the most common bacteriophage used in such system [58]. M13 owes circular ss-DNA encoding 11 genes, two of which are used in phage display technology, gIII and gVIII. The major coat protein pVIII and the minor coat protein pIII are used in displaying different types of peptides and proteins [56]. pVIII protein has about 2700 copies in the coat of M13. Thus, it is used for small-sized proteins or peptides with a high efficiency of expression without dissociation of coat proteins [57]. pIII, on the other hand, has 5 copies, having a role in infection of the phage, that is involved in displaying peptides and proteins
13 with variable length [57].
The selection of candidate ligand from peptide or protein library expressed on phage surface is achieved by 3-4 rounds of biopanning procedure in which target is interacted with phages and bound phages are obtained to identify the peptide sequence for further use [59]. With the power of phage display for selection candidate ligand by biopanning, today several antibody drugs are in use for treatment of severe diseases such as stomach cancer, Chron’s disease and ulcerative colitis [59]. In literature, also there are several peptides such as Romiplostim, Ecallantide, and Peginesatide in order to treat idiopathic thrombocytopenic purpura, hereditary angioedema, and chronic kidney disease associated anemia respectively, selected by phage display technology, which makes phage display technology is highly powerful for drug development [59].
1.7.
The Aim of Study
There are many different approaches for treatment of neurodegenerative diseases such as Alzheimer’s disease, Parkinson’s disease and Huntington’s disease. However, the lack of knowledge of disease mechanism depending on complex formation pathway of amyloid aggregates is resulted in challenges for drug development. In this thesis, we aimed to select candidate inhibitory peptides by using phage display library against yeast surface displayed-neurodegenerative amyloids. By the power of using monomers expressed on yeast cell surfaces, amyloids are in their monomeric units. Therefore, we select candidate inhibitory peptides for monomeric units by applying biopanning procedure without
14
immobilizing yeast cells to reach out more surface-displayed peptides. The selected inhibitory peptides may a promising drug candidate and they can inhibit/stabilize the amyloid monomeric units in their environment without clearance of them and disturbing the concentration balance of proteins.
Figure 3: The inhibitory peptide selection by using phage display library and yeast surface display system.
15
CHAPTER 2
MATERIALS AND METHODS
2.1. Bacterial
and
Yeast
Cell
Strains,
M13
Bacteriophage, Cell Maintenance and Growth
Conditions
For the cloning of the new constructs, Escherichia coli (E.coli) DH5α PRO strain was used. This strain provides high insert stability and high yield of DNA as a result of mutations in recA1 and endA genes, respectively. For recombinant protein expression, E.coli BL21 (DE3) strain was used. BL21 (DE3) strain has high transformation efficiency as well as it is suitable for Isopropyl-β-d-1-thiogalactopyranoside (IPTG) induction of T7 promoter since T7 RNA polymerase gene is expressed with under control of Lac promoter.
In order to store plasmids having repeated nucleotide region for a long time or cloning of new plasmid constructs with high number of repeated nucleotide region, E.coli SURE (Stop Unwanted Rearrangement Events) strain was used. E.coli SURE strain is deficient in endonuclease A activity and recombination by the expression of recB and recJ. Thus it provides an increased stability to constructs having repeated nucleotide region. Beside, E.coli K12 ER2738 strain has been used for bacteriophage propagation. This strain owes F factor that contains a mini-transposon that provides tetracycline resistance. Also, lac Z gene
16
is deficient in the lac operon, which makes this strain used with M13KE bacteriophage having complementary lacZα gene. Thus, ER2738 strain can be infected with M13KE bacteriophage and selection of infected bacteria can be achieved by blue/white screening with lac operon complementation.
All bacteria strains that were used in this study were stored at -80oC in Lysogeny Broth (LB) growth medium (recipe given in Appendix E, Table E.1) with the addition of 50% glycerol solution in 1:1 ratio. For E.coli ER2738 strain, single-use cell stocks were prepared for each experiment for avoiding lost of F pilus. Before preparing glycerol cell stock, each strain has been streaked to a agar plate having an appropriate antibiotic to get a single colony for stocking.
For biopanning experiments, Saccharomyces cerevisiae (S.cerevisiae) EBY100 strain was used. EBY100 strain is leucine and tryptophan deficient so these amino acids can be used as marker during cloning. Besides, aga2p gene is knocked out which makes this strain is suitable for surface display studies. This strain can be grown in yeast growth medium at 30ºC with 260 rpm shaking. For a long-term storage, yeast cells were stored with addition of equal volume of ice-cold 30% glycerol at -80ºC.
In order to select ligand peptides for neurodegenerative proteins to inhibit their aggregation, M13 phage display library was used. M13 is a filamentous bacteriophage that infects F+ bacterial cells such as E.coli ER2738 and propagates by using such bacterial cells as host. M13 bacteriophages were stored 4ºC for short-term. For long-term storage, 50% glycerol solution with 1:1 ratio was added onto each M13 sample and preserved at -80ºC.
17
2.2. Chemical Transformation of Bacterial Cells
Plasmids or newly cloned constructs are transformed into bacterial cells with chemical transformation protocol if they are not need to be treated special like necessity of electroporation in order to get high cloning results. For chemical transformation, competent cell was prepared with overnight grown culture of desired cell with the addition of an appropriate antibiotic. The overnight grown culture was diluted with a ratio of 1:100 into fresh LB with an addition of the same antibiotic. The cells were incubated at 37oC and 200 rpm. When OD600 value reaches the range of 0.2-0.5, cells are transferred into a new tube and put onto ice for 10 minutes to slow down the metabolism. After ice incubation, cells were centrifuged down at 3000 rpm for 10 minutes at 4oC. After centrifugation step, supernatant was discarded carefully without disrupting the cell pellet, and the cell pellet was resuspended with TSS buffer with a ratio 1:10 of grown culture volume. Then, competent cells were aliquoted into eppendorf tubes with 100 µL volume. The competent cell stocks were stored at -80oC if they were not used immediately. In the case of using stock competent cell, cells were thawed on ice for 30 minutes while freshly prepared competent cells were used directly without thawing step. Then, about 100 ng plasmids or complete Gibson assembly mix or complete T4 ligation mix (given in Appendix E, Table E.11 and Table E.12 respectively) after reaction was completed, were added onto the competent cells. Then cells mixed with plasmids were incubated on ice for 20 minutes. After this incubation, heat-shock step was applied with incubation of cells at 42oC for 45 seconds. Heat-shock step was followed by 5 minutes incubation on ice. After incubation, 500 µL LB was added onto cells and incubation was done at 37oC for
18
45 minutes at 200 rpm. At the end of the incubation, centrifugation was done at 8000 rpm for 5 minutes. 250 µL of the supernatant was discarded and cell pellet was resuspended with the remaining supernatant. The cells were spreaded onto LB-agar poured with the appropriate antibiotic. The plate then incubated at 37oC overnight if otherwise was not required for the growth of the cell.
2.3. Electrocompetent
Cell
Preparation
and
Electroporation of Bacterial Cells
The transformation of double-stranded M13 genome that displays peptides having different sequences on pIII was done by electroporation. To do so, electrocompetent cells were prepared right before electroporation process. Overnight grown bacterial cells were diluted with a ratio of 1:100 into fresh LB medium with the addition of an appropriate antibiotic. The diluted culture incubated at 37oC, 200 rpm until OD600 reached to 0.6-0.7. Then, the grown cells were cooled down by incubation on ice for 30 minutes. At the end of the cooling, centrifugation was done at 5000 g, +4oC for 15 minutes. Supernatant was removed and pellet was washed with 1:1 culture volume of ice-cold ddH2O by gently resuspending the cell pellet. Second centrifugation was done with the same conditions. Supernatant was removed and the second washing was done with 1:2 culture volume of ice-cold ddH2O. Cells were centrifuged down with the same conditions with the previous ones and supernatant was removed. The third washing was performed with 1:2 culture volume of ice-cold 10% glycerol. Before the final washing step, same centrifugation conditions were applied. For the final washing, supernatant was removed and 1:8 culture volume of ice-cold 10%
19
glycerol was added to wash the cells. The final centrifugation was done at 8000 g, +4oC for 10 minutes. After centrifugation, supernatant was removed and remaining cell pellet was resuspended with 600 µL ice-cold 10% glycerol. Finally, electrocompetent cells were aliquoted into fresh tubes with the volume of 100 µL for use. Also they can be stored at -80oC for a short-term.
For electroporation, 50 ng plasmid or newly cloned construct with Gibson assembly method or T4 ligation method after clean-up protocol were directly added onto freshly prepared electrocompetent cell or electrocompetent cell stock after thawing competent cells on ice for 30 minutes. Then, mixture of electrocompetent cells and plasmids were transferred to 1 mm electroporation cuvette (VWR, CAT# 58017-890) which was cooled at -200C for about 20 minutes to increase the efficiency of electroporation. The cuvette having cell-plasmid mixture then put into Bio-Rad Gene Pulser Xcell electroporation machine. Electroporation was done with appropriate parameters which were determined according to cuvette gap-size and cell type (Appendix E, Table E.16). After pulse, 1 mL SOC medium (recipe given in Appendix E, Table E.2) were added onto cells in 5 seconds. Then cells were incubated at 37oC for 30 minutes. At the end of the incubation, cells were centrifuged down at 8000 rpm for 5 minutes. 900 µL of the supernatant was discarded, cell pellet was resuspended with the remaining supernatant. Cells was spreaded onto an LB-agar poured with a proper antibiotic. The plate then incubated at 37oC overnight if different growth parameters were required for the growth of the cell.
20
2.4. Construction of Plasmid Vectors
For detection of proper folding of proteins displayed on yeast surface, sfGFP gene was inserted into pETcon-Aga2-NDP vector where NDP refers to neurodegenerative proteins (α-synuclein, amyloid β40 and amyloid β42, 25Q-Htt, 46Q-Htt, and 103Q-Htt). 1000ng of pETcon-Aga2-25Q-Htt, pETcon-Aga2-46Q-Htt, pETcon-Aga2-103Q-pETcon-Aga2-46Q-Htt, pETcon-Aga2-Amyloid β40, pETcon-Aga2-Amyloid β42 and pETcon-Aga2-α-synuclein vectors were digested with BamHI restriction enzyme digestion reaction. Restriction digestion reaction (recipe given in Appendix E, Table E.5) was performed by incubation at 37ºC for 3 hours. After digestion, samples were loaded on 1% agarose gel containing Sybr™ SAFE stain and electrophoresis was done at 120 V for 30 minutes. The gel was visualized by LED transilluminator (GeneDireX, Inc.). Linearized DNA at the expected region on the gel according to the ladder was separated from rest of the gel and gel extraction was done with NucleoSpin® Gel and PCR clean-up kit (Macherey-Nagel, # 740609.50) by following its own protocol.
For sfGFP cloning into vectors, sfGFP gene was amplified with PCR by using Q5 polymerase. For each type of protein, sfGFP amplification was done with different primers. pCEO3 and pCEO7 primers were used for cloning of sfGFP into pETcon-Aga2-25Q-Htt, pETcon-Aga2-46Q-Htt and pETcon-Aga2-103Q-Htt vectors. pCEO11 and pCEO13 primers were used for cloning of sfGFP into pETcon-Aga2-Amyloid β40 vector. pCEO9 and pCEO13 primers were used for cloning of sfGFP into pETcon-Aga2-Amyloid β42 vector. pCEO13 and pCEO14 primers were used for cloning of sfGFP into pETcon-Aga2-α-synuclein vector.
21
PCR was performed with the recommended conditions for the enzyme and the gene. PCR mix was loaded on 1% agarose gel containing Sybr™ SAFE stain, and electrophoresis was performed at 120 V for 30 minutes. At the end of electrophoresis, the gel was visualized by LED transilluminator. The band was observed at expected region and it was cut. DNA was extracted from the gel. sfGFP and linearized vectors were assembled with Gibson assembly reaction at 50ºC for 1 hour. When assembly was completed, Gibson assembly reaction mix was chemically transformed into E.coli DH5α PRO strain. At the end of transformation, cells were spreaded onto LB agar plate poured with appropriate antibiotic (recipe given in Appendix E, Table E.1). The plates were incubated at 37ºC overnight. Next day, colonies were selected and inoculated into 5mL of fresh LB containing appropriate antibiotic. The freshly inoculated cells were incubated at 37ºC, 200 rpm for overnight. Next day, cultures were used for plasmid isolation for preparing sequencing samples.
In order to clone NDPs into bacterial surface display system, pET22b-Ag43-160N-sfGFP vector was used. For the first construct, 25Q-Htt was amplified by using verified pETcon-Aga2-25Q-Htt vector by using pCEO52 and pCEO53 Gibson assembly primers with Q5 polymerase PCR under recommended conditions. For Ag43-160N surface secretion proteins were amplified by pCEO71 and pREA17 Gibson assembly primers with Q5 polymerase PCR under recommended conditions. For backbone preparation, pET22b-Ag43-160N-sfGFP was digested with XhoI and NcoI restriction enzymes (recipe given in Appendix E, Table E.6). Amplified 25Q-Htt was loaded on 2% agarose gel containing Sybr™ SAFE stain and electrophoresis was done at 110 V for 40 minutes while
22
backbone and amplified Ag43-160N fragment were loaded on 1% agarose gel containing Sybr™ SAFE stain and electrophoresis was done at 120 V for 30 minutes. At the end of electrophoresis, the gels were visualized by LED transilluminator. The bands were observed at expected regions and they were cut. DNAs were extracted from the gel.
The fragments were assembled with Gibson assembly reaction at 50ºC for 1 hour, which was followed by chemical transformation. After transformation, cells were spreaded onto LB agar plate poured with appropriate antibiotic. The plates were incubated at 37ºC overnight. Next day, colonies were selected and inoculated into 5mL of fresh LB containing appropriate antibiotic. The freshly inoculated cells were incubated at 37ºC, 200 rpm for overnight. Next day, cultures were used for plasmid isolation for preparing sequencing samples.
For cloning of α-synuclein into bacterial surface display vector, pCEO54 and pCEO55 Gibson primers were used for amplification of α-synuclein. As backbone, verified pET22b-Ag43-160N-25Q-Htt was digested with BamHI and SpeI to remove previously cloned 25Q-Htt. The fragments were loaded on 1% agarose gel containing Sybr™ SAFE stain and electrophoresis was done at 120 V for 30 minutes. At the end of electrophoresis, the gels were visualized by LED transilluminator. The bands were observed at expected regions and they were cut. DNAs were extracted from the gel. The fragments were assembled with Gibson assembly reaction at 50ºC for 1 hour, which was followed by chemical transformation. After transformation, cells were spreaded onto LB agar plate poured with appropriate antibiotic. The plates were incubated at 37ºC overnight. Next day, colonies were selected and inoculated into 5mL of fresh LB containing
23
appropriate antibiotic. The freshly inoculated cells were incubated at 37ºC, 200 rpm for overnight. Next day, cultures were used for plasmid isolation for preparing sequencing samples.
For cloning of Amyloid β40 into bacterial surface display vector, pCEO65 and pCEO66 Gibson primers were used for amplification of α-synuclein. pET22b-Ag43-160N-25Q-Htt was digested with BamHI and SpeI to remove 25Q-Htt. The fragments were loaded on 1% agarose gel containing Sybr™ SAFE stain and electrophoresis was done at 120 V for 30 minutes. At the end of electrophoresis, the gels were visualized by LED transilluminator. The bands were observed at expected regions and they were cut. DNAs were extracted from the gel. The fragments were assembled with Gibson assembly reaction at 50ºC for 1 hour, which was followed by chemical transformation. After transformation, cells were spreaded onto LB agar plate poured with appropriate antibiotic. The plates were incubated at 37ºC overnight. Next day, colonies were selected and inoculated into 5mL of fresh LB containing appropriate antibiotic. The freshly inoculated cells were incubated at 37ºC, 200 rpm for overnight. Next day, cultures were used for plasmid isolation for preparing sequencing samples.
2.5. Plasmid
Isolation,
Sanger
Sequencing
and
Sequencing Alignments
After cloning of each new construct, plasmids were isolated from bacterial cells by using Thermo scientific GeneJetⓇ plasmid isolation kit. Isolation was done by following the standard protocol provided with isolation kit. 3 to 10 mL overnight grown bacterial cells having one clone of a plasmid was enough for the kit. The
24
cell culture was centrifuged down at 8000 rpm for 5 minutes. The supernatant was discarded and cell pellet was resuspended with 250 µL of resuspension buffer having Rnase A provided with the kit. After, cell lysis was done by addition of 250 µL lysis buffer of kit. Cell lysis was done by incubating at room temperature for 4 to 6 minutes. For neutralization the lysis reaction, 300 µL neutralization buffer was added. The mixture was inverted 8 times as up and down slowly. To separate cell debris from supernatant that have plasmids, centrifugation was done at 11000 rpm for 10 minutes. At the end of the centrifugation, supernatant was taken and added to the GeneJet spin filter column. Then the column was centrifuged down at 11000 rpm for 1 minute. Then 2 times washing was done with wash buffer in which 100% ethanol was added as predetermined volume before the first use. For each washing step, 700 µL wash buffer added to the column and centrifugation was done at 11000 rpm for 1 minute. Next, in order to get rid off the remaining ethanol from wash buffer, 3 minutes centrifugation was applied at 11000 rpm. After centrifugation, remaining ethanol was evaporated with heat block at 65oC by incubation for 3 minutes. For elution of plasmid DNA, 20 µL ddH2O heated up to 65oC was added. The column was incubated for 3 minutes at room temperature to make ddH2O spreaded to the column filter completely. When 3 minute incubation was completed, column was put into a new micro-centrifuge tube to collect the elution of plasmid DNA. Centrifugation was done at 11000 rpm for 3 minutes. The elution concentration was measured by Thermo Scientific NanoDrop™ 2000 spectrophotometer with 1 µL sample. Plasmids can be stored at -20oC. For sequencing, 800 -1000 ng plasmid sample was taken and for sequencing, 0.25 µL of 100 µM