ContentslistsavailableatScienceDirect
Sensors
and
Actuators
A:
Physical
jo u r n al h om ep a g e :w w w . e l s e v i e r . c o m / l o c a t e / s n a
An
optofluidic
point-of-care
device
for
quantitative
investigation
of
erythrocyte
aggregation
during
coagulation
Ziya
Isiksacan
a,
Nurcan
Hastar
a,
Ozcan
Erel
b,
Caglar
Elbuken
a,∗aUNAM-NationalNanotechnologyResearchCenterandInstituteofMaterialsScienceandNanotechnology,BilkentUniversity,06800,Ankara,Turkey bDepartmentofClinicalBiochemistry,SchoolofMedicine,YildirimBeyazitUniversity,06800,Ankara,Turkey
a
r
t
i
c
l
e
i
n
f
o
Articlehistory: Received22June2018
Receivedinrevisedform8August2018 Accepted9August2018
Availableonline17August2018 Keywords: Coagulation Erythrocyteaggregation Fibrinogen Optofluidic Lab-on-a-chip
a
b
s
t
r
a
c
t
Coagulation, the process leading toclot formation with the interplay of blood constituents, is a self-regulatingmechanism,requiringattentiveandperiodicmonitoringfornumerousclinicalcases. Erythrocyteaggregation(EA)isacharacteristicbehaviouroferythrocytesformingreversibleclumps especiallyinvitroatlowshearrates.TheeffectofEAduringcoagulationisoverlookedinwholeblood (WB)clottingassays,andtherelationshipbetweenthetwomechanismsisnotwellunderstood.We presentanoptofluidicpoint-of-caredeviceenablingquantitativeinvestigationofEAfrom50lWB dur-ingthecoagulationprocess.NotonlydidweexplainthecoagulationmechanismconsideringEA,but wealsodemonstratedcoagulationtimemeasurementfromopticalEAanalysis.Thedeviceconsistsof adisposablecartridgeandahandheldanalyzercontainingapinchvalveforfluidmotionandopticsfor transmittedlightmeasurement.Followingthesampleintroductionandcessationofthevalveoperation, theopticalsignalisthelowestduetoshear-inducedcelldisaggregation.Then,thesignalincreasesdue toEAuntilreachingapeak,indicatingbloodclotting.Theworkingprinciplewasproventhroughclinical testsforprothrombintimemeasurement.Inadditiontorevealingtherelationbetweencoagulationand aggregation,thisdeviceispromisingforrapidWBcoagulationtimemeasurement.
©2018ElsevierB.V.Allrightsreserved.
1. Introduction
Bloodcoagulationisaprocessinvolvingtheinteractionof vari-ousplasmaproteins,coagulationfactors,andplateletstoeventually formstablefibrinstrandsforthepreventionofhemorrhage[1].This processconsistsoftwopathways,namedintrinsicandextrinsic, whicharetriggeredbydifferentactivators,butleadtoacommon pathway.Thecommonpathwayendswiththeconversionof fib-rinogensintofibrinclots[2].Invitromeasurementofcoagulation timeisrequiredforindividualswhoareunderoperational evalu-ation[3,4].Also,patientswhoarediagnosedwithorhavetherisk forcoagulationdisorders,embolism,stroke,heartattack,andother cardiovasculardiseases(CVD)needcoagulationtimemeasurement [5,6]. Anticoagulanttherapy, theprescription ofblood-thinning medication,isthecommonstrategytocombatcoagulationrelated disordersandtoregulateclottingstatusofpatients[7].The tra-ditionalapproach forcoagulationtime monitoringistheuseof benchtopinstrumentsinclinicalsettings.Thisnecessitates peri-odichospitalvisits,whichisgenerallycostlyandtime-consuming.
∗ Correspondingauthor.
E-mailaddress:[email protected](C.Elbuken).
Itisevenpotentiallylife-threateningifhospitalvisitisdelayed.This isespeciallyaconcernforpatientsreceivinganticoagulanttherapy asthemedicationshavenarrowtherapeuticwindows[8].
Theuseofpoint-of-care(POC)technologiesforcoagulationtime measurementaimstoalleviatethedrawbacksoftheconventional equipment[9].Thereareportablecoagulationanalyzersinthe mar-ketthat facilitate self-monitoringand reduceturnaroundtimes [10].Thesedevicesemployvariousmeasurementprinciplessuch asoptical(e.g.,detectionofchangeofparticleoscillationfrequency bylightreflection),mechanical(e.g.,viscositychangedetectionby cantileverormagnetposition),orelectrochemical(e.g., ampero-metricdetectionusingsubstratemolecules)[11].Fromafinance pointofview,thehighpricetagforboththemaindevice(purchased once)andthedisposabletest cartridges(purchased repeatedly; generallyhavingcomplicatedfabrication)isa drawback.Health insurances in many countries(e.g.,theauthors’countryof ori-gin)donotcoverthepurchaseofsuchcostlyequipmentforhome use.Thisplacessuchdevicesbeyondthereachofmanypeople who,therefore,visithospitals/anticoagulationclinicsforperiodic tests.Therearealsostudiesintheliteratureusingmicrosystems technologyforcoagulationtimemeasurement.Examplesinclude paper-based[12],cantilever-based[13],impedimetric[14],quartz crystalmicrobalance(QCM)[15],surfaceplasmonresonance(SPR)
https://doi.org/10.1016/j.sna.2018.08.007
Z.Isiksacanetal./SensorsandActuatorsA281(2018)24–30 25
[16],migrationdistance-based[17],andelastometry-based[18]. The practical issues associated with these studies are limited quantitativemeasurement,dependencetocleanroomfabrication, need for electronic integration, set-up complications, necessity forplasmaseparation,standardization,andviscositydependency, respectively,hinderingtheiradaptabilityascommontechniques. The two biological samples analyzed with these platforms are wholeblood(WB)andplasma.TheuseofWBforcoagulationassays offersease-of-use,lowsamplerequirement,andshortturnaround timesincomparisontotheuseofplasma.Ontheotherhand, cur-rentWBcoagulationassaysfallshortofunderstandingtheeffect oferythrocyteaggregation(EA),whichisaninherentmechanism affectingtheassaykinetics.Herein,weexploredthisintricate rela-tionship between coagulationand EA using a real-time optical analysisdevice.
Erythrocytes constitute reversible face-to-face aggregates understationaryconditionsoratlowshearratesinblood[19,20]. Theaggregation oferythrocytes is governedby cellularsurface properties (e.g., surface charge), plasma protein concentrations (e.g., fibrinogen),and shear rate that can disaggregatethe cell clumpsonce appliedabovea threshold[19].Normally, erythro-cytesstaydispersedinvivoduetotheshearratecreatedbyblood flow, butinadequate shearresultsinaggregation related disor-derssuch as hypertension and sepsis [21,22]. Measurement of erythrocyteaggregabilityis,therefore,ofclinicalvalue.Theinvitro measurementsareperformedbyaggregometersthatemploya vari-etyofmechanicalmeansforcelldisaggregationandphotometric methodsfor lightquantification [23–25]. Severalattempts have previouslybeenmadetomonitorcoagulationthroughthe aggrega-tionphenomenon[26–29].However,thefundamentalmechanisms for therelationship between coagulationand aggregation have remainedunclear,andthestudieslackedclinicalverifications.
Wepresentaportablelab-on-a-chip(LOC)deviceforthe opti-calanalysisoftheEAkineticsduringthecoagulationprocess.The deviceisemployedfortwomainpurposes:(i)measuring coagu-lationtimefromadropofWB(50l)inlessthan2minusingEA and(ii)demonstratingthepresence/effectofEAinacoagulating bloodtounderstandthefundamentalrelationshipbetweenthese twomechanisms.Thedeviceis usedforprothrombintime (PT) measurement.Themeasurementprincipleisbasedontheoptical investigationofEAduringcoagulationbyilluminatingtheblood samplewithnear-infraredlightandrecordingthetransmittedlight intensity.Weexplainedtheinterrelationbetweenthesetwo phys-iologicalphenomena,coagulationandEA,whichhavelongbeen studiedindependentlyofeachother.Microscopyobservations dur-ingthecoagulationprovidedin-depthunderstandingoftheactual physicalcorrespondenceoftheopticalmeasurementsignals, sup-portingtheresultsobtainedfromourplatform.In addition,the clinicaltestsallowedcomparisonofthedevicewithaconventional benchtopequipment, which showedthe potentialof thestudy beyondresearchlaboratories.
2. Experimentalsection
2.1. Materials
EthicalapprovalswereattainedfromtheEthicsCommitteesof bothBilkentandYildirimBeyazitUniversities.Priorinformed con-sentwasobtainedfromthevolunteerswhosehealthconditions wereunknowntous.21volunteers(11males,10females)were chosen,ensuringthatawidePTrangewascovered.3mlvenous WB wasacquiredfromthevolunteers intosodiumcitrate con-tainingvacuumtubes, andalltheexperimentswereperformed at37◦Cwithinthesamedayofblooddraw.Thebenchtop equip-mentavailableinthehospitalfortheconventionalmeasurements
wasSysmexCA-1500System(Siemens,Germany).ThromborelS HumanThromboplastin(Siemens,Germany)reagentwasusedfor thePTtests.7.6mgThromborelSHumanThromboplastinis dis-solvedin100ldeionized(DI)waterbygentlemixingat24◦C. 25ldissolvedreagentispipettedintothecartridgeswhichare thenkeptat−80◦Cfor2h.Thereagentsinthecartridgesarethen lyophilizedinafreeze-dryer(Labconco,US)for6h.Following,the cartridgesarestoredat4◦Cwithadesiccatorandusedwithin6h. Human fibrinogen conjugate labeled with Alexa Fluor 488 (MolecularProbes,US)waspreparedbyreconstitutingthesupplied samplein0.1Msodiumbicarbonate(pH8.3)atroomtemperature. Thestocksolutionisdividedintoaliquotsandstoredat−20◦C.Prior touse,thesolutionisbroughttoroomtemperature.Therequired amount(1l,2l,3l,or4l)isthengentlymixedwith100l WBandkeptintactatroomtemperaturefor30min.
70kDa dextran is purchased from Sigma-Aldrichand stored atroomtemperature.Threemicrocentrifugetubesarefilledwith 200lWB.ToprepareWBsampleswith5mg/ml,10mg/ml,and 15mg/mldextranconcentrations,1mg,2mg,and3mgdextranare addedtothetubesanddissolvedbygentlemixing.
2.2. Cartridgefabrication
The cartridge design was drawn using a CAD software (Autodesk,AutoCAD2016).For initialprototyping,thecartridge wasfabricatedoutofpolymethylmethacrylate(PMMA)usingCO2 ablation[30].Followingsuccessfultests,ametalmoldwasmadefor thefinaldesign,andcartridgesweremass-producedoutof poly-carbonate(PC)usinginjectionmoldingtominimizechip-to-chip variations.Wehave twocartridgedesigns.Fortheoptical mea-surements,thecartridgehasasinglechannelof1mmdepth(d), 1mmwidth(w),and50mmlength(l)withaninletandoutlet.For simultaneousopticalmeasurementsandmicroscopicobservations, thecartridgehastwoadjacentchannels(adeepand ashallow) sharingasingleinletandoutlet.Here,opticalmeasurementsare performedinthedeepchannel(1mmdepth).Sincesmallchannel depthsarerequiredforcleartop-viewmicroscopicobservationof individualcellsduetothehighpopulationoferythrocytesinWB (around5million/l)[31],theshallowchannel(150mdepth)is employedtovisualizetheerythrocytesduringtheoptical measure-ments.Toapplythesameshearrateonthecellsinbothchannel segmentsduringthedisaggregationphase,thefollowingequation shouldbesatisfiedbasedontheHagen-Poiseuillelaw:wdeepddeep2 =wshallowdshallow2.Sinceddeep=1mmanddshallow=150m,welet wdeep =1mmandwshallow =40mm.Also,consideringthe dimen-sionsofthedevice,weletldeep =50mmandlshallow =10mm. 2.3. Measurementplatform
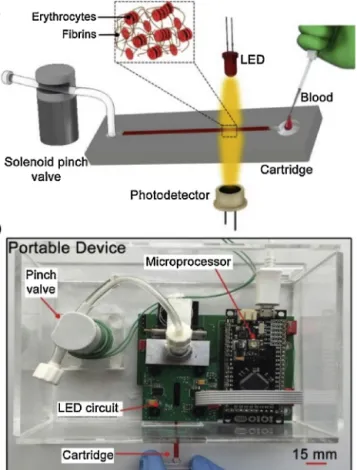
TheplatformisillustratedinFig.1.Itconsistsofasingle-use transparentcartridgeandaportableanalyzer.Thecartridge con-tainsasinglechannelwithadepthandwidthof1mm.Thisdeep channelallowsintenseinteractionbetweentheerythrocytesand theincidentlight.Theanalyzerconsistsoffourmodules:(I) car-tridgefixationmodule,(II)shearforceexertionmodule,(III)optical measurementmodule,and(IV)electroniccontrolmodule.Thefirst moduleisablackPMMAbasedcartridgeholderemployedtotightly fixthecartridgeonceinsertedintotheanalyzer.Thisholderalso blocksthetransmissionofthebackgroundlighttothe photodetec-tor,causedbyambientlighting.Thesecondmoduleisasolenoid pinchvalve(EW-98302-06,Cole-Parmer,US)thatisprogrammed togenerate 10s-longbackand forth motionof theblood sam-pleinthecartridge.Themovementsofthesamplewithastroke distance of5mmexert a shear rateonthe erythrocytesabove thethresholdforcompleteerythrocytedisaggregation.Inaddition tothedisaggregationofthecellclusters,thesemotionsfacilitate
Fig.1. a.Schematicillustrationandb.photographyofthemeasurementplatform. Thecoagulationactivatorislyophilizedinthecartridge.Thepinchvalve disaggre-gatestheerythrocyteclustersandmixeswholebloodwiththeactivatorreagent.The LEDilluminatesthesample,andthephotodetectorrecordsthetransmittedlight.
homogenous mixing of theblood sample with thecoagulation activatorreagentlyophilizedin thecartridge.Themeasurement principleisbasedontheopticalinvestigationoftheerythrocyte aggregationduringthecoagulationonset. Theoptical measure-mentmodule,therefore,consistsofalight-emittingdiode(LED) (VSMG2700,Vishay,US)andaphotodetector(VEMT4700,Vishay, US).TheLED illuminatestheblood sample inthenear-infrared bandwith830nmwavelength,atwhichhemoglobinand there-foreWBabsorptionisminimum,whereastransmissionoflightis enhanced[31,32].Thephotodetectorcollectsthelighttransmitted throughthebloodsample.Theelectroniccontrolmoduleconsists ofaprintedcircuitandamicroprocessor(IOIO-OTG,SparkFun,US). Thecircuitcomprisesatransistorfunctioningasaswitchtocontrol thepinchvalve,atemperaturecontrollertofixthetesttemperature at37◦C,andatransimpedanceamplifier–lowpassfilterpairfor thecurrent-to-voltageconversionofthephotodetectoroutput.The microprocessorcontrolstheassayparametersthrougha custom-developedJava-basedsoftwaretosettheLEDintensity,shearforce exertiontime,temperature,andthetotaltestduration.
3. Resultsanddiscussion
3.1. Opticalanalysisoferythrocyteaggregation
A cartridgetakes 50l citrated WB that startsto coagulate onlywhen mixed withan activatorreagent. The initial experi-mentwascarriedoutusingcitratedWBwithoutusinganyreagent inthecartridge.Followingtheintroductionofthebloodsample tothechannel,thesolenoidpinchvalvewasoperatedfor10sto completelydisaggregatetheerythrocyteclusters.Then,thevalve operationwas terminated to letthe erythrocytes re-aggregate.
Fig.2. a.Measurementofthetransmittedsignalintensityofthewholebloodsample usingthecoagulationplatformwhenthecartridgewastestedwithoutanactivator reagentandwithPTreagent.Theinsetshowstheschematiccartridgeanda pho-tographyofthelyophilizedreagentwithinthechannel.b.Thetransmittedsignal intensitywhenhumanthromboplastinwaslyophilizedpriortothetest.Thesignal profileisdividedintofourphases,andthemaximumintensitylevelcorrespondsto thecoagulationtime.
Duringthisre-aggregationprocess,theLEDilluminatedtheblood sample while the photodetectormeasured the intensityof the transmittedlight.TheblacksignalprofileinFig.2ashowsthe mea-suredsignalintensityforthiscase.Attheendofthepinchvalve operation(time:0ths),theerythrocytesarealldispersed.Since eachindividualcellservesasascatteringsource,theintensityisat thelowest.Astimeprogresses,erythrocytesaggregate,and, there-fore,thesignalintensityincreasesuntilcompleteaggregationofthe erythrocytes.Withthecompleteaggregation,thesignalintensity staysconstant.
Thecoagulationcascadeconsistsofanintrinsicandan extrin-sicpathwaydirectingtoacommonpathwaythatendswiththe formationoffibrin clots.The latteristriggeredbytissue factor, andprothrombintime(PT)isusedfortheevaluationofthe extrin-sicpathway.Humanthromboplastinwaslyophilizedinacartridge totriggertheextrinsicpathwayforPTmeasurement.Fig.2aalso shows the measured signalintensity for this case (red signal). Here,thesignalintensityincreasesuntila maximumvalueand decreasesback.Ontheotherhand,forthecartridgewithoutany activatorreagent,thesignalintensitycontinuouslyincreasesdue
Z.Isiksacanetal./SensorsandActuatorsA281(2018)24–30 27
Fig.3.Theroleoffibrinogenincoagulationandaggregation.Fourwholeblood sam-pleswithvaryingfluorescencelabeledfibrinogenconcentrationswerepreparedand introducedtocartridgeswithhumanthromboplastin.a.Thesample-filledcartridges wereobservedusingfluorescencemicroscopyat40×.Theilluminatingregions cor-respondtofibrinnetworksformedbecauseofcoagulation.b.Thesample-filled cartridgesweretestedusingtheplatform.Theinsetshowstheinitial10sforeach case.Therateofaggregationincreaseswiththeincreasingfibrinogenconcentration.
totheaggregationoferythrocytes(blacksignal).Bothcaseswere repeatedthreetimes,andonlyonetestwasshownhereforeach casesincetheothershadthesametrend.Itshouldalsobenoted thattheabsorption/transmissionspectraofboththecoagulating andnon-coagulatingWBaredeterminedbytheerythrocytesinthe near-infraredband[33–35].It,therefore,impliesthatthe coagula-tionprocessaffectstheaggregationoftheerythrocytes,whichcan opticallybeobservedfromtherecordedsignalprofile.
Fig.2bshowsthesignalprofileobtainedwhenhuman thrombo-plastinislyophilizedinthecartridge.Thissignalisdividedintofour distinctphases.Theinitialphasecorrespondstothe10s-longvalve operationthatinducesshearrateonthecellsfordisaggregation. Attheendofthisphase,thesignalintensityisatitslowest, con-firmingthecompletedisaggregation.Followingthisphase,phase-1 witnessesanincreaseinthesignalintensityforaround30s.Like thenocoagulationcase,thisincreaseisduetotheaggregationof theerythrocytes.Nomoreincreasebeyondthemaximumintensity isthenobserved.Thisiscausedbytheformationoffibrinclots pre-ventingfurtherclumpingoftheerythrocytesand,therefore,ends
Fig.4.Theemploymentofdextrantofacilitatetheaggregationprocessinphase-1 forthecoagulatingbloodsample.a.Fourwholebloodsampleswithvaryingdextran concentrationswerepreparedandintroducedtohumanthromboplastinlyophilized cartridges.Also,wholebloodsamplewithnodextranwasintroducedtoanempty cartridge.Opticalmeasurementswereperformedwiththeplatform.b.Initial10s oftheopticalsignalsgiveninparta.
theaggregationprocess.Thetimecorrespondingtothemaximum intensityisnamedasTmax.Thesignalintensitydecreasesin phase-2duetotheclotcontraction,aprocessthattakesplacerightafter theclotformation[36,37].Followingtheendofphase-2,thesignal intensityshowsaconstanttrendinphase-3,suggestingthatthe clotiscompletelystabilized.
3.2. Roleoffibrinogenincoagulationandaggregation
Whennoactivatorreagentwasusedinthecartridge,theblood sampledoesnotcoagulatebutonlyexperienceserythrocyte aggre-gation.Theclumpingoftheerythrocytesprogressivelydecreases thesurfaceareaofthecells,resultinginanongoingincreasein thetransmittedsignalintensity.Whenhumanthromboplastinwas usedinthecartridgetotriggerthecoagulation,weobservea sim-ilarincreasingtrendintheopticalsignalintensityuntilreachinga peakpoint.
Referringtotheinitial∼30softheredandblacksignalsinFig.2a, atthestart,thesignalintensitiesarethesame(atthelowest)due tothepriorvalveoperation.Then,duringphase-1,thereisa
dif-Fig.5.ComparisonoftheplatformwiththeconventionalequipmentforPTmeasurement.a.Comparisonwithn=21wholebloodsamples.Goodnessofthefitis0.97using linearregression.b.Repeatabilityanalysiswithn=6samples.Eachsampleistestedthreetimes.Errorbarsindicatestandarddeviations.
ferenceintheintensityincrease,thereforeintheaggregationrate, betweenthesetwocases.Whenthecartridgeisfreeofany activa-tor,theaggregationrateofthesample(black)ishigherthanthatof thecoagulatingsample(red).Thisismainlyduetothefibrinogen activityinthesamples.
Fibrinogen,aglycoproteininplasma,playsanintegralpartinthe coagulationprocess[2].Itisconvertedtoafibrousproteinnamed fibrintoformstableclots.FibrinogenalsotakesroleduringEAandis themostessentialplasmaproteinforthisprocess[38,39]. Accord-ingtothebridgingmodel,fibrinogenproteinsadsorbonthecell surfacesbringingadjacenterythrocytesincontact[40].
Toshowtheequallykeyroleoffibrinogenincoagulationand aggregation,fluorescentlabeledhumanfibrinogenwasemployed. FourWBsampleswithdifferentfibrinogenconcentrationswere prepared(seeMaterials). Eachsamplewasintroducedtoa car-tridgewithhumanthromboplastin,andtheopticalmeasurements were performed. Following the measurements, the cartridges wereobservedunderanuprightfluorescencemicroscope(Zeiss, Germany) at40× magnification. Fig.3a shows the microscopic imagesfor the four samples.The fluorescence regions in each imageare thefibrin networks lighting updue tothe polymer-izeddye-labeledfibrinogens.Asthefibrinogenconcentrationin WBincreasedfrom1%upto4%,thefluorescenceilluminationarea alsoproportionallyincreased.Itsuggeststhatwiththeincreasing fibrinogenconcentration,morefibrinogenstookpartinthe coag-ulationprocess,and,therefore,morefibrinstrandswereformed. Fig.3bshowstheopticalsignalintensitiesofthefourblood sam-plesmeasuredwiththeanalyzer.Theinsetshowstheinitial10s followingthecompletedisaggregation.Asthefibrinogen concen-trationincreases,therateofincreaseinintensity,namelytherate ofaggregation,alsoincreases.Itimpliesthattheadditionofmore fibrinogensfacilitatestheaggregationoferythrocytes.
Whenthereisnoactivatorinthecartridge,thebloodsample doesnotcoagulate,andweobserveonlytheaggregationofthe erythrocytes(blacksignal,Fig.2a).Here,fibrinogensonlytakerole duringtheaggregationprocess.Ontheotherhand,thepresenceof theactivatorinthecartridgetriggersthecoagulationcascade(red signal,Fig.2a).Inthiscase,fibrinogensaresimultaneouslyappealed totakepartinthecoagulationandtheaggregationprocesses.This splitstheirenergytotwodistinctrolesthatwouldotherwiseplay roleonlyinEA.Sincefibrinogenconcentrationsforbothcasesare thesameatthestart,thenumberoffibrinogenstakingpartinthe
aggregationprocessand/orthefibrinogens’aggregationefficiency decreaseforthecoagulatingbloodsampleinphase-1.
Tofurtherconfirmthesefindings,weemployedanEAinducer molecule, dextran[41], toenhancethe aggregationratethat is affectedbythe fibrinogensengagedin thecoagulationprocess. Firstly,citratedWBwithnodextranwasintroducedtoanempty cartridge,andopticalmeasurementwasperformedwiththe ana-lyzer.AsshowninFig.4a(blacksignal),thereisalwaysanincrease inintensityduetouninterruptedEA.Secondly,wepreparedfour WB samples with dextran concentrations of 0mg/ml, 5mg/ml, 10mg/ml,and15mg/ml(seeMaterials).CitratedWBwithno dex-tranwasintroducedtoacartridgehavinghumanthromboplastin. Inthiscase(redsignal,Fig.4a),theintensityincreasewasobserved withamuchlowerratecomparedtothefirstcase.Then,citrated WB samples with differentdextran concentrations were intro-duced to human thromboplastin lyophilized cartridges. Fig. 4a showsthesignalintensitiesofthemeasurementsforallthecases, andFig.4billustratesthefirst10sofeachsignalforeaseof compar-ison.Theseresultsshowthatthepresenceofdextransupportsthe aggregationprocessandincreasestheaggregationrateinphase-1. Asshown inFig.4b,higherdextranconcentrationincreasesthe aggregationrateand, therefore,compensatesfor thefibrinogen deficiencyofthecoagulatingsamples.
3.3. Comparativecoagulationtimemeasurements
Forthecoagulatingbloodsample,thetransmittedsignal inten-sityinitiallyincreasesduetoEAandreachesamaximumintensity value.ThetimewhenthesignalisatthepeakisnamedasTmax. Theobservationthat theintensity ofthenon-coagulating sam-pleincreasesbutthatofthecoagulatingsampledoesnotbeyond TmaxproposesthattheEAinthecoagulatingsamplestopsatTmax. Inotherwords,nofurtheraggregationatandbeyondTmaxstops furtherintensityincrease.Wesuggestthatthereasonpreventing furtheraggregationisthefibrinstrandsthatwrapupthe erythro-cytesandformtheclottingatTmax.Therefore,Tmaxisthetimewhen thebloodcoagulationoccurs.
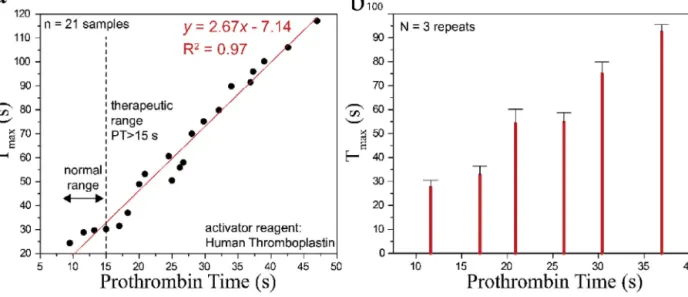
ToverifythatTmaxisindeedanindicationofthecoagulation time,specificallyprothrombintime(PT),comparativetestswere performedatahospital.First,thePTvaluesof21volunteerWB sam-plesweremeasuredusingtheconventionalgoldstandardmethod. Afterwards,50l from each WB sample wasintroducedinto a
Z.Isiksacanetal./SensorsandActuatorsA281(2018)24–30 29
cartridge,andoptical measurementswereperformedusing our analyzer.Tmaxvalues weremeasuredfromthetransmitted sig-nalintensitiesusingapeakdetectionalgorithminMATLAB.Fig.5a showstheregressionanalysisforthecomparisonofthe conven-tionallymeasuredPTvalues(x-axis)andtheTmaxvaluesmeasured byour system(y-axis).A linearfit was usedto findthelinear equationfortheTmax,andthecorrelationcoefficient(R2)ofthe regressionfitwascalculatedas97%,demonstratingthehigh corre-lationbetweenthemeasurementplatforms.Then,6WBsamples withPTsinbetween10–15,15–20,20–25,25–30,30–35,35–40s rangeswerechosen.Thesamplesweretestedthreetimeswiththe analyzerforrepeatabilityanalysis,andthreeTmaxvaluesforeach volunteersamplewereaveraged.Fig.5bshowsthemeanand stan-darddeviation(SD)oftheaveragedTmaxvaluesmeasuredbyour system(y-axis).TheSDforthesampleinthehealthyrangewas around2.5s,whereasitwasaround4sfortheothersamples.These regression andrepeatability analyseswerepromising for initial point-of-carePTmeasurements,and theplatformshasa poten-tialforcommercializationafterclinicaltrialsforbothvenipuncture (venous)andfingerprick(capillary)samples.
3.4. Simultaneousopticalmeasurementandmicroscopic observation
We also aimed to observe a blood sample under an opti-calmicroscopewhile measuringtheopticaltransmissionsignal todemonstratetheactualphysical correspondence ofthe opti-calsignals.Twocartridgeswereemployedfortheobservationof erythrocytesforcoagulatingandnon-coagulatingbloodsamples as schematicallyshown in Fig. 6a inset. These cartridges were uniquelyfabricatedtomonitortheerythrocytesinreal-timeunder amicroscopefromtheshallowchannelsegmentaswellas simul-taneously obtaining optical transmission signal from the deep channelsegment.SincetheerythrocytepopulationinWBishigh, dilutedWB (hematocrit:5%)wasused todistinguishindividual cellswithinthesample.Wepreferredlowerconcentrationhuman thromboplastin(19g/l)asanactivatorreagentforaslower coagu-lationprocesstohavemoredetailedcellvisualization.4lreagent solutionwasaddedintotheinletofoneofthecartridges.Toensure thesamedilutionratio,4lPBSwasaddedintotheinletofthe othercartridge.Followingtheintroductionofthereagentsolution orPBS,thebloodsamplesweregentlymixedwiththereagentsfor 3sattheinletsandpipettedintothecartridgesforreal-time obser-vationunderamicroscopeat40xmagnificationduringtheoptical measurements.
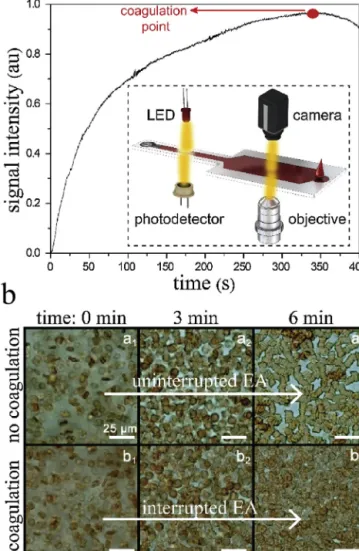
The “no coagulation” case in Fig. 6b represents the non-coagulatingbloodsample,whereasthe“coagulation”caseinFig.6b representsthecoagulatingbloodsample.Attime:0min,thecells werealldisaggregatedinbothcases.Atthe“nocoagulation”case, theerythrocytesstartedtopartiallyaggregateastimepassed,and theycompletelyaggregatedattime:6minduetonointernal(e.g., coagulation)orexternal(e.g.,shearrate)interventiononthem.At the“coagulation”case,theerythrocytesstartedtoaggregatewitha lowerrate,comparedtothe“nocoagulation”case,duetotheonset ofthecoagulation.Theaggregationprocesswasclearlyobserved fromthe0thmin(b1)tothe3rdmin(b2).Then,aggregationhardly progressed,and,finally,thecellswereallpackedatthe6thmin (b3).Thisdemonstratesthatthecoagulatingbloodsample coagu-latedatthe6thmin.ThiswasalsoverifiedinFig.6ashowingthe transmittedsignalintensityforthecoagulatingbloodsamplethat reachesitsmaximuminaround350s(Tmax=350s).
Fig.6.a.Measurementofthetransmittedsignalintensityforacoagulatingwhole bloodusingthepoint-of-careplatform.Themaximumsignalintensityisreachedin 6min.Theinsetistheschematicrepresentationofthesimultaneousoptical mea-surementandmicroscopicobservation.b.Real-timetop-viewobservationofthe non-coagulating(a1–a3)andcoagulating(b1–b3)bloodsamplesunderanoptical
microscope.Erythrocytescompletelyaggregateintheformersampleattheendof the6thminwithoutanyinterruption.Erythrocytespartiallyaggregateinthelatter sample,followedbythepreventionoftheaggregationduetothecoagulationofthe sample.
4. Conclusion
Wepresentedaportablelab-on-a-chipdevicethatenables opti-calinvestigationofEAduringcoagulationfordemonstratingthe interrelation betweenaggregationand coagulationprocessesas wellasmeasuringWBcoagulationtimeusinganovel methodol-ogyemployingEAmechanism.Thedeviceopticallyinvestigatesthe aggregationoftheerythrocytesandextractsthetimeforthe forma-tionoffibrinnetworkshencethetimeofcoagulation.Theassaywas showntoberesponsivetotheevaluationoftheextrinsicpathwayof thecoagulationcascade(prothrombintime).Itrequiresonly50l WBandiscompletedinlessthan5min.Thetestresults demon-stratedthehighcorrelationoftheplatformwithaconventional benchtopequipment.Theroleoffibrinogenproteinsinthe aggre-gationandcoagulationprocessesandthereforeonthemeasured opticalsignalswasshownthroughfluorescenceimagingoflabeled fibrinstrandsaswellasusingdextranasanaggregationinducerin thebloodsamples.Thissample-in-result-outplatformisa poten-tialcandidateforperiodic,facile,low-cost,rapid,andlowsample
volumemeasurementofcoagulationtimeforbothlab-basedand point-of-careuse.
Acknowledgements
The authors thank Hazal Isiksacan, Abtin Saateh, Alper Demir, and Pinar Beyazkilic for their help in figures, fluores-cence microscopy, clinical tests, and manuscript proofreading, respectively. Ziya Isiksacan is supported by ASELSAN Graduate ScholarshipforTurkishAcademicians.Theauthorsacknowledge supportfromTheScientificandTechnologicResearchCouncilof Turkey(TUBITAKprojectno.213S127).
References
[1]B.Furie,B.C.Furie,Themolecularbasisofbloodcoagulation,Cell53(1988) 505–518.
[2]J.Antovic,M.Blomb ¨ack,EssentialGuidetoBloodCoagulation,JohnWiley& Sons,2013.
[3]P.Toulon,Y.Ozier,A.Ankri,M.-H.Fléron,G.Leroux,C.M.Samama, Point-of-careversuscentrallaboratorycoagulationtestingduring haemorrhagicsurgery.Amulticenterstudy,Thromb.Haemost.101(2009) 394–401.
[4]S.A.Kozek-Langenecker,Perioperativecoagulationmonitoring,BestPract. Res.Clin.Anaesthesiol.24(2010)27–40.
[5]G.Lowe,A.Rumley,Therelevanceofcoagulationincardiovasculardisease: whatdothebiomarkerstellus?Thromb.Haemost.112(2014)860–867.
[6]R.Mathews,R.M.Issac,Bleedingandcoagulationdisorders,in:Clin.Pathways Emerg.Med.,SpringerIndia,NewDelhi,2016,pp.417–428.
[7]B.Collins,C.Hollidge,Antithromboticdrugmarket,Nat.Rev.DrugDiscov.2 (2003)11–12.
[8]K.Chaudhari,B.Hamad,B.aSyed,Antithromboticdrugsmarket,Nat.Rev. DrugDiscov.13(2014)571–572.
[9]Z.Isiksacan,M.T.Guler,A.Kalantarifard,M.Asghari,C.Elbuken,Lab-on-a-chip platformsfordiseasedetectionanddiagnosis,in:Biosens.Nanotechnol,John Wiley&Sons,Inc,Hoboken,NJ,USA,2017,pp.155–181.
[10]W.S.Baker,K.J.Albright,M.Berman,H.Spratt,P.A.Mann,J.Unabia,J.R. Petersen,ClinicaChimicaActaPOCTPTINR—isitadequateforpatientcare? AcomparisonoftheRochecoaguchekXSvs.StagoStarvs.SiemensBCSin patientsroutinelyseeninananticoagulationclinic,Clin.Chim.Acta472 (2017)139–145.
[11]L.F.Harris,V.Castro-Lopez,A.J.Killard,Coagulationmonitoringdevices:past, present,andfutureatthepointofcare,TrAC-TrendsAnal.Chem.50(2013) 85–95.
[12]H.Li,D.Han,G.M.Pauletti,A.J.Steckl,Bloodcoagulationscreeningusinga paper-basedmicrofluidiclateralflowdevice,LabChip14(2014)4035–4041.
[13]F.Padovani,J.Duffy,M.Hegner,Microrheologicalcoagulationassayexploiting micromechanicalresonators,Anal.Chem.89(2017)751–758.
[14]K.F.Lei,K.H.Chen,P.H.Tsui,N.M.Tsang,Real-timeelectricalimpedimetric monitoringofbloodcoagulationprocessundertemperatureandhematocrit variationsconductedinamicrofluidicchip,PLoSOne8(2013).
[15]M.Andersson,J.Andersson,A.Sellborn,M.Berglin,B.Nilsson,H.Elwing, Quartzcrystalmicrobalance-withdissipationmonitoring(QCM-D)forreal timemeasurementsofbloodcoagulationdensityandimmunecomplement activationonartificialsurfaces,Biosens.Bioelectron.21(2005)79–86.
[16]K.M.Hansson,K.Johansen,J.Wetterö,G.Klenkar,J.Benesch,I.Lundström,T.L. Lindahl,P.Tengvall,Surfaceplasmonresonancedetectionofblood
coagulationandplateletadhesionundervenousandarterialshearconditions, Biosens.Bioelectron.23(2007)261–268.
[17]M.T.Guler,Z.Isiksacan,M.Serhatlioglu,C.Elbuken,Self-powereddisposable prothrombintimemeasurementdevicewithanintegratedeffervescent pump,SensorsActuatorsBChem.273(2018)350–357.
[18]R.J.Luddington,Thrombelastography/thromboelastometry,Clin.Lab. Haematol.27(2005)81–90.
[19]O.K.Baskurt,HandbookofHemorheologyandHemodynamics,IOSPress, 2007.
[20]O.K.Baskurt,M.Uyuklu,S.Ozdem,H.J.Meiselman,Measurementofredblood cellaggregationindisposablecapillarytubes,Clin.Hemorheol.Microcirc.47 (2011)295–305.
[21]O.K.Baskurt,A.Temiz,H.J.Meiselman,Redbloodcellaggregationin experimentalsepsis,J.Lab.Clin.Med.130(1997)183–190.
[22]O.K.Baskurt,H.J.Meiselman,Erythrocyteaggregation:basicaspectsand clinicalimportance,Clin.Hemorheol.Microcirc.53(2013)23–37.
[23]O.K.Baskurt,M.Uyuklu,M.R.Hardeman,H.J.Meiselman,Photometric measurementsofredbloodcellaggregation:lighttransmissionversuslight reflectance,J.Biomed.Opt.14(2009)54044.
[24]O.K.Baskurt,M.Uyuklu,S.Ozdem,H.J.Meiselman,Measurementofredblood cellaggregationindisposablecapillarytubes,Clin.Hemorheol.Microcirc.47 (2011)295–305.
[25]E.Hysi,R.K.Saha,M.C.Kolios,Ontheuseofphotoacousticstodetectred bloodcellaggregation,Biomed.Opt.Express3(2012)2326–2338.
[26]P.Riha,F.Liao,J.F.Stoltz,Theeffectofrouleauxformationonblood coagulation,Clin.Hemorheol.Microcirc.17(1997)341–346.
[27]H.Lim,J.Nam,S.Xue,S.Shin,Measurementofbloodcoagulationwith consideringRBCaggregationthroughamicrochip-basedlighttransmission aggregometer,Clin.Hemorheol.Microcirc.47(2011)211–218.
[28]K.-H.Nam,E.Yeom,H.Ha,S.J.Lee,Simultaneousmeasurementofredblood cellaggregationandwholebloodcoagulationusinghigh-frequency ultrasound,UltrasoundMed.Biol.38(2012)468–475.
[29]D.Sakota,R.Kosaka,M.Nishida,O.Maruyama,Opticalaggregometryofred bloodcellsassociatedwiththeblood-clottingreactioninextracorporeal circulationsupport,J.Artif.Organs19(2016)241–248.
[30]Z.Isiksacan,M.T.Guler,B.Aydogdu,I.Bilican,C.Elbuken,Rapidfabricationof microfluidicPDMSdevicesfromreusablePDMSmoldsusinglaserablation,J. Micromech.Microeng.35008(2016)9.
[31]F.Lang,M.Föller,Erythrocytes,ImperialCollegePress,2012.
[32]M.Uyuklu,M.Canpolat,H.J.Meiselman,O.K.Baskurt,Wavelengthselectionin measuringredbloodcellaggregationbasedonlighttransmittance,J.Biomed. Opt.16(2011)117006.
[33]Z.Isiksacan,O.Erel,C.Elbuken,Aportablemicrofluidicsystemforrapid measurementoferythrocytesedimentationrate,LabChip16(2016) 4682–4690.
[34]F.A.Greko,Reflectancespectroscopyofclottingblood,Arch.Pathol.Lab.Med. 128(2004)173–180.
[35]B.Linnemann,J.Schwonberg,H.Mani,S.Prochnow,E.Lindhoff-Last, Standardizationoflighttransmittanceaggregometryformonitoring antiplatelettherapy:anadjustmentforplateletcountisnotnecessary,J. Thromb.Haemost.6(2008)677–683.
[36]V.Tutwiler,R.I.Litvinov,A.P.Lozhkin,A.D.Peshkova,T.Lebedeva,F.I. Ataullakhanov,K.L.Spiller,D.B.Cines,J.W.Weisel,Kineticsandmechanicsof clotcontractionaregovernedbythemolecularandcellularcompositionof theblood,Blood127(2016)149–159.
[37]W.A.Lam,O.Chaudhuri,A.Crow,K.D.Webster,T.-D.Li,A.Kita,J.Huang,D.A. Fletcher,Mechanicsandcontractiondynamicsofsingleplateletsand implicationsforclotstiffening,Nat.Mater.10(2011)61–66.
[38]N.Maeda,T.Shiga,Oppositeeffectofalbuminontheerythrocyteaggregation inducedbyimmunoglobulinGandfibrinogen,Biochim.Biophys.Acta855 (1986)127–135.
[39]N.Maeda,M.Seike,T.Nakajima,Y.Izumida,M.Sekiya,T.Shiga,Contribution ofglycoproteinstofibrinogen-inducedaggregationoferythrocytes,Biochim. Biophys.Acta1022(1990)72–78.
[40]S.Chien,K.M.Jan,Redcellaggregationbymacromolecules:rolesofsurface adsorptionandelectrostaticrepulsion,J.Supramol.Struct.1(1973)385–409.
[41]Z.Isiksacan,M.Asghari,C.Elbuken,Amicrofluidicerythrocytesedimentation rateanalyzerusingrouleauxformationkinetics,Microfluid.Nanofluid.21 (2017)44.
Biographies
ZiyaIsiksacanisaPh.D.candidateattheUNAMMaterialsScienceand
Nanotechnol-ogyProgramatBilkentUniversity.HereceivedhisM.S.degreefromTheUniversityof Edinburgh(UK).Hisresearchinterestsareinthefieldofmicrofluidics,optofluidics, point-of-carediagnostics,andbioelectronics.
NurcanHastarreceivedherM.S.degreetheUNAMMaterialsScienceand
Nano-technologyProgramatBilkentUniversity.Herresearchinterestsareinthefieldof molecularbiologyandmicrofluidiccellculturing.
OzcanErelisaProfessoratYildirimBeyazitUniversityMedicalSchool.Heisthe
HeadofDepartmentofMedicalBiochemistryLaboratory.Hisresearchinterestsare inthefieldofclinicalbiochemistryanddiagnostics.
CaglarElbukenisanAssistantProfessoratBilkentUniversity,National
Nano-technologyResearchCenter.Hisresearchinterestsincludelab-on-a-chipdevices, dropletmicrofluidics,andsensingtechnologiesforportableapplications.