PISA mathematics and reading performance differences
of mainstream European and Turkish immigrant
students
Serkan Arikan1&Fons J. R. van de Vijver2,3,4& Kutlay Yagmur2
Received: 9 October 2015 / Accepted: 21 March 2017 / Published online: 30 March 2017 # Springer Science+Business Media New York 2017
Abstract Lower reading and mathematics performance of Turkish immigrant students as compared to mainstream European students could reflect differential learning out-comes, differential socioeconomic backgrounds of the groups, differential mainstream language proficiency, and/or test bias. Using PISA reading and mathematics scores of these groups, we examined the role of bias and various measures related to immigrant integration policies of the host societies. Results of a multilevel analysis of reading and mathematics tests demonstrated that at individual level, students with higher scores on an index of economic, social, and cultural status obtained higher achievement scores. At country level, MIPEX scores of education and the human development index of participating countries could predict differences in reading results but not in mathe-matics. After correction for background characteristics, effect sizes showed a difference of .65 SD (down from a value of .96 before correction) for reading and .58 SD (down from .78) for mathematics. However, a similar correction for background variables increased the score differences between Turkish immigrants and mainstreamers. Keywords Turkey . Europe . Immigrants . PISA . Reading . Mathematics . Multicultural policies
* Serkan Arikan [email protected]
1
Department of Elementary Education, Mugla Sitki Kocman University, Muğla, Turkey 2 Department of Culture Studies, Tilburg University, Tilburg, The Netherlands 3
Workwell Unit, North-West University, Potchefstroom, South Africa 4
The results of PISA (Programme for International Student Assessment) have been analyzed from different perspectives by numerous scholars all over the world, comparing achievement, student backgrounds, school characteristics, and their relationships. In this study, we are interested in immigrant performance, more specifically in the educational achievement of Turkish immigrant students in dif-ferent countries as a function of individual characteristics, such as socioeconomic status, and country characteristics, such as educational policies vis-à-vis immi-grants. Lower school achievement among immigrant minority children is a serious issue in most European countries. We primarily aim at deepening our understanding of the achievement differences by concentrating on a single immigrant group in multiple national contexts, as recommended in acculturation research (Sam and Berry 2006). By comparing PISA outcomes of Turkish immigrants in Austria, Belgium, Denmark, Finland, Germany, the Netherlands, and Switzerland, we ex-amined the presence of achievement differences across these countries and their background, notably how these differences relate to national integration policies. We first discuss individual- and country-level factors that presumably have a bearing on school achievement in the context of our study.
1 Individual-level factors in school achievement among immigrant
children
Many immigrant children attend schools in disadvantaged inner city suburbs. School achievement in the schools of such poor suburbs is often quite low. The OECD (2012a) report Untapped Skills has shown that an important source of performance differences between mainstreamers and immigrants in PISA may be related to socioeconomic status which tends to be low in these suburbs; yet, even after adjusting for socioeconomic background, there remained a huge performance gap between immigrant and non-immigrant students across PISA countries.
2 Country-level factors in immigrant school achievement
The high-affluent countries in Europe with Turkish immigrant students do not show large differences in educational expenditure, a known correlate of country differences in cognitive test scores and educational achievement scores (Brouwers et al.2009; Van de Vijver 1997). However, these countries are known to differ in immigration and multiculturalism policies, which could have a bearing on school climate and pupil performance. For example, Hochschild and Cropper (2010) examined the link between national immigration policies and schooling regimes. They claimed that if an immigration policy is able to educate all students fairly well or at least all students get a fair chance for improvement, then most likely such countries would have positive integration policies. Using PISA data, the authors could confirm that the disparity between natives and immigrants turned out to be smallest in more pluralistic countries like Australia and Canada and largest in less pluralistic countries like Switzerland, Germany, and Belgium. Other
international investigations indicate that compared to other OECD countries, minority language children in Germany are particularly disadvantaged in their literacy achievement (OECD 2010). The achievement gap between mainstream and minority language students in Germany is especially pronounced for students with a Turkish language background, even after controlling for social and educa-tional background characteristics (Limbird et al. 2014). Different classification systems of multiculturalism policies have been proposed. Helbling (2013) argues that the observed weak to moderate associations between the systems are due to a lack of overlap of indicators. We chose the migrant integration policy index (MIPEX) (Huddleston et al.2011) as it provides detailed comparative information about educational policies. Studies of the link between MIPEX scores and educa-tional performance of immigrants tested the hypothesis that more liberal policies would favor this performance; results were mixed (Dronkers and De Heus2012; Fossati 2011). Whereas Dronkers and De Heus did not find any link between MIPEX scores and 2006 PISA science achievement of immigrants from 35 countries in 16 Western countries of destination, Fossati (2011) found the expect-ed positive link in various other data sets from OECD countries.
Another system-level variable of secondary schools with potential influence on student outcome is tracking (also known as streaming and stratification). Students are then placed in classes or schools in line with their past performance. For example, countries like Germany and the Netherlands make a split between more university-preparatory streams and more vocationally oriented streams in secondary schools. Reviewing evidence from the USA, Kao and Thompson (2003) found that placing immigrant students in the lower tracks decreases their performance. Assigning immigrant students to higher tracks tends to boost their performance. Schnepf (2007) found the same across ten affluent OECD countries in different educational achievement studies, including PISA. The effect on achievement may be due to better opportunities to learn in higher tracks (Callahan2005).
3 The present study
We examine the role of individual-level characteristics, such as socioeconomic status, and country-level characteristics, such as multicultural policies, to understand perfor-mance differences within and between European countries. In addition, we examine performance of Turkish mainstreamers as a comparison with Turkish immigrants to test the claims that low test performance is an inherent characteristic of linguistic, cultural, and religious groups of immigrants in Western Europe (e.g., Ammermüller 2005; Driessen and Merry2011).
In the study, we hypothesized that (1) reading and mathematics performance of immigrant Turkish students (immigrant Turkish students henceforth) would be lower than mainstream European students from various countries (mainstream European students henceforth); (2) immigrant Turkish students in countries with more inclusive national policies would show higher scores. In addition, we were interested in comparing the influence of individual and country factors on achievement.
4 Method
4.1 Participants
In the study, we categorized students in three subgroups: mainstream Turkish students, immigrant Turkish students, and mainstream European students. Main-stream Turkish students were selected as Turkish students who took the PISA test in Turkey. Immigrant Turkish students were selected as students who took the PISA test outside of Turkey and to whom at least one of the following conditions applied: either born in Turkey, or their mother and/or father born in Turkey, or the language spoken at their home was Turkish. Mainstream European students were students who were born in that country, and their parents were born in that country and the language spoken at home was the main language of the country. The study generally focused on immigrant Turkish students and mainstream European students.
The PISA study employed a two-stage stratified sample design. In the first stage, the sample of schools with 15-year-old students was selected in which each school had a chance of selection proportional to the number of their eligible 15-year-old students. At least 150 schools were selected from each country. In the final stage, students of sampled schools were selected with equal probability (OECD 2013). To be able to correct for sample biases and obtain samples with equal probabilities of students to be included, data on weights are reported by PISA (OECD2009).
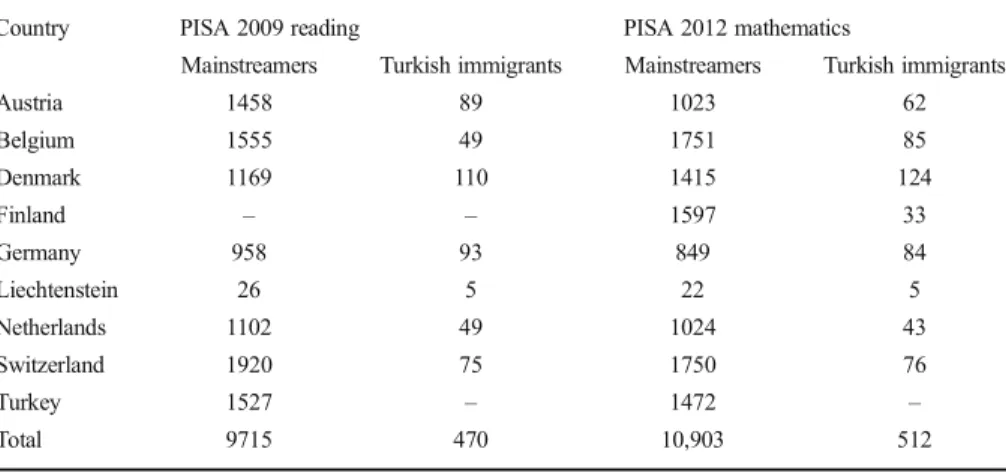
We employed data from 1527 mainstream Turkish students in Turkey, 470 immi-grant Turkish students from seven countries and 9290 mainstream European students from seven countries for the PISA 2009 reading test and 1472 mainstream Turkish students from Turkey, 512 immigrant Turkish students from eight countries and 9431 mainstream European students from eight countries for the PISA 2012 mathematics test (see Table1).
Table 1 Number of mainstream and Turkish immigrant students in PISA 2009 reading test and PISA 2012 mathematics test
Country PISA 2009 reading PISA 2012 mathematics
Mainstreamers Turkish immigrants Mainstreamers Turkish immigrants
Austria 1458 89 1023 62 Belgium 1555 49 1751 85 Denmark 1169 110 1415 124 Finland – – 1597 33 Germany 958 93 849 84 Liechtenstein 26 5 22 5 Netherlands 1102 49 1024 43 Switzerland 1920 75 1750 76 Turkey 1527 – 1472 – Total 9715 470 10,903 512
4.2 Measures
PISA gathered data on student performance by means of reading and mathematics tests respectively. PISA uses a rotated test design with booklets in which each student receives a limited, yet carefully selected number of items, while the booklets are used together to cover a large universe of items (OECD2013). PISA releases samples of these items. As contents of items are necessary to understand the nature of the item bias in the DIF analyses, the present study used released sample items of PISA to define reading and mathematics performance. In the 2009 PISA reading test, there were 9 released items, 5 multiple choice and 4 items with a constructed (open end) response, whereas in the 2012 PISA mathematics test, there were 13 released items, 6 multiple choice and 7 constructed responses. All of these 9 reading and 13 mathematics items were answered by all countries presented. Released items can be accessed at
https://nces.ed.gov/surveys/pisa/pdf/items_reading.pdf and http://www.oecd.
org/pisa/pisaproducts/pisa2012-2006-rel-items-maths-ENG.pdf.
Information on various background variables was collected. Student-level variables were gender, immigration status, and an index of economic, social, and cultural status (ESCS), which is a combination of the highest occupational status of parents, the highest educational level of parents, family wealth, cultural possessions, and home educational resources (OECD2012b 2014).
Among country-level variables (data not included in the PISA data matrix but collected elsewhere), the human development index (UNDP2014) is a summary of key dimensions of human development, such as a long and healthy life, being knowl-edgeable and having a decent standard of living, which is created by the United Nations Development Program. In countries with a higher the human development index, people are expected to have longer life expectancy at birth, more years of schooling, and more purchasing power. The school stratification index, another country-level variable, refers to the age of student selection for higher education and the availability of alternative routes to higher education (Griga and Hadjar 2014). The higher the school stratification index of a country, the fewer the alternatives for students to access to the higher education institutions (e.g., the more difficult it is to move from vocational to university prep education). The other country-level variables were education domain score, anti-discrimination score, and general integration score of countries which were taken from MIPEX III (The Migrant Integration Policy Index). The MIPEX project is led by the British Council and the Migration Policy Group. The MIPEX is a reference guide which measures integration policies of 31 countries by assessing and comparing integration policies of the countries. The MIPEX is an indicator of opportunities presented to migrants to successfully participate in a society by evaluating govern-ments’ commitment to integration. MIPEX assesses whether everyone in that country is guaranteed equal rights, responsibilities, and opportunities. There are several policy areas including education. MIPEX scores are estimated using 148 policy indicators on migrant integration through consultation with top scholars and institutions that give scores ranging from 1 to 3. Then, these rankings converted into 0–100 scale for each dimension. High education domain score refers to a country valuing diversity and using an intercultural approach in schools, curricula, text books, and hiring practices. In such a country, any child could in principle go from kindergarten to university. If she or he has different needs because of immigration experience, she or he could take additional
help. Teachers are trained to recognize those needs. The school and parents have good cooperation. In the same vein, anti-discrimination scores reflect the level of equal chances for all residents. A high anti-discrimination score refers to a country where everyone could benefit from equal opportunities. Discrimination is illegal in all areas of public life including employment, education, public space, housing, and social protec-tion. The state encourages other institutions by positive duties and actions against discrimination. A higher general integration score refers to more inclusive integration policies in all of these migration-related domains (Huddleston et al.2011). All country scores are presented in Table2.
4.3 Data analysis
As a preliminary analysis, psychometric properties of released PISA 2009 reading and PISA 2012 mathematics items were checked by internal consistency (reliability) and item bias (Differential Item Functioning) analyses. Test reliability was assessed by computing Cronbach’s alpha. The item bias analyses were run for mainstream Turkish students versus immigrant Turkish students and mainstream European students in each language group versus immigrant Turkish students who took the test in that specific language using structural equation modeling (SEM). In SEM, invariance analysis was used to identify biased items. Item bias, differential item functioning (DIF), occurs and threatens the comparability when students of different groups (e.g., females and males) show different mean scores on an item despite their identical ability level on the underlying construct (Van de Vijver and Leung1997). A test should perform in the same manner for each group of examinees in order to have scores that can be compared across groups (Zumbo2007). In our categorical data (items are scored as correct or incorrect), two types of invariance were scrutinized: configural and scalar invariance. The configural invariance model tests whether the factor structure is the same across groups, whereas the scalar invariance model tests whether item intercepts and factor loadings are identical across groups. If the difference between configural and the scalar invariance model in terms of incremental type of model fit indices, such as the comparative fit index (CFI) and Tucker Lewis index (TLI), is larger than 0.010, modification indices of intercepts are investigated to identify items that affect this
Table 2 Migrant integration policy indicators, school stratification index, and human development index of countries Country General integration score Education domain score Anti-discrimination score School stratification index Human development index Austria 42 44 40 3 (High) .881 Belgium 67 66 79 3 (High) .881 Denmark 53 51 47 2 (Average) .900 Finland 69 63 78 1 (Low) .879 Germany 57 43 48 3 (High) .911 Netherlands 68 51 68 3 (High) .915 Switzerland 43 45 31 2 (Average) .917
difference, possibly followed by the removal of these items (Cheung and Rensvold
2002).
Following the assessment of DIF, in order to test cross-cultural differences, first, item-level performance of mainstream Turkish students versus immigrant Turkish students and mainstream European students versus immigrant Turkish students were visualized. Then, cross-cultural performance differences of mainstream European stu-dents and immigrant Turkish stustu-dents on reading and mathematics were tested in an analysis of covariance (ANCOVA), controlling for the index of economic, social, and cultural status. The effect sizes (Cohen’s d) of performance difference before and after removing the effect of ESCS were compared. Cohen’s d is calculated as mean differences between two groups divided by their pooled standard deviation. The same analysis was conducted to compare mainstream Turkish and immigrant Turkish students.
Following the comparison of mean scores, we explored the nature of the perfor-mance differences observed between mainstream European students and immigrant Turkish students conducting multilevel analysis which identified factors predicting reading and mathematics performance of mainstream European students and immi-grant Turkish students. In the multilevel analysis, dependent variables were reading and mathematics performance measured by released PISA items, student-level independent variables were gender, immigration status, and an index of economic, social, and cultural status while country-level independent variables were the human development index, the school stratification index, education domain score, general integration score, and anti-discrimination score. For the multilevel analyses MPLUS 7.11 was used. Mainstream Turkish students were not included in the analysis as country level variables were not present for Turkey. All variables were standardized prior to the analysis to facilitate the interpretation of the coefficients. The scores on the dependent variables were estimated using the PARSCALE 4.1 program by fitting a three-parametric logistic item response theory model, which takes into account guessing, as some of the items were multiple choice items (Muraki and Bock 1997). In a final stage, the robustness of our findings was examined by reconducting multilevel analyses, now using plausible reading and mathematics values instead of estimated reading and mathematics performance by released PISA items and using sample weights reported by PISA. As PISA uses a rotational item booklet design, PISA reports five plausible values for each student based on each subject domain. With such a complex data structure, it is necessary to use special programs, such as MPLUS, which take into account these plausible values (Muthen and Muthen2012; Rutkowski et al. 2010). Therefore, multilevel analysis using plausible values and sample weights were again conducted with MPLUS.
5 Results
5.1 Psychometric properties and item bias analysis
Internal consistency analysis The values of Cronbach’s alpha reliability coefficients in the PISA 2009 reading test showed a median value of 0.717. For PISA 2012
mathematics test, the median value was 0.745. These values are acceptable for this study, notably as these scores are not used for individual, high-stakes decisions (Cicchetti1994).
Item bias analysis In item bias analysis using SEM, response patterns of mainstream Turkish students versus immigrant Turkish students were first compared for reading and mathematics items. Then, for each language group, we investigated response patterns of mainstream European students and immigrant Turkish students who took the test in that specific language.
For the PISA 2009 reading test, the configural and the scalar models were run for mainstream Turkish students versus immigrant Turkish students. As Table 3
shows, the configural invariance model had high CFI and TLI values, implying that the model without any parameter constraints worked well. However, the difference between the CFI and TLI values of the configural and scalar invariance models were both larger than 0.010, suggesting the presence of item bias. Mod-ification indices suggested that item eight (R458Q01) might be biased. After releasing the item parameters of this item, evidence of scalar invariance was found. We identified two possible sources of relatively low performance of mainstream Turkish students: (1) the concept of telecommuting (working from home) does not occur generally in the Turkish context; (2) the translation of the second paragraph of the passage to Turkish was not natural, which challenged the readability of the text. An analysis of the mathematics subtest provided evidence for the scalar invariance of the instrument; no item bias was detected.
In an item bias analysis of each language group, response patterns of mainstream European students in each language group versus immigrant Turkish students who took the test in that specific language were investigated for both the reading and mathematics test. We took language groups together to obtain adequate sample sizes in the Turkish immigrant groups. Language groups were Danish, Dutch, French, and German. Be-sides, the Finnish group was also included in mathematics as data from this country were only available in this subject domain. Analyses of both the reading and mathe-matics subtests yielded evidence to support their scalar invariance; no item bias was detected.
5.2 Mapping cross-cultural performance differences
Item-level percentage correct values We visualized item-level performance of main-stream Turkish students versus immigrant Turkish students and item-level performance of mainstream European students versus immigrant Turkish students in these countries in Figs.1and2. In reading, mainstream Turkish students had higher percentage correct values than immigrant Turkish students for each of the nine items, except for the fifth item. Similarly, mainstream European students had systematically higher percentage correct values than immigrant Turkish students for all nine items. In mathematics, mainstream Turkish and immigrant Turkish students generally had rather similar percentage correct values across all 13 items. However, between mainstream European and immigrant Turkish students, mathematics performance differences were observed in favor of mainstream European students.
Mean performance differences In order to test the first hypothesis, an ANCOVA was conducted with reading and mathematics total test scores as dependent variables separately, country as independent variable and the index of economic, social, and cultural status as covariate. Relevant assumptions (i.e., bivariate normality between residual scores and ESCS, and absence of any interaction between the outcome variable and the covariate across groups) were tested. Normality test results (Kolmogorov-Smirnov test) showed in many countries that the data followed a non-normal distribu-tion, especially for mainstream students. As ANCOVA with two group single factor is known to be robust for non-normality, generally when skewness from one group was not in the opposite direction from the other or one was quite extreme, we concluded that these mixed results would not challenge the interpretation of the ANCOVA. A test of Table 3 Item bias analysis by structural equation modeling for PISA 2009 reading and PISA 2012 mathematics
Language version (country) Model χ2/df Δχ2/Δdf RMSEA CFI ΔCFI TLI ΔTLI Reading: mainstream Turkish
students vs other countries
Configural 1.234 .015 .994 .992
Scalar 1.708*** 4.020*** .027 .980 .014 .977 .015 Item8
released
1.335* 2.239* .018 .991 .003 .989 .004 Reading: mainstream vs Turkish
students: Danish Configural 1.271 .021 .989 .985 Scalar 1.206 .707 .018 .990 −.001 .989 −.004 Dutch Configural 1.517** .022 .992 .989 Scalar 1.629** 2.607* .024 .989 .003 .987 .002 French Configural 1.740*** .036 .979 .972 Scalar 1.507** .523 .030 .983 −.004 .981 −.009 German Configural 2.299*** .025 .988 .984 Scalar 2.347*** 3.146** .026 .986 .002 .983 .001 Mathematics: mainstream Turkish
students vs other countries
Configural 1.276* .017 .993 .991
Scalar 1.611*** 4.578*** .025 .983 .010 .981 .010 Mathematics: mainstream vs
Turkish students: Danish
Configural 2.313*** .041 .943 .932 Scalar 2.260*** 1.628* .040 .941 .002 .934 −.002 Dutch Configural 1.485*** .020 .991 .989 Scalar 1.449** 1.067 .020 .991 .000 .990 −.001 Finnish Configural 1.515*** .026 .978 .974 Scalar 1.333** .630 .021 .985 −.007 .983 −.009 French Configural 1.339** .024 .984 .981 Scalar 1.379** 1.852** .025 .981 .003 .979 .002 German Configural 1.618*** .020 .990 .988 Scalar 1.544*** .671 .018 .991 −.001 .990 −.002 *p < .05; **p < .01; ***p < .001
homogeneity of regression slopes test results showed that there were no major deviations.
The effect size (Cohen’s d) of the performance difference before removing the ESCS in Table4shows that Cohen’s d values had a median value of 0.96 for reading and 0.78 for mathematics. Mainstream students scored higher; there was a significant perfor-mance difference with a large effect size. Therefore, the hypothesis that the reading and mathematics performance of immigrant students are lower than mainstream European students was confirmed. After removing effects of ESCS, Cohen’s d had a median value of 0.65 for reading and 0.58 for mathematics. So, economic, social, and cultural status differences in each country had an important influence on reading and Fig. 1 Percent-correct-values for PISA 2009 released reading items
100 90 "' 70 "' 50 40 30 20 10 100 90 "' 70 100 90 "' 70 "' 50 40 "' 20 10 100 90 "' 70 "' 50 40 30 20 10 Turkey Austria Denmark
~ ~
; , , . . . , _ , • - ~ ---•--·.
...
.,,'
... ' ,_, , Netherlands ', 1 2 3 4 5 6 7 8 9 - Turkish Students in Turkey - • -Turkish Students in 00,e, Countries items - Austrians - • -Turkish Students inAusfria items ~ Danish -• -Turkish Students in Denmark items ~ Dutch - • -Turkish Students In Netherlands items 100 90 "' All Countries 70~
~
~ Mainstream Students - • -Turkish Students in these Countries 10 ... , , 0 +---+---,-+---+--"--e--+--+->---< items 100 90 "' 70 "' 50 3 4 S 6 7 8 9 Belgium7'
~
30 .... . . , , ... , .. ~ - _,,,. .. • 20 ... .,,.. .. . . , , 40 10 ... 100 90 "' 70 "' 50 40 "' 20 10 100 90 "' 70 "' 50 1 2 3 4 S 6 7 8 9 Germany 3 • 6 7 Switzerland ... ,,.:
;,"' .. ·. . ~,,.
20 . . _..,, ' " ' ~ , • - - -... , 10 .. _ , , 1 2 3 4 5 6 7 8 9 - Dutch-Speaking CommlA'lity • · •· • French-Speaking Community - • -Turkish Students in Belgium items - + -German - • -Turkish Students in Germany items - + -German-Speakl'I Commu-iity • • •· · FrencJl.Speaking Commmity - • -Turkish Students inSwinerland itemsmathematics performance difference between mainstream European students and im-migrant Turkish students as there was a substantial decrease in overall Cohen’s d values after correction (on average 0.26).
When we compared mainstream Turkish students and immigrant Turkish students in reading and mathematics, it was found that mainstream Turkish students were more Fig. 2 Percent-correct-values for PISA 2012 released mathematics items
100 ,0
.,
70 60 50 '° 30 20 10 100 ,0 80 70 60 50 '° 30 10 1 2 3 4 5•
Turkey 7 8'
10 11 Austria ~ Turkish Students in Turkey - • -Turtdsh Students in 0th~ Countries items - Austrians - • -Turkish Students in Austria 1 2 3 4 5 6 7 8 9 ro 11 ll 13 items 100 ,0 ., 70 60 50 '° 30 20 10 100 ,0.,
70 60 50 '° 30 20 10 Denmark 1 2 3 4 s 6 1 a 9 ro 11 u n Netherlands 0 +-+-,-e--,---4--+--+--+---+--+---+oo 100 ,0.,
70 60 50 '° 30 20 10 1 2 3 4 5 6 7 8 9 ro ll U 13 Finland 1 2 3 4 s 6 7 s 9 ro u u u ~ Danish - • -Turkish Students in Denmark items ~ Dutch - • -Turkish Students in Netherland items ~ Finish - t i -Turkish Students in Finland items 100 ,0.,
70 60 50 '° 30 20 10 100 ,0.,
70 60 50 20 10 1 2 3 All Countries ~ Mainstream Students - • -Turkish Students in these Court:rles items 4 5 6 7 8 9 10 11 12 13 Belgium - Dutch-Speaking Commmity • • •·· French-Speaking Commmity - • -Tur1dsh Students inBelgilall 0 +-+-,f-+--+--+--+--+-+-+-,f-+·11+---< 100 ,0.,
70 60 50 '° 30 20 10 1 2 3 4 S 6 7 8 9 10 11 12 13 Germany - • -Turkish Students in Germany 0 +-+-+-+-+-+-+-,_,_,_,_- '--, items 100 ,0 80 70 60 50 '° 30 20 10 1 2 3 4 S 6 7 8 9 10 11 12 13 Switzerland 1 2 3 4 5 6 7 8 9 10 11 12 13 ~ German-Speaki~ Commmity • ••·· French-Speaking Comm...-iity - • -Turkish Students inSwitzerlard itemsTa b le 4 Cohe n’ s d re su lts fo r P IS A 2 009 re ad ing an d PISA 2 012 ma thematics b efore and after cor re cti on for in dex of econ omi c, social, and cultural status Reading M athemati cs Ma in str ea m st ude nts Immig ra n t st ude nts Cohe n’ sd M ai n st re am st ude nt s Im mig ra n t stu d ents Cohe n’ sd Co untr y M N M N B ef or e cor re ction A ft er co rr ec tio n M N M N B ef or e cor re ct ion A ft er co rr ec tio n Austria − .38 1 442 − .9 9 8 8 .7 9 .48 − .34 1 018 − 1.2 8 62 .97 .65 Be lgi u m (Dutc h-spe ak in g comm unit y ) .1 4 1 027 − .8 7 1 9 1 .1 4 .74 − .10 1 210 − 1.2 9 60 1.2 0 .79 Belgi u m (French-s peaki n g community) .13 524 − .8 3 2 7 1 .0 5 .69 − .50 5 23 − 1.1 3 21 .61 .18 Denmark − .2 1 1 16 6 − 1. 04 10 8 1.0 6 .75 − .54 1 405 − 1.4 1 12 3 .96 .58 Fin la nd –– – – – – − .41 1 530 − .8 8 3 2 .53 .3 5 Ge rm an y .00 94 9 − .7 7 9 2 .8 6 .55 − .29 8 44 − 1.0 4 78 .78 .50 Netherlands .02 1 100 − .6 2 4 8 .7 5 .41 − .20 1 023 − .9 3 4 3 .77 .6 6 S w itz er lan d (Fre n ch -spe ak ing co m mu n ity ) − .0 2 5 6 3 − .9 7 1 4 1 .1 3 .91 − .31 6 25 − .8 3 1 9 .54 .2 8 Swit ze rla n d (Ge rman -s pea k in g com mun ity) − .07 1 351 − .7 2 5 7 .7 8 .54 − .0 9 111 2 − 1.0 0 54 .93 .76 Me dia n − .0 1 − .8 5 .9 6 .65 − .31 − 1.0 4 .78 .58 Tu rk ey − .2 9 − .8 6 .7 4 .95 − 1.10 − 1.1 5 .07 .33
successful, especially in reading. As economic, social, and cultural status index values of immigrant Turkish students were higher than those of mainstream Turkish students on average, correction using this factor made the difference even bigger (see Table4).
5.3 Understanding and explaining between‐ and within-country differences In order to better understand the nature of the cross-cultural differences, we conducted a multilevel analysis (random intercepts, random slopes) which identified factors predicting reading and mathematics performance of mainstream European students and immigrant Turkish students. A caveat is needed here. Like in all regression-based models, the associations tested between the independent and the dependent variables could be directly influenced, mediated, or moderated by other unmeasured predictors so that the interpretation of the coefficients in our model refers to effects in the context of the included set of predictors.
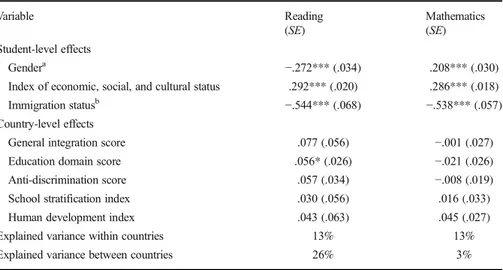
For predicting reading performance, the dependent variable was reading perfor-mance of students measured by released items. Table5indicates that gender, the index of economic, social, and cultural status, and immigration status were significant predictors of reading performance at student level. Girls, students with higher econom-ic, social, and cultural status, and mainstream European students showed a higher reading performance. Among country-level variables, the education domain score was statistically significant. Country-level reading results implied that student performance was higher in countries with better educational integration. General integration score, anti-discrimination score, the human development index, and school stratification index showed no relation with reading performance.
Table 5 Multilevel analysis results for PISA 2009 reading and PISA 2012 mathematics test
Variable Reading (SE) Mathematics (SE) Student-level effects Gendera −.272*** (.034) .208*** (.030)
Index of economic, social, and cultural status .292*** (.020) .286*** (.018)
Immigration statusb −.544*** (.068) −.538*** (.057)
Country-level effects
General integration score .077 (.056) −.001 (.027)
Education domain score .056* (.026) −.021 (.026)
Anti-discrimination score .057 (.034) −.008 (.019)
School stratification index .030 (.056) .016 (.033)
Human development index .043 (.063) .045 (.027)
Explained variance within countries 13% 13%
Explained variance between countries 26% 3%
*p < .05; **p < .01; ***p < .001
aCoding gender: 0 = female; 1 = male b
Table5indicate that gender, the index of economic, social, and cultural status, and immigration status were also significant at student-level in predicting mathematics performance of students. Boys were more successful than girls, students with high economic, social, and cultural status were more successful than students with low economic, social, and cultural status, and mainstream European students were more successful than immigrant Turkish students. No country-level variables showed signif-icant associations with mathematics performance. Therefore, the hypothesis that main-stream and immigrant students in countries that use more inclusive national policies are more successful in math was not confirmed. Finally, for all the analysis described above, interactions of country-level variables with immigration status were analyzed; however, no interaction was found.
5.4 Cross-validating multilevel regression results
The multilevel analysis we conducted used five reading and mathematics plausible values and sampling weights reported by PISA. The dependent variables were the reading and mathematics plausible values instead of IRT ability estimations performed using released items. The analyses were conducted to evaluate the robustness of the previous results (see Table 6). The results related to student-level variables did not change for reading or mathematics. Gender, the index of economic, social, and cultural status, and immigration status were still significant (and had the same sign) at student-level in predicting reading and mathematics performance of students. There was no difference between country-level results in terms of mathematics either, but we ob-served some differences related to country-level variables only in reading performance. In the analysis with reading performance estimation with released items, the education domain score was statistically significant in the prediction, however in the second Table 6 Cross-validation of multilevel analysis results with plausible values
Variable Reading (SE) Mathematics (SE) Student-level effects Gendera −36.581*** (4.052) 15.660*** (2.755)
Index of economic, social, and cultural status 32.124*** (1.629) 30.408*** (1.620)
Immigration statusb −58.913*** (6.399) −46.671*** (5.161)
Country-level effects
General integration score 1.218 (3.936) −.384 (5.030)
Education domain score 2.704 (5.495) −1.194 (4.086)
Anti-discrimination score .402 (30.966) −.916 (38.590)
School stratification index −2.770 (4.964) −1.333 (5.202)
Human development index 6.123* (3.114) 4.595 (5.091)
Explained variance within countries 20% 16%
Explained variance between countries 14% 6%
*p < .05; **p < .01; ***p < .001
aCoding gender: 0 = female; 1 = male b
analysis conducted by plausible values, the human development index was significant. The lack of convergence on country-level reading results could be a consequence of low power (i.e., the small sample size at country level).
6 Discussion
We were interested in understanding achievement differences in PISA reading and math scores of Turks in various European countries and Turkey. The study fits in a line of acculturation studies that tries to understand differences in acculturation outcomes of groups from one country of origin in different countries of destination (Sam and Berry2006). The strong methodological characteristics of the PISA studies, such as probability sampling of schools and careful translation procedures, make the data attractive for comparisons of groups within and between countries. In line with these strong methodological character-istics, we found adequate internal consistencies and high levels of invariance of the data.
One of the main findings of this study was that there was a large reading and mathematics performance difference between mainstream and immigrant students. When the economic, social, and cultural status of students was controlled, the difference became smaller; however, there were still medium-sized performance differences remaining. In addition, multilevel analysis showed that students with higher scores on the index of economic, social, and cultural status showed higher performance on both reading and mathematics. As this index is a combination of educational, occupational, and wealth level of a student’s family and cultural and educational resources available at home, our results suggest that having more of these resources is important for better performance. This result is consistent with the literature (Marks et al.2006; Shin et al.2013). In both the PISA 2009 and 2012 data, there is a huge inequality (large in terms of Cohen’s d) in socioeconomic status among mainstream and immigrant students. Our study shows that the mainstream-immigrant performance gap has at least partly a background in socio-economic differences of the groups. A gain in sociosocio-economic status of immigrant groups would presumably improve educational outcome of immigrant population.
We investigated how differences in human development level, school systems, and migration policies, measured by MIPEX indicators, might be related to reading and mathematics performance of immigrant and mainstream European students. MIPEX education domain scores and human development index could be related to differences in reading performance as a result of two differently estimated student performance methods, using both observed scores on released items and plausible values provided by the OECD, respectively. None of the country level variables were found to be related with mathematics performance. In the analysis of observed reading performance (using released items), countries with higher MIPEX results in education showed higher reading performance in PISA. As a high MIPEX education score refers to a more inclusive integration policy using an intercultural approach in schools, curricu-lum, textbook and hiring practices, countries with better integration policies were more successful. In the cross-validation analysis, the human development index was also found to be positively related to reading performance of the countries. In a country with a higher human development index, people are expected to have longer life expectancy at birth, more years of schooling, and more purchasing power. Additionally, this study showed that these people got higher scores on PISA reading performance. In
conclusion, in addition to student-level variables as socioeconomic status and immi-gration status, country-level variables as education domain scores and the human development index could be related to differences in reading performance.
Our study revealed interesting feature about the achievement gap between main-stream Turks and Turkish immigrants. The gap was about 0.62 SD after correction for background variables in both reading and math. We also compared performance differences between Turkish mainstream and immigrant students after correction for individual-level background variables. It is important to note that whereas such a correction reduced the achievement gap in an immigrant context, the opposite was found in the comparison of the two Turkish groups. These groups differ in socioeco-nomic status, but also in their type of education, such as curriculum contents and pedagogy. We would argue that the increment of the achievement differences after controlling for socioeconomic status could be related to the differences in education between Turkey and the Western-European countries. Educational expenditure is considerably lower in Turkey (2.9% of GDP in 2006) than in the Western-European countries of our study (usually well over 5%) (see, e.g., https://www.cia.
gov/library/publications/the-world-factbook/rankorder/2206rank.html). Therefore, it
could well be that the increase in performance differences after filtering out socioeconomic differences reflects the differences in school resources. Further studies would be needed to pinpoint which educational features, such as curriculum contents, pedagogy, or teacher education, play a role in these country achievement differences.
7 The complex role of language in the achievement gap
There is one factor that requires more scrutiny in the explanation of mainstream— immigrant differences: language. The PISA data set does not have sufficient information about language proficiency and usage to examine its role. Yet, this role has been frequently discussed. McNamara (2011) noted thatBThe PISA reports explicitly link the Bpoor^ national performance of Austria to the presence of minority language students and constructs the multilingualism of immigrant students as a problem requir-ing remediation^ (p. 437). The lower performance by immigrants is then taken to be due to the immigrant languages obstructing learning in schools. We find this view simplistic even if it is widely shared. Poor knowledge of the medium of instruction in school will have an obvious, negative effect on the learning process. This situation applies to many immigrant pupils. However, it is important to realize that the Turkish language as such does not create a disadvantage for immigrants, but the disadvantage largely arises because of two other factors. First, Turkish immigrant children often grow up in low socioeconomic strata and they are exposed in their first years to a level of Turkish that is not very rich and sophisticated, which has implications for their cognitive development. Second, most schools in Western Europe are well equipped to teach the mainstream language to immigrant pupils, but cannot exploit a child’s knowledge of an immigrant language to facilitate learning. This lack is in line with the dominant view in Western education that bilingualism, involving an immigrant language, is not an asset, as shown by the Language Rich Europe project (Extra and Yagmur2012).
Overall, we found and explained achievement differences between mainstream and immigrant students. In all countries, immigrant students were less successful than their
mainstream peers. Group differences in socioeconomic status play an important role in these differences. Immigrant students who come from families with higher socio-economic status can compete with their mainstream peers to a certain point and show smaller achievement differences. Diminishing the socioeconomic gap in a short period of time is not easy. As our study suggested, students in countries with integration policies in which upward social mobility of immigrant students is easier were more successful. Therefore, nationwide inclusive policies could be key to increase student achievement.
8 Limitations
In this study, there were some limitations to mention. When we conducted multilevel analyses, for reading we had eight countries, whereas in mathematics we had nine countries. Although we are aware that more countries are needed for multilevel analysis, these countries were the only countries in which Turkish immigrants could be identified from the PISA data and we wanted to go beyond an individual-level analysis that could not adequately deal with country-level variables. Additionally, given the putatively pivotal role of language in the achievement gap, it would be good to measure fluency in the ethnic and mainstream language in much greater detail in future studies so that we can better understand the role of language and suggest policies to alleviate the gap. Also, the proportion of variance explained by country in the multilevel analyses was rather small. We might have found more robust effects if we could have included more countries or countries with more variation in educational performance. Obviously, our analysis was necessarily limited to PISA countries with Turkish immigrants. Finally, availability of the age of arrival information for all immigrant students might be useful. The information was not available for the students in our data sets so that we could not identify its effect on learning the new mainstream language and on reading and mathematics achievement. Another limitation was that our results had the potential that any error or biases from prior analysis steps, such as IRT ability estimation, were transferred to the next steps, the multilevel analyses.
Acknowledgements This paper is a part of a research project supported by the Scientific and Technological Research Council of Turkey (TUBITAK) with program no. 2219. Any opinions expressed here are those of the authors and do not necessarily reflect the views of the TUBITAK.
References
Ammermüller, A. (2005). Poor background or low returns? Why immigrant students in Germany perform so poorly in PISA. Discussion Paper No. 05–18, Retrieved fromhttp://opus.zbw-kiel.de/volltexte/2005/2908/pdf/dp0518. pdf.
Brouwers, S. A., Van de Vijver, F. J. R., & Van Hemert, D. A. (2009). Variation in Raven’s progressive matrices scores across time and place. Learning and Individual Differences, 19, 330–338. doi:10.1016/j. lindif.2008.10.006.
Callahan, R. M. (2005). Tracking and high school English learners: limiting opportunity to learn. American Educational Research Journal, 42, 305–328. doi:10.3102/00028312042002305.
Cheung, G. W., & Rensvold, R. B. (2002). Evaluating goodness-of-fit indexes for testing measurement invariance. Structural Equation Modeling: A Multidisciplinary Journal, 9, 233–255. doi:10.1207 /S15328007SEM0902_5.
Cicchetti, D. V. (1994). Guidelines, criteria, and rules of thumb for evaluating normed and standardized assessment instruments in psychology. Psychological Assessment, 6, 284–290. doi:10.1037/1040-3590.6.4.284. Driessen, G., & Merry, M. S. (2011). The effects of integration and generation of immigrants on language and
numeracy achievement. Educational Studies, 37, 581–592. doi:10.1080/03055698.2010.539762. Dronkers, J., & De Heus, M. (2012). The educational performance of children of immigrants in sixteen OECD
countries (No. 1210). London, United Kingdom: University College London.
Extra, G., & Yagmur, K. (Eds.). (2012). Language rich Europe. Trends in policies and practices for multilingualism in Europe. Cambridge: Cambridge University Press / British Council.
Fossati, F. (2011). The effect of integration and social democratic welfare states on immigrants’ educational attainment: a multilevel estimate. Journal of European Social Policy, 21, 391–412.
Griga, D., & Hadjar, A. (2014). Migrant background and higher education participation in Europe: the effect of the educational systems. European Sociological Review, 30, 275–286.
Helbling, M. (2013). Validating integration and citizenship policy indices. Comparative European Politics, 11, 555–576. doi:10.1057/cep.2013.11.
Hochschild, J. L., & Cropper, P. (2010). Immigration regimes and schooling regimes: which countries promote successful immigrant incorporation? Theory and Research in Education, 8, 21–61. doi:10.1177 /1477878509356342.
Huddleston, T., Niessen, J. Chaoimh, E. N., & White, E. (2011). Migrant Integration Policy Index III. Brussels, Belgium: British Council and Migration Policy Group.
Kao, G., & Thompson, J. S. (2003). Racial and ethnic stratification in educational achievement and attainment. Annual Review of Sociology, 29, 417–442. doi:10.1146/annurev.soc.29.010202.100019.
Limbird, C. K., Maluch, J. T., Rjosk, C., Stanat, P., & Merkens, H. (2014). Differential growth patterns in emerging reading skills of Turkish-German bilingual and German monolingual primary school students. Reading & Writing, 27, 945–968. doi:10.1007/s11145-013-9477-9.
Marks, G. N., Cresswell, J., & Ainley, J. (2006). Explaining socioeconomic inequalities in student achieve-ment: the role of home and school factors. Educational Research and Evaluation: An International Journal on Theory and Practice, 12, 105–128. doi:10.1080/13803610600587040.
McNamara, T. (2011). Multilingualism in education: a poststructuralist critique. The Modern Language Journal, 95, 430–441.
Muraki, E., & Bock, R. D. (1997). PARSCALE: IRT based test scoring and item analysis for graded open-ended exercises and performance tasks. Chicago: Scientific Software. Inc..
Muthen, B. O., & Muthen, L. K. (2012). Mplus (Version 7.1). California. Los Angeles.
OECD (2009). PISA Data Analysis Manual: SAS, Second Edition. OECD Publishing. doi:10.1787 /9789264056251–4-en
OECD (2010). PISA 2009 results: overcoming social background: equity in learning opportunities and outcomes (volume II). Paris, France: OECD Publishing, doi:10.1787/9789264091504-en
OECD (2012a). Untapped skills: realising the potential of immigrant students. Paris, France: OECD Publishing, doi:10.1787/9789264172470-en
OECD (2012b). PISA 2009 Technical Report, PISA. Paris, France: OECD Publishing, doi:10.1787 /9789264167872-en
OECD (2013). PISA 2012 assessment and analytical framework: mathematics, reading, science, problem solving and financial literacy. Paris, France: OECD Publishing, doi:10.1787/9789264190511-en
OECD. (2014). PISA 2012 technical report, PISA. Paris: OECD Publishing.
Rutkowski, L., Gonzalez, E., Joncas, M., & von Davier, M. (2010). International large-scale assessment data issues in secondary analysis and reporting. Educational Researcher, 39(2), 142–151.
Sam, D. L., & Berry, J. W. (Eds.). (2006). The Cambridge handbook of acculturation psychology. Cambridge: Cambridge University Press.
Schnepf, S. V. (2007). Immigrants’ educational disadvantage: an examination across ten countries and three surveys. Journal of Population Economics, 20, 527–545. doi:10.1007/s00148-006-0102-y.
Shin, S. H., Slater, C. L., & Backhoff, E. (2013). Principal perceptions and student achievement in reading in Korea, Mexico, and the United States educational leadership, school autonomy, and use of test results. Educational Administration Quarterly, 49, 489–527.
UNDP (2014). Human Development Index and its components. Retrieved fromhttp://hdr.undp. org/en/content/table-1-human-development-index-and-its-components.
Van de Vijver, F. J. R. (1997). Meta-analysis of cross-cultural comparisons of cognitive test performance. Journal of Cross-Cultural Psychology, 28, 678–709. doi:10.1177/0022022197286003.
Van de Vijver, F. J. R., & Leung, K. (1997). Methods and data analysis of comparative research. Thousand Oaks: Sage. Zumbo, B. D. (2007). Three generations of DIF analyses: considering where it has been, where it is now, and