A M O D I F I E D M E T H O D FOR D E T E R M I N A T I O N OF H I P P U R I C A C I D IN U R I N E B Y H P L C
İDRARDA HİPPURİK ASİT TAYİNİNDE KULLANILABİLECEK BİR MODİFİYE HPLC YÖNTEMİ
Yalçın DUYDU* Sinan SÜZEN* Nevin VURAL* Nurten ERDEM* Handan UYSAL** * University of Ankara, Faculty of Pharmacy, Department of Toxicology, 06100 Tandoğan, Ankara ** The National Institute of Occupational Safety and Health, Etimesgut, Ankara, Turkey
ABSTRACT
In the present study, a fast and simple HPLC method has been described to determine urinary hippuric acid (HA). This modified method has provided an excellent recovery (101.9 %) and linearity (R2= 0.9767) for HA in urine. The coefficient of variation (CV) was also calculated in order to determine the reproducibility of this method and an adequate value has been observed. The validity of the present method was also tested by using four urine samples collected from toluene exposed painters.
Key words: Hippuric acid, urine, HPLC method ÖZET
Bu çalışmada, idrardaki hippuric asit' in tayininde kullanılabilecek hızlı ve basit bir HPLC yöntemi modifiye edilmiş ve tanımlanmıştır. Bu yöntem kullanılarak yapılan idrardaki HA
ölçümlerinde oldukça iyi geri kazanılabilirlik (% 101.9) ve doğrusallık (R2= 0.9767) değerleri elde edilmiştir. Yöntemin tekrarlanabilirliğinin gösterilebilmesi amacı ile varyasyon katsayıları da hesaplanmış ve oldukça iyi değerler elde edilmiştir. Ayrıca yöntemin geçerliliği de, toluene maruz kalan dört işçiden alınan idrarlarda yapılan HA tayinleri ile test edilmiştir.
INTRODUCTION
Toluene is still one of the most and widely used organic solvent in industry (1). Therefore occupational exposure to toluene has been continued to be a health problem for the workers associated with toluene as it was in the past (2,3,4,5,6). Related with the extensive use of toluene in industry, the biological monitoring studies of toluene have become more important also in our country especially in recent years.
Toluene is absorbed into the body mainly through the respiratory tract and then oxidized in the liver microsomes mainly (68%) to hippuric acid (HA) (7). Small quantities of o-cresol and p-cresol can also be detected in the urine (8,9,10). The metabolic pathway of toluene can be seen in Figure 1.
Figure 1. The metabolism of toluene
Determination of HA in urine is one of the most used and easiest way in monitoring the occupational toluene exposure (11). Therefore several determination procedures including HPLC methods have been developed in order to determine HA in urine (12,13,14,15). Nevertheless almost each HPLC method is time consuming and needs a well-equipped high-performance liquid chromatograph.
The method of Ogata et all has emerged as the simplest one among the others (16,17,18). In the present study, we modified the Ogata's HPLC method (17) for determination of urinary HA in order to make it more simple and rapid. This modified procedure needs only basic HPLC components such as UV-visible detector, one pump and a C18 column. The procedure is performed at ambient temperature and no automation is required. The total HPLC assay takes 8
Hippunc acid CH3
Toluene Very small amount of o-cresol and p-cresol
Benzoic acid NH—CH2—COOH
c—
Conjugation Glycin COOH + H2N -CH2 -COOHmin for urinary HA. The simplicity of this method makes the urinary determination of HA suitable for the average equipped laboratories in underdeveloped and developing countries.
The method was also validated with urine samples collected from occupationally toluene-exposed workers.
MATERIALS AND METHODS
HPLC apparatus: The chromatography system consisted of a HPLC pump (Jasco,
Model PU-980 Intelligent HPLC pump), a UV/VIS detector (Jasco, Model UV-970/975, Intelligent UV/VIS detector) and a LiChrosorb RP18-5, 200 x 4.6 mm column (HICHROM).
Urine samples: The urine samples of the control group were randomized among the
officers living in Ankara. Moreover we collected additionally four urine samples from the toluene-exposed painters in order to use them in the preliminary study of toluene exposure.
Reagents: HA and creatinine was purchased from Sigma. The other chemicals were
obtained from Merck.
Chromatographic conditions: The HPLC mobile phase consisted of a mixture of 5mM
KH2P04 (pH: 2.5) / CH3CN (90/10). A variable flow rate was used throughout the monitoring of
the effluent. The intelligent HPLC pump provided us a programmable flow variation as could be seen in Figure 2. The effluent was monitored at 225 nm and the total assay was carried out at the ambient air temparature.
Preparation of urine specimens: 1 ml methanol was added to 1 ml of urine specimens
and centrifuged at 2500 rpm for 5 min. Finally 3 1 of the supernatant was injected into the HPLC (17).
Calibration curve: Stock solution of HA was prepared in methanol. Calibration
standards were prepared by diluting the stock solution in both water and control urine to obtain concentrations of 0.25, 0.5, 0.75, 1, 1.5 and 2 mg/ml for HA (Fig 3).
Recovery studies: 1 ml of normal urine was prepared in order to obtain 2 mg /ml of HA
and were added into an equal volume of methanol. The final solution containing 1 mg/ml of HA was centrifuged at 2500 rpm and 3 1 of the supernatant was injected into the HPLC. The concentration of the HA in the control urine was also determined before the recovery studies because of the presence of HA in normal urine. The recovery rate is the mean of five determinations (Table 1).
Reproducibility: HA containing standards (0.25 and 1 mg/ml) were analyzed in 5 separate runs in order to calculate the coefficients of variation (CV). The results of the reproducibility studies can be shown in Table 2.
Validity of our method: In this study, we also arranged a limited preliminary biological monitoring study in order to test the validity of our method. Accordingly we collected urine samples from four toluene-exposed painters. The officers living in Ankara selected as the control group and ten urine samples were randomized among them. As was mentioned before, an increment of HA in urine should be observed in toluene exposed workers.
Since spot urine samples were used in this study the problem of concentration - dilution effects of urine might cause evaluation errors. Trevisan reported that (19) concentration in a single urine sample, without adjustment for concentration - dilution effects, is unacceptable because of the wide intrainterindividual variation in urine output. Therefore all of the urinary values were adjusted to creatinine and was measured according to the Baselt method (20).
The values of control and exposed workers were compared by Student's t-test and a p value of 0.05 denoted significance.
RESULTS AND DISCUSSION:
In this study numbers of different proportions of the mobile phase components were experienced. The proportion of 90/10 (KH2PO4/CH3CN) was provided us with the best peak
shapes. We also tried some different pH values but due to the typical peak shape problems (tailing and rounded peaks) we decided to use the pH value of 2.5 as was previously recommended by Ogata et al (17). According to these preliminary studies it is easy to say that the mobile phase (5 mM KH2P04 (pH: 2.5) / CH3CN (90/10)) that is recommended by Ogata et
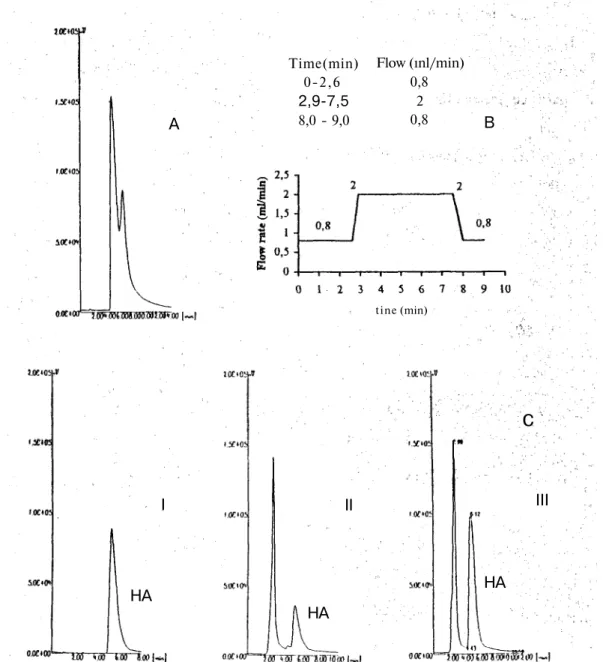
al (17) seems suitable also for our LiChrosorb RP 18-5, 200 x 4.6 mm column. Nevertheless these preliminary studies mentioned above were performed with HA standards in aqueous solution. When we started to study with the urine samples, we faced with a serious resolution problem. The resolution between the peaks of HA and urine was not suitable to make a reliable quantification (Chart A of Fig. 2). We have solved this problem by using variable flow throughout the monitoring of the effluent (Chart B of Fig. 2). This variability of the flow rate provided us with an appropriate resolution as can be seen in Chart C-III of Fig 2. The secondary advantage of programming the flow rate is the reduced total assay time. The total time of each HA analysis takes about 8 minute (Fig 2).
Figure 2. A: This chart represents one of the chromatograms before the adjustment of flow variation (The separation problem can be seen easily). B: The variation of the flow rate throughout the monitoring of the effluent. C: High performance liquid chromatograms of HA. I: standard of HA, II: Normal Urine (The presence of HA in normal urine can be seen in this chart), III: HA added normal urine (The difference between the chromatograms in chart A and C-III reflects the advantage of using the variable flow rate in this study).
tine (min) Time(min) 0-2,6 2,9-7,5 8,0 - 9,0 Flow (ınl/min) 0,8 2 0,8 B A
c
III II I HA HA HACalibration curve: HA solutions were prepared in concentration from 0.25 to 2.00 mg/ml as was mentioned before and were directly injected into the HPLC. We obtained an excellent linear relationship between the peak area and the concentrations of HA standards prepared in aqueous solution (Fig. 3). The same procedure was also performed in the control urine. HA standard solution was diluted in urine to obtain the same concentrations mentioned above. After equal volume of methanol had been added into this solution the urine standards were centrifuged and the supernatant were directly injected into the HPLC. The relationship between the peak area and the concentrations of HA standards prepared in urine was also excellent as was in the aqueous solution (Fig 3). Moreover the calibration curve of HA in urine was parallel to that of HA in water as can be seen in Fig 3. The displacement of the line for HA in urine from that in water was due to the HA normally present in urine (1,2,7). The presence of HA in normal urine can be also seen in chart C-II of Figure 2.
Figure 3. The calibration curves of HA in urine (o) and in aqueous solution (V).
Recovery studies: An adequate recovery rate was obtained in our method and was very close to that of the recovery rate reported by Ogata (17) as can be seen in Table 1.
16000000 14000000 12000000 10000000 8000000 6000000 4000000 2000000 y = 5040136,8x+ 1923279,2 R2 = 0,9767 y = 4678435x+126295 R2 = 0,9958 HA, g/g creatinine
Table 1. The results of the recovery studies.
Our study Ogata's study
Mean SD (%) Range (%) Mean SD (%)
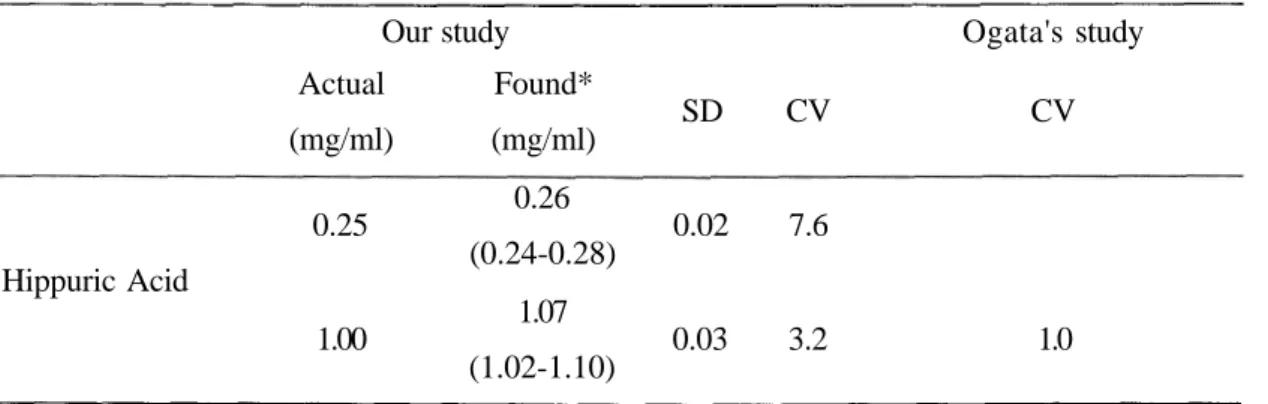
Reproducibility studies: In Ogata's study (17) a slightly better reproducibility was
reported than ours. Nevertheless the CV values that we observed in our study was between the acceptable range. The results of the reproducibility studies can be seen in Table 2.
Table 2. The results of the reproducibility studies
Our study Ogata's study Actual Found* SD CV CV (mg/ml) (mg/ml) 0.26 0.25 0.02 7.6 (0.24-0.28) Hippuric Acid 1.07 1.00 0.03 3.2 1.0 (1.02-1.10)
* The concentrations are the mean of five determinations.
Validity of our method: Toluene exposure was studied in four painters in order to test
the validity of our method. In this limited monitoring study toluene concentrations in the ambient air were measured by using Miran IBX, portable ambient air analyzer. The time-weighted average (TWA) concentration of toluene at the workplace was 147 ppm. De Rosa et al (11) have reported in their study that an exposure to 150 - 200 ppm toluene concentrations correspond to a urinary HA values between about 1.5 and 2 g/g creatinine. Our results correlated with the results of De Rosa et al (11). Moreover the urinary HA concentrations were determined significantly higher than the non-exposed (control) group as was expected (Table 3).
101.9 1.9 98.7-103.9 Hippuric Acid
* The result is the mean of five determinations (1 mg/ml)
Table 3. The results of the monitoring studies Hippuric Acid (g/g creatinine) Painters*, n=4 Mean Range 2.11** 1.69-2.39 Controls, n=10 Mean Range 0.25 0.11-0.34 "t "value (0.05) 2.17 "t "value (calculated) 19.38 * The TWA concentration in the ambient air was 147 ppm.
** The urinary HA concentration in painters has been determined significantly higher than the control group (p<0.05).
Consequently this modified method provided us an excellent linearity in the working range, an excellent recovery rate and an adequate reproducibility when compared with the Ogata's method. The validity of our modified method has also been proved by the results of the limited preliminary monitoring studies. The main advantage of our modified method is the reduced total time of the assay due to the variable flow rate. The simplicity and the minimum equipment requirements may be evaluated as the secondary advantage of our method especially for the poorly equipped laboratories.
REFERENCES
1. Hasegawa, K., Shiojima, S., Koizumi, A., Ikeda, M., "Hippuric acid and o-cresol in the urine of workers exposed to toluene", Int.Arch.Occup.Enviro.Health., 52, 197-208 (1983) 2. Andersson, R., Carlsson, A., Nordqvist, M.B., Sollenberg, J., "Urinary excretion of hippuric acid and o-cresol after laboratory exposure of humans to toluene",
Int.Arch.Occup.Enviro.Health., 53, 101-108(1983)
3. Angerer, J., Kramer, A., "Occupational chronic exposure to organic solvents. XVI. Ambient end biological monitoring of workers exposed to toluene",
Int.Arch.Occup.Environ.Health, 69(2), 91-96 (1997)
4. Wang, D.H., Ishii, K., Seno, E., Yane, S., Horike, T., "Reduced serum levels of ALT and GGT and high carbohydrate intake among workers exposed to toluene below the threshold limit values", Ind. Health, 36(1), 14-19 (1998)
5. Hammer, K.D., Mayer, N., Pfeiffer, E.H., "Sister chromatid exchanges in rotogravure printing plant workers", Int.Arch.Occup.Environ.Health, 71(2), 138-142 (1998)
6. Greenberg, M.M., "The central nervous system and exposure to toluene: a risk characterization", Environ.Res., 72(1), 1-7 (1997)
7. Löf, A., Hansen, S.H., Naslund, P., "Relationship between uptake and elimination of toluene and debrisoquin hydroxylation polimorphism", Clin.Pharmacol.Ther., 47(3), 412-417 (1990)
8. Inoue, O., Seiji, K., Ishihara, N., Kumai, M., Ikeda, M., "Increased o- and p-cresol/hippuric acid ratios in the urine of four strains of rat exposed to toluene at thousands-ppm levels", Toxicology Letters, 23, 249-257 (1984)
9. Wallen, M., "Toxicokinetics of toluene in occupationally exposed volunteers",
Scand.J.Work.Environ.Health., 12, 588-593 (1986)
10. Dossing, M., Aelum, J.B., Hansen, S.H., Lundqvist, G.R., Andersen, N.T., "Urinary hippuric acid and o-cresol excretion in man during experimental exposure to toluene",
British J.Ind.Med., 40, 470-473 (1983)
11. Rosa, E. De, Brugnone, F., Bartoiucci, G.B., PerbeIlini,L., Bellomo, M.L., Gori, G.P., Sigon, M., Corona, P.C., "The validity of urinary metabolites as indicators of low exposures to toluene", Int.Arch.Occup.Environ.Health.,56, 135-145 (1985)
12. Inoue, O., Seiji, K., Suzuki, T., Watanabe, T., Nakatsuka, H., Satoh, H., Ikeda, M., "Simultaneous determination of hippuric acid, o-, m-, and p-methylhippuric acid, pheylglyoxylic acid and mandelic acid by HPLC", Bull.Environ.Contam.Toxicol, 47, 204-210(1991)
13. Tardif, R., Brodeur, J., Pla, G.L., "Simultaneous HPLC analysis of hippuric acid and o-, m-o-, and p-methylhippuric acid in urine"o-, J.Anal.Toxicolo-, 13o-, 313-316 (1989)
14. Hansen, S.H., Dossing, M., "Determination of urinary hippuric acid and o-cresol, as indices of toluene exposure, by liquid chromatography on dynamically modified silica",
J.Chromatogr., 229, 141-148 (1982)
15. Chen, X.B., "Determination of aromatic metabolites in ruminant urine by high performance liquid chromatography", J.Chromatogr.B.Biomed.Appl, 682(2), 201-208 (1996)
16. Ogata, M., Taguchi, T., " Quantitative analysis of urinary conjugates by HPLC: excretion of hippuric acid and methylhippuric acids in the urine of subjects exposed to vapors of toluene and xylenes", Int.Arch.Occup.Environ.Health.,58, 121-129 (1986)
17. Ogata, M., Taguchi, T., " Quantitation of urinary metabolites of toluene, xylene, styrene, ethylbenzene, benzene and phenol by automated high performance liquid chromatography", Int.Arch.Occup.Environ.Health.,59, 263-272 (1987)
18. Yang, Y.D., "Simultaneous determination of creatine, uric acid, creatinine, and hippuric acid in urine by high performance liquid chromatography", Biomed.Chromatogr., 12(2), 47-49(1998)
19. Trevisan, A., "Concentration adjustment of spot samples in analysis of xenobiotic metabolites", Am.J.Ind.Med., 17, 637-642 (1990)
20. Baselt, R.C., "Biological monitoring methods for industrial chemicals", California Biomedical publications, Davis, California p. 67 (1980)