Effect of The Chlorine Dose and Total Organic
Carbon Level on Trihalomethane Formation in Waterb
Nihat TINKILIÇ1, Halil KORKMAZ1,Mustafa ÖZCİMDER2
Abstract :In this study, the effects of the chlorine dose and organic carbon content on the formation of
trihalomethane (THM) in water have been investigated by using a model based on the addition of chlorine to standard humic acid containing distilled water at various concentrations and pH. Chlorine additions at various pHs were repeated by changing the humic acid concentrations to see the effect of total organic carbon on the formation of THM. The individual and total THM contents have been determined by a GC/ECD system and an excellent linear relation was obtained between chlorine doses, total organic carbon levels vs THM contents referring to the regression coefficient, r2=0.9575-0.9998.
Key words: Trihalomethanes, humic acid, chlorination, total organic carbon, gas chromatography.
Suda Trihalometan Oluşumu Üzerine Toplam Organik
Karbon ve Klor Dozunun Etkisi
Özet:Bu çalışmada, değişik pH ve konsantrasyonlarda destile suyla hazırlanan humik asit standart çözeltileri
model olarak kullanılarak suda trihalometan (THM) oluşumu üzerine organik karbon ve klor dozunun etkisi incelendi. Çeşitli pH' larda ve konsantrasyonlarda standart humik asit çözeltilerine klor ilaveleri sonucunda oluşan THM üzerinde toplam organik karbonun etkisinin olduğu görüldü. GC/ECD sistemi ile tek tek ve toplam THM miktarları tayin edildi. THM miktarları ile toplam organik karbon seviyeleri ve klor dozları arasında mükemmel bir ilişkinin olduğu anlaşıldı ve r2 =0.9575 - 0.9998 olarak hesaplandı.
Anahtar kelimeler: Trihalometanlar, humik asit, klorlama, toplam organik karbon, gaz kromatoğrafisi
Introduction
During the chlorination reaction of precursors containing waters, predominantly humic substances, the trihalomethanes (THMs) are formed and chloroform (CHCl3) is found one of the main THM species produced in this process. However, when
μ
g/L quantities of bromide ion are present in the treated water, brominated halogens such as bromodicloromethane (CHCl2Br), chlorodibromomethane (CHClBr2), and bromoform (CHBr3)may occur as well[1,2].A maximum contaminant level (MCL) of 0.1 mg/L for THMs has been regulated by the US Environmental Protection Agency[3] for two major reasons. These are the ubiquity of measurable concentrations of THM compounds in chlorinated water supplies, and the concern for the toxicity and mutagenicity of chlorinated organic carbon compounds[2,4]. Chloroform has been shown to
1 Ondokuz Mayıs University, Faculty of Arts and Sciences, Department of Chemistry, 55139 Kurupelit, Samsun, TURKEY 2 Kırıkkale University, Faculty of Arts and Sciences, Department of Chemistry, Kırıkkale, TURKEY
LEVEL ON TRIHALOMETHANE FORMATION IN WATERB
have toxic and carcinogenic effects in rats and mice, at much higher concentrations than the levels found in chlorinated water supplies[5].
Among the methods proposed for the control of THMs, the use ozone, and chlordioxide can be mentioned[6,7]. Some water treatment plants use chlordioxide instead of chlorine because of its nonreactivity against organic compounds[6], but still many water treatment plants use chlorine as disinfectant since it is inexpensive and easy to apply.
The formation of THMs dependencies in drinking water on several factors, such as non-volatile total organic carbon (NVTOC), free chlorine and bromine content and pH etc., has been quantitatively shown by Morrow & Minear[1] by using regression models to reveal the relation between raw water characteristics and THM formation at various bromine, chlorine concentrations, and pH values leading to a simple equation (Eqn.1) giving total THM (TTHM) content.
TTHM = bo + b1(Br-) + b2 [log (Cl2 dose)] + b3 (pH) + 10b4 (T) + b5 NVTOC) (1)
Where bo, b1, b2, b3, b4, b5, are constants and T is absolute temperature. This equation shows a linear relationship between TTHM and NVTOC, log (Cl2 dose), besides other variables. Batchelor and co-workers[8]. have also investigated the kinetics of bromoform and iodoform formation at different temperatures.
In this study, we present some quantitative data on the relationship between THM formation and chlorine dose, and total organic carbon (TOC) content by using a simple model. Total organic carbon content was changed by adding standard humic acid while dosing various amounts of chlorine to distilled water and trihalomethanes were quantified by gas chromatography following an extraction step.
Experimental
Materials: Chloroform, bromdichloromethane, chlorodibromomethane, bromoform standards and standard humic acid purchased from Aldrich Co., Germany; chromatographic grade n-hexane, potassium permanganate, potassium iodide, sodium thiosulphate, sodium chloride, oxalic acid and acetic acid (all ACS reagent grade) obtained from Merck Co., Germany were used in the experiments.
Standard solutions: Standard THM solutions at 1-25 µg/L concentrations were prepared by diluting the aliquots of 100 µg/L stock THM solution with n-hexane. Humic acid solutions of 0.5-7.0 mg/L concentrations were prepared by dissolving the necessary amount in distilled water. The total organic carbon contents of the humic acid solutions were determined by permanganate method described elsewhere9. Chlorine gas was prepared by the reaction between KMnO4 and HCl. The saturated stock chlorine solutions were obtained by bubbling the emerged gas into distilled water and chlorine contents were then determined using the procedures given by APHA (American Protection Health Associations) [9]. Resulted stock solutions were further diluted to the desired concentrations between 0.3-2.0 mg/L.
Gas chromatography: Chromatographic analysis was performed by using a Packard Model 439 Gas Chromatograph in conjunction with electron capture detection under the following chromatographic conditions. Separation was carried out on a 2mm ID x 2m glass column filled with 10 % squalene on 80/100 mesh chromosorb WAW. N2 was used as carrier gas at a flow rate of 20 mL/min. Injection, column, and detector temperatures were 80, 60, and 120°C respectively. Chromatograms were recorded by a Packard Model 624 double pen recorder at 10 mV adjustment with 1cm/min chart speed.
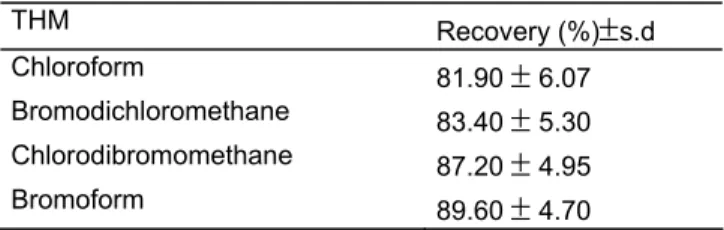
Procedure: THM determinations were performed according to the method proposed by USEPA[3]. 25 ml humic acid solutions at 0.5 mg/L concentration, 15 ml free chlorine solutions at 0.3, 0.5, 1.0, 1.5, 2.0 mg/L concentrations and 5 mg Na2S2O3were transferred into five 50 mL teflon capped glass bottles. pH of the solutions were adjusted to 7.2 by means of Jenway 3010 pH meter by adding 1M H2SO4 and 1M NaOH solutions. After the solutions were mixed by magnetic stirrer for 30 min., 2 ml n-hexane were added by 5 ml Hamilton syringe and shaked firmly for 1 min. Separated n-hexane phase were transferred into 5 ml teflon capped glass bottles and kept at 4 °C for the THM analyses. A 3 µl extracted solution was injected to gas chromatograph to perform the THM analyses. Qualitative and quantitative judgements have been made by comparing the retention times and the peak heights following the injection of standard mixtures. The recovery values shown in Table 1 were obtained by adding 2-25
μ
g/L of analyte into the blank solution, at the beginning.Table 1. Recovery values of THMs (%)
THM Recovery (%)
±
s.d Chloroform 81.90±
6.07 Bromodichloromethane 83.40±
5.30 Chlorodibromomethane 87.20±
4.95 Bromoform 89.60±
4.70Results and Discussion
Since chlorine disinfectants react with organic materials present in drinking waters, many substances of largely unknown composition are produced. These reactions have been recognised as coming from the disinfectant demand and natural organic colour bleaching by chlorine. Most of demand is due to the oxidation of organic molecules to any new functionalities. In the process, the disinfectant is chemically reduced, for example, an order of 90 percent of chlorine demand can ultimately be accounted for chloride ion. The remaining 10 percent or so may react by substitution or addition reactions and become incorporated into the organic molecular structure[10]. The result is that instead of getting multiple halogen substitution at relatively few carbon atoms, a necessary condition for halogen production. Presumably, the resulting halogenated macromolecules are relatively stable and fail to split-off low moleculer weight fragments which have been determined by methods based on gas chromatography.
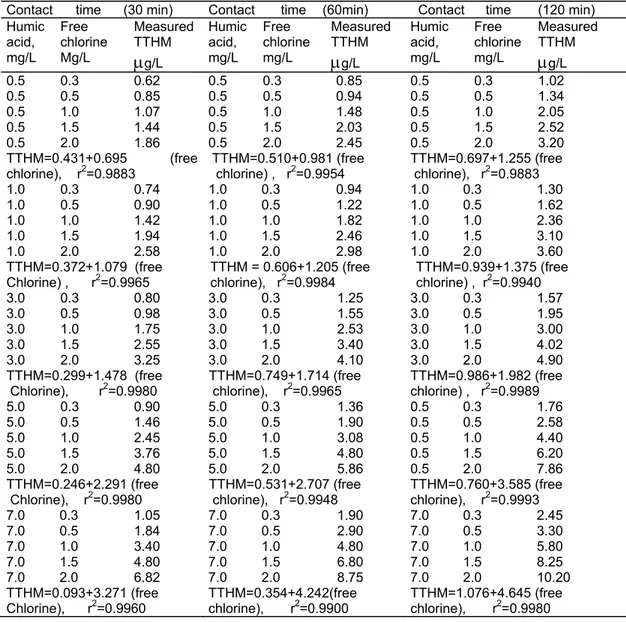
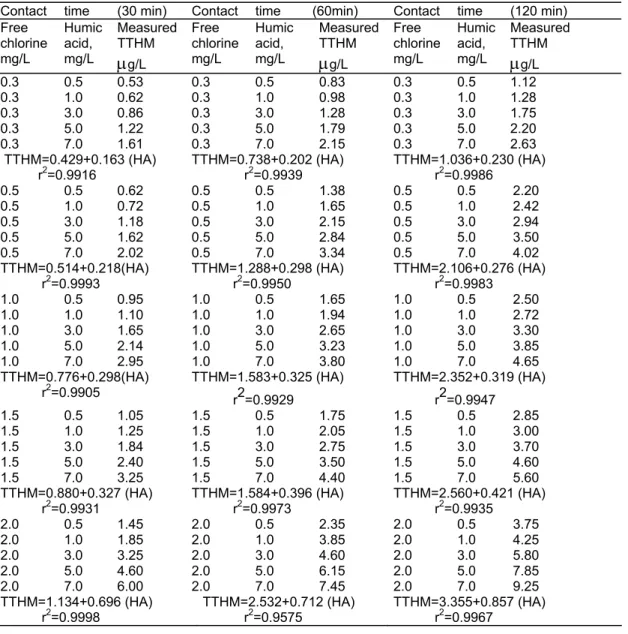
To support this hypothesis, the chlorinated model water samples (free chlorine between 0.3-2.0 mg/L) were treated with humic acid solutions at different concentrations (0.5, 1.0, 3.0, 5.0, 7.0 mg/L) at 30, 60, and 120 min. contact times at constant pH: 7.2. In addition to this, the model water samples contain free chlorine at 0.3, 0.5, 1.0, 1.5, 2.0 mg/L concentrations were treated with humic acid solutions at constant concentrations of 0.5 mg/L and 7.0 mg/L and with constant contact time of 120 minutes at different pHs of 6.0, 7.2, 8.5. The substances resulted from the by product reactions were determined by gas chromatography. The data obtained from the analyses were summarized in Table 2, 3 and 4.
In Table 2 humic acid (HA) vs. TTHM at different free chlorine concentrations (at pH:7.2) are given. It may be seen from Table 2 that TTHM varies linearly by increasing the free chlorine dose at constant HA concentration. The amount of TTHM formed is also increased by increasing the contact time. The regression coefficient, r2, changes in the range of 0.9883-0.9993 for the amounts of TTHM which was formed following the treatment of free chlorine between the lowest HA concentration of 0.5 mg/L and the highest HA concentration of 7.0 mg/L.
LEVEL ON TRIHALOMETHANE FORMATION IN WATERB
A similar relation may be obtained from Table 3. The HA solutions at 0.5, 1.0, 3.0, 5.0 and 7.0 mg/L concentrations were treated respectively against constant free chlorine concentrations of 0.3-2.0 mg/L for 30, 60, and 120 minutes and the amount of THMs were determined (at pH:7.2). The regression coefficient for these data is between 0.9575 -0.9998.
The same procedures were performed with free chlorine and humic acid concentrations at different pH values. Following a contact time of 120 minutes at pH values of 6.0, 7.2, and 8.5, it was found that a linear increase in TTHM amounts is observed by increasing in the free chlorine concentrations (see Table 4). The linear regression coefficients were found between 0.9619- 0.9967 following the treatment of 0.5 and 7.0 mg/L HA with free chlorine of 0.3, 0.5, 1,0, 1.5, and 2.0 mg/L concentrations at pH: 6.0. Following the treatment at pH: 7.2 with the solutions of the same concentrations, the linear relation between the TTHM data were observed with the regression coefficients between 0.9948-0.9993. The linear relation for the data obtained at pH:8.5 with the same solutions under the same conditions were determined with the regression coefficients between 0.9959-0.9979.
Table 2. Humic acid vs. TTHM different free chlorine concentrations (at pH=7.2).
Contact time (30 min) Contact time (60min) Contact time (120 min) Humic acid, mg/L Free chlorine Mg/L Measured TTHM
μ
g/L Humic acid, mg/L Free chlorine mg/L Measured TTHMμ
g/L Humic acid, mg/L Free chlorine mg/L Measured TTHMμ
g/L 0.5 0.3 0.62 0.5 0.3 0.85 0.5 0.3 1.02 0.5 0.5 0.85 0.5 0.5 0.94 0.5 0.5 1.34 0.5 1.0 1.07 0.5 1.0 1.48 0.5 1.0 2.05 0.5 1.5 1.44 0.5 1.5 2.03 0.5 1.5 2.52 0.5 2.0 1.86 0.5 2.0 2.45 0.5 2.0 3.20 TTHM=0.431+0.695 (free chlorine), r2=0.9883 TTHM=0.510+0.981 (free chlorine) , r2=0.9954 TTHM=0.697+1.255 (free chlorine), r2=0.9883 1.0 0.3 0.74 1.0 0.3 0.94 1.0 0.3 1.30 1.0 0.5 0.90 1.0 0.5 1.22 1.0 0.5 1.62 1.0 1.0 1.42 1.0 1.0 1.82 1.0 1.0 2.36 1.0 1.5 1.94 1.0 1.5 2.46 1.0 1.5 3.10 1.0 2.0 2.58 1.0 2.0 2.98 1.0 2.0 3.60 TTHM=0.372+1.079 (freeChlorine) , r2=0.9965 TTHM = 0.606+1.205 (free chlorine), r2=0.9984 chlorine) , TTHM=0.939+1.375 (free r2=0.9940
3.0 0.3 0.80 3.0 0.3 1.25 3.0 0.3 1.57 3.0 0.5 0.98 3.0 0.5 1.55 3.0 0.5 1.95 3.0 1.0 1.75 3.0 1.0 2.53 3.0 1.0 3.00 3.0 1.5 2.55 3.0 1.5 3.40 3.0 1.5 4.02 3.0 2.0 3.25 3.0 2.0 4.10 3.0 2.0 4.90 TTHM=0.299+1.478 (free
Chlorine), r2=0.9980 TTHM=0.749+1.714 (free chlorine), r2=0.9965 TTHM=0.986+1.982 (free chlorine) , r2=0.9989
5.0 0.3 0.90 5.0 0.3 1.36 0.5 0.3 1.76 5.0 0.5 1.46 5.0 0.5 1.90 0.5 0.5 2.58 5.0 1.0 2.45 5.0 1.0 3.08 0.5 1.0 4.40 5.0 1.5 3.76 5.0 1.5 4.80 0.5 1.5 6.20 5.0 2.0 4.80 5.0 2.0 5.86 0.5 2.0 7.86 TTHM=0.246+2.291 (free Chlorine), r2=0.9980 TTHM=0.531+2.707 (free chlorine), r2=0.9948 TTHM=0.760+3.585 (free chlorine), r2=0.9993 7.0 0.3 1.05 7.0 0.3 1.90 7.0 0.3 2.45 7.0 0.5 1.84 7.0 0.5 2.90 7.0 0.5 3.30 7.0 1.0 3.40 7.0 1.0 4.80 7.0 1.0 5.80 7.0 1.5 4.80 7.0 1.5 6.80 7.0 1.5 8.25 7.0 2.0 6.82 7.0 2.0 8.75 7.0 2.0 10.20 TTHM=0.093+3.271 (free
Table 3. Free chlorine vs. TTHM at different humic acid (HA) concentrations (at pH=7.2). Contact time (30 min) Contact time (60min) Contact time (120 min) Free chlorine mg/L Humic acid, mg/L Measured TTHM
μ
g/L Free chlorine mg/L Humic acid, mg/L Measured TTHMμ
g/L Free chlorine mg/L Humic acid, mg/L Measured TTHMμ
g/L 0.3 0.5 0.53 0.3 0.5 0.83 0.3 0.5 1.12 0.3 1.0 0.62 0.3 1.0 0.98 0.3 1.0 1.28 0.3 3.0 0.86 0.3 3.0 1.28 0.3 3.0 1.75 0.3 5.0 1.22 0.3 5.0 1.79 0.3 5.0 2.20 0.3 7.0 1.61 0.3 7.0 2.15 0.3 7.0 2.63 TTHM=0.429+0.163 (HA) r2=0.9916 TTHM=0.738+0.202 (HA) r2=0.9939 TTHM=1.036+0.230 (HA) r2=0.9986 0.5 0.5 0.62 0.5 0.5 1.38 0.5 0.5 2.20 0.5 1.0 0.72 0.5 1.0 1.65 0.5 1.0 2.42 0.5 3.0 1.18 0.5 3.0 2.15 0.5 3.0 2.94 0.5 5.0 1.62 0.5 5.0 2.84 0.5 5.0 3.50 0.5 7.0 2.02 0.5 7.0 3.34 0.5 7.0 4.02 TTHM=0.514+0.218(HA) r2=0.9993 TTHM=1.288+0.298 (HA) r2=0.9950 TTHM=2.106+0.276 (HA) r2=0.9983 1.0 0.5 0.95 1.0 0.5 1.65 1.0 0.5 2.50 1.0 1.0 1.10 1.0 1.0 1.94 1.0 1.0 2.72 1.0 3.0 1.65 1.0 3.0 2.65 1.0 3.0 3.30 1.0 5.0 2.14 1.0 5.0 3.23 1.0 5.0 3.85 1.0 7.0 2.95 1.0 7.0 3.80 1.0 7.0 4.65 TTHM=0.776+0.298(HA) r2=0.9905 TTHM=1.583+0.325 (HA) r2=0.9929 TTHM=2.352+0.319 (HA) r2=0.9947 1.5 0.5 1.05 1.5 0.5 1.75 1.5 0.5 2.85 1.5 1.0 1.25 1.5 1.0 2.05 1.5 1.0 3.00 1.5 3.0 1.84 1.5 3.0 2.75 1.5 3.0 3.70 1.5 5.0 2.40 1.5 5.0 3.50 1.5 5.0 4.60 1.5 7.0 3.25 1.5 7.0 4.40 1.5 7.0 5.60 TTHM=0.880+0.327 (HA) r2=0.9931 TTHM=1.584+0.396 (HA) r2=0.9973 TTHM=2.560+0.421 (HA) r2=0.9935 2.0 0.5 1.45 2.0 0.5 2.35 2.0 0.5 3.75 2.0 1.0 1.85 2.0 1.0 3.85 2.0 1.0 4.25 2.0 3.0 3.25 2.0 3.0 4.60 2.0 3.0 5.80 2.0 5.0 4.60 2.0 5.0 6.15 2.0 5.0 7.85 2.0 7.0 6.00 2.0 7.0 7.45 2.0 7.0 9.25 TTHM=1.134+0.696 (HA) r2=0.9998 TTHM=2.532+0.712 (HA) r2=0.9575 TTHM=3.355+0.857 (HA) r2=0.9967LEVEL ON TRIHALOMETHANE FORMATION IN WATERB
Table 4. Humic acid vs. TTHM at different pH and free chlorine concentrations (at contact time 120 minutes).
pH=6.0 pH=7.2 pH=8.5 Humic acid, mg/L Free chlorine mg/L Measured TTHM
μ
g/L Humic acid, mg/L Free chlorine mg/L Measured TTHMμ
g/L Humic acid, mg/L Free chlorine mg/L Measured TTHMμ
g/L 0.5 0.3 0.70 0.5 0.3 1.02 0.5 0.3 1.30 0.5 0.5 0.92 0.5 0.5 1.34 0.5 0.5 1.72 0.5 1.0 1.40 0.5 1.0 2.05 0.5 1.0 2.32 0.5 1.5 2.03 0.5 1.5 2.52 0.5 1.5 3.05 0.5 2.0 2.66 0.5 2.0 3.20 0.5 2.0 3.90 TTHM=0.326+1.147 (free chlorine), r2=0.9967 TTHM=0.699+1.252 (free chlorine), r2=0.9948 TTHM=0.890+1.480 (free chlorine), r2=0.9959 7.0 0.3 1.80 7.0 0.3 2.45 7.0 0.3 3.30 7.0 0.5 2.40 7.0 0.5 3.30 7.0 0.5 4.35 7.0 1.0 3.30 7.0 1.0 5.80 7.0 1.0 6.95 7.0 1.5 6.70 7.0 1.5 8.25 7.0 1.5 9.20 7.0 2.0 8.70 7.0 2.0 10.20 7.0 2.0 11.32 TTHM=0.164+4.166 (free chlorine), r2=0.9619 TTHM=1.087+4.579 (free chlorine), r2=0.9993 TTHM=2.010+4.730 (free chlorine), r2=0.9979A linear relationship was observed between the chlorine dose and TTHM similar to that suggested by Morrow and Minear[1]. The only difference is that in our case TTHM is a function of free chlorine concentration, not the function of the logarithm of the chlorine dose;
TTHM = a1 + b1(free chlorine) (2) TTHM = a1+ b1 (HA) (3) where a1 , a1 , b1 , b1 are constants. The equations suggested by Morrow and Minear in short form are;
TTHM = a1 + b1 (chlorine dose) (4) TTHM = a1 + b1 (TOC) (5)
where a1 , a1 , b1 , b1 are constants. However in both, our and his model there exist linear relationships corresponding to humic acid concentrations of 0.5 , 1.0 , 3.0 ,5.0 and 7.0 mg/L respectively. Similar relationship is observed between HA concentrations and TTHM. When we compare the slopes of free chlorine vs. TTHM, similar linear relationship is obtained. It can be seen that the rate of TTHM formation is becoming higher at high HA concentrations.
To support the validity of the model studied the typical drinking waters (surface waters) were analyzed for 10 months. The correlation between formed THMs and free chlorine concentration, and TOC level were found in perfect agreement with the result of the model studies[11]. Since THMs formation is in favour at high free chlorine concentrations, the chlorination process has to be controlled strictly. Furthermore, TOC value of water must be taken into account during chlorination process. From kinetical point of view, the following points could be taken into consideration during this process.
1-
At constant free chlorine concentrations, THM formation increases by time.2-
The same is also true at constant HA concentrations, and THM formation increases as the pH values increase.3-
THM formation increases by time at constant HA concentrations. THM formation is observed quite high at moderate pH values (7.2) in concurrence with the studies by Stevens et al. [10].4- There is a clear correlation between the chlorinated organic compounds (especially, chloroform formation) which are formed by chlorine addition to the solution containing humic acid and the chlorinated drinking waters[11]. In other words, the most important source of THMs is humic substances.
5-
The minimum detection limit of 0.5 µg/L for THMs[3] corresponds to the THMs amount obtained by of 0.5 mg/L humic acid and 0.3 mg/L free chlorine concentrations at pH: 7.2 following 30 min of contact time.References
1-Morrow, C. M. and Minear , R. A., Use of Regression Models to Link Raw Water Characteristics to Trihalomethane
Contcentration in Drinking Water, Water Res., 21, 41 (1987).
2-Johnson, J. D. And Jensen, J. N., THM and TOX Formation : Routhes, Rates, and Precursors, J. Am. Water Works Assoc., 70, 156 (1986).
3-USEPA, Supplement to the Fifteenth Edition of Standard Methods for the Examination of Water and Wastewater, APHA, AWWA, WPCF, 1981.
4-Cotruvo, J. A., THMs in Drinking Water, Envir. Sci. and Technol.,15, 268 (1981). 5-Hileman, B., The Chlorination Question, Envir. Sci. and Technol.,16, 15A (1982).
6-Lykins, B.W. and Griese, M. H., Using Chlorine Dioxide for Trihalomethane Control, J. Am. Water Works Assoc., 73, 88 (1986).
7-McGuire, M. J. , Davis M. K. , Tate, C. H. , Aieta, E. M. , Howe, E. W. and Crittenden, J. C., Evaluating GAC for
Trihalomethane Control, J. Am. Water Works Assoc., 83, 38 (1991).
8-Batchelor, B. , Fusilier, D. and Murray, H. E., Developing Haloform Formation Potential Tests, J. Am. Water Works Assoc.,79, 50 (1987).
9-APHA, Standard Methods for the Examination of Water and Wastewater,13th. Ed., Washington, 1987.
10-Stevens, A. A. , Dressman, R. C. , Sorrell, R. K. and Brass, H., Organic Halogen Measurements: Current Uses and
Future Propects, J. Am. Water Works Assoc., 77, 146 (1985).
11-Tınkılıç, N. , Korkmaz, H. and Özcimder, M., Gas Chromatographic Measurements of TTHM's in Drinking Water of