Selçuk J. Appl. Math. Selçuk Journal of Special Issue. pp. 109-116, 2011 Applied Mathematics
Exponential Mathematical Model of Yield Response of Common Vetch to Plant Population
Ufuk Karadavut
University of Bingöl, Agricultural Fac., Dep. of Animal Sci., Biometry and Genetic Unit, Bingol, Turkiye
e-mail: ukaradavut@ hotm ail.com
Abstract. Yield of field crops are influenced by very different factors. Espe-cially, crop species, soil structure, nutrient substance, availability of water and plant population. In this study, we aimed relation of between biomass yield (g plant-1) and plant population (plants m-2). Common vetch plants were used as material. Common vetch plants were grown in Konya ecological conditions. Data were analyzed with exponential mathematical models. It included two parameters. In this study, solar radiation was measured at different positions in the plant canopy. As results, this study showed no definitive peak in yield with plant population, but generally exhibited asymptotic approach to maximum yield with increased plant population.
Key words: Vetch Plants.
2000 Mathematics Subject Classification: 26D15. 1. Introduction
Dry matter production of field crops is related to some management factors. Plant population factor affected yield and yield formation on field crops. Many field studies showed relation between yield formation and plant population for various crops. Plant growth provides the balance between photosynthetic gains and respiratory losses. It is essential to consider respiration in analyses of plant productivity. Computational plant models are increasingly seen as a useful tool for comprehending complex relationships between gene function, plant physiol-ogy, plant development, and the resulting plant form (Prusinkiewicz, 2004). Generally, plant growth functions are used in agricultural decision making. They were derived from experienced-based agronomic research. Plant yields were related to some defined variables based on correlation and regression analysis. Crop yields were expressed as polynomial or exponential mathematical functions of the defined variables, with regression coefficients obtained through linear or nonlinear curve-fitting procedures based on observed values; usually there was little consideration given to the physical and physiological processes involved
(Jame and Cutforth, 1996). Exponential growth model is generally used in plant growth analysis. Exponential growth function showed to increase rapidly. Overman et. al. (2006) explained to will be described yield formation of corn plant population with a linear-exponential model. Maddonni and Otegui (1996) showed leaf area, light interception and crop development to be explained with exponential model in maize crop. This study, exponential model described these characters (r2 > 0.77) in all hybrids. Amir and Sinclair (1991) used A simple
mechanistic model to develop and analyze the effects of temperature and solar radiation on spring wheat (Triticum aestivum L.). Leafarea development, bio-mass accumulation and seed growth were formed a linear increase in harvest index with time.
Andrade et. al., (2000) calculated kernel number per plant (KNP) for maize (Zea mays L.) using linear models and curvilinear (inverse linear and exponen-tial) models based on intercepted photosynthetically active radiation per plant (IPARP). Both linear and curvilinear (inverse linear and exponential) models based on IPARP explained more than 75% of the variability in KNP and ker-nel number per apical ear (KNA). Edwards and Purcell (2005) evaluated the responses soybean to populations of 10, 20, 40, 60, and 100 seeds m−2 sown in
19-cm rows and irrigated as needed at Fayetteville, AR, in 2001, 2002, and 2003. The response of soybean yield to increased plant populations was described well by an exponential model that predicted an asymptotic yield plateau at high plant populations. This research demonstrated some of the difficulties that can be encountered when expressing soybean yield as an empirical function of soy-bean population density.
Thies and Singleton (1991) predicted the symbiotic performance of rhizobia introduced into different environments would allow for a more judicious use of rhizobial inoculants. Data from eight standardized field inoculation trials were used to develop models that could be used to predict the success of rhizobial inoculation in diverse environments based on indices of the size of indigenous rhizobial populations and the availability of mineral N. Power, exponential, and hyperbolic functions yielded similar results; however, the hyperbolic equation provided the best fit of observed to estimated inoculation responses (r2= 0.59).
2. Material and Methods
This study was conducted to determine the effect of different seed ratios on the seed yields of common vetch grown in the experimental field of the Bahri Da˘gda¸s International Agricultural Research Institute in the 2003-2004 growing seasons. Kubilay- 82 and Tarm Beyazı-98 are used as material. The experimental design was as split plots with three replications. In the experiments; the main plots were row spacing and the sub-plots were seed rates. On 2 different row spacing (45 and 60 cm) and 3 different sowing norms (150, 200 and 250 seeds/m2) were used. This field experiment was carried out under irrigated conditions in Konya Ecological conditions. Soils of experimental areas have alkaline in character (pH:8.2), poor organic matter (%0.95). Phosphorus and potassium are available. The amount of rain falling to the research area is 186 mm (first
year) 176 mm (second year) in growing periods. Plants were sown in the month of April of each year. 4.5 kg N per hectare were applied with sowing (Tan and Serin, 1995) and 6.0 kg P2O5 (Aydın, 1990) was applied. Plants were irrigated
the form of sprinkler at 2 times year. Measurements were taken every one week so to mature. A total of 12 measurements were made from experimental areas Exponential model is showed following equation;
Y = abx Where;
Y: Y is yield of biomass (dry matter), Mg ha−1
X: x is plant population, plants m-2 a and b are model parameters
Population growth rate are explained in terms of dry matter accumulation of plants in plots. Increasing population growth rate are indicated by R. R is expressed as limited the growth of a population rate. Population growth rate are calculated by following equation.
N(t)= N(0)Rt
Where;
N(t):Population size at the t time
N(0):Population refers to the size at the time of the initial.
Taking into account of this equality, the population growth rates are determined; R =
∙N
(t)
N(0)
¸1/t
The instantaneous growth rates should be also determined by determining Pop-ulation growth. The instantaneous growth rate is shown “r”. r is obtained by using the following equation;
r = log N(t)− log N(0) t
The coefficient of determination (R2) was determined with the help of the
fol-lowing equation:
R2= SSE GSS Where;
SSE: Sum square error GSS: General sum square
Mean square error is determined with the help of the equation;
HKO = n X i=1 (Y0− Yp)2 n
Where, Y0 growth and dry matter content of the observed values Yp estimated
growth and n is the number of observation. Analyses were made with SPSS 16 V package programs.
3. Results and Discussion
We will demonstrate how exponential functions can be used to exponential rapidly increasing data sets such as the average for plant growth mechanisms. We will develop exponential tables of data. In addition, we will show what an exponential function figure looks like. Dry matter accumulation has been steadily growing for several times until maturing. The figure1 gives the plant growth at 12 different times regular intervals, beginning in germination. The dry matter accumulation reached 66.88 g/plant (150 plant/da), 72.31 g/plant (200 plant/da) and 80.15 g/plant (250 plant/da). Increasing of the number of plants was observed an increase of plant height. Figure 1 illustrates the im-portant distinction between curve fitting and modeling. A well fit curve may be useful for interpolating a given data set, but such a model may break down when extrapolated to describe past or future trends.
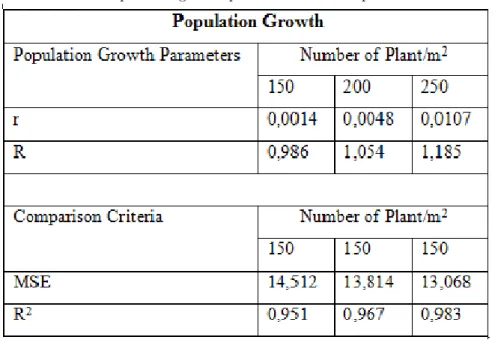
Figure 1. Changes of Dry Matter Accumulation of Different Plant Populations Growth of populations and comparison criteria are shown in Table 1. Analyzing Table 1, instantaneous growth rates and population growth rates have changed depending upon the plant numbers. Instantaneous growth rate (r) increased as the number of plants/m2. r got different value according to the number of
plants/m2. r showed the lowest value (0,0014) in 150 plant/m2and highest value
(0,0107) in 250 plant/m2. Population growth rates have also shown a similar
change as the instantaneous growth rates. R showed the lowest value (0,986) in 150 plant/m2 and highest value (1,185) in 250 plant / m2. As comparison cri-teria are examined, different results were obtained in plant growth parameters. Mean Square Error (MSE) is decreased by increasing the frequency of the plant. This result, as increases the frequency of the plant exponential model has been made more successful by definition. MSE showed the lowest value (13,068) in
250 plant/m2 and highest value (14,512) in 150 plant/m2. However, the co-efficient of determination has shown similar results plant growth parameters. R2showed the lowest value (0,951) in 150 plant/m2and highest value (0,983) in
250 plant/m2.
Table 1. Population growth parameters and comparison criteria
Population growth rate (R) values that are greater than 1 mean a constant growth of the population. Exponential growth model was estimated using the population growth rate value. Population growth rate from the value of to be exponential population growth model often used some studies. Dependent vari-able and one or more than one number the independent varivari-able, the best way to predict the values of the dependent variable have a significant influence. Mea-suring between the periods of exponential growth model based on the values of dry matter accumulation of plants according to their frequency values obtained from the rate of growth has yielded results close to each other.
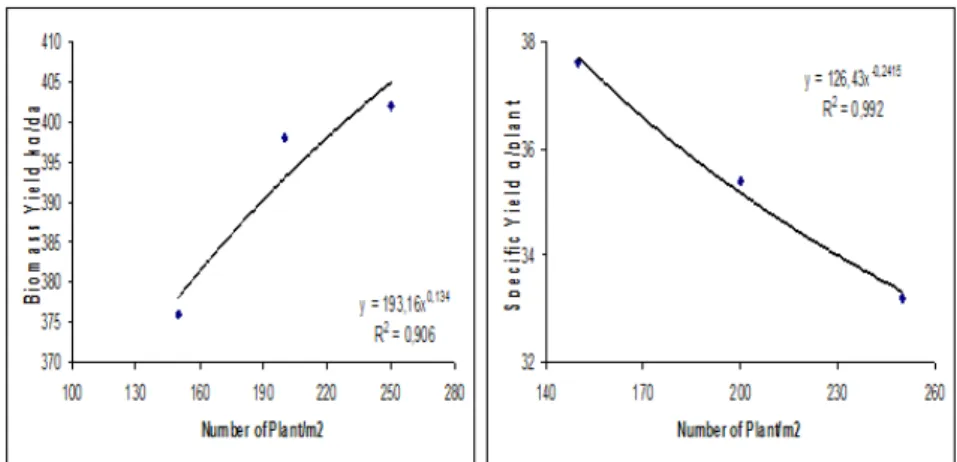
Careful planning and management can ensure to meet the needs of a growing population. The growth data are used to relate between the crop canopy and to response of yield to plant population. Plant population is assumed uniform for each treatment and replication (Allen et. al., 2011). Data from the Konya ecological conditions have been used to provide an empirical basis for the simple exponential model. Data with common vetch have been used to test the simple exponential model of yield response to plant population. The response function shows asymptotic approach toward a maximum dry matter as plant population increases. There is no evidence of a peak in biomass yield. Specific yield declined from a maximum value of dry matter as plant population increases, reflecting
plant competition for incident solar energy (Figure 2). Therefore, biomass yield increase as plant population increases (Figure 2).
Figure 2. Biomass yield and specific yield in some plant populations (150, 200 and 250 plant/m2)
Data from a field study with common vetch were then used to examine the rela-tionship between absorption of solar energy within the canopy and dependence of biomass yield on plant population (Allen et. al., 2011). Measurements showed an exponential decrease in solar intensity with position in the canopy. It was possible to correlate total solar energy absorption with plant population. These results provide a physical basis for the simple exponential model (Overman et. al., 2006). A further characteristic of the model can now be noted. Data from this study should be used to further test the model. The model should also be tested for other plant species. Especially, it should be planned to examine coupling of biomass yields and plant nitrogen uptake with plant population and applied nitrogen in a future publication.
References
1. Akkaya HR, Burgman MA, Ginzburg LR. Population growth. In: Akkaya HR, Burgman MA, Ginzburg LR,eds. Applied Population Ecology. 2nded. Sunderland: Sinauer Associates; 1999. p.7-9.
2. Allen R. Overman, Richard V. Scholtz III. 2011. Model of Yield Response of Corn to Plant Population and Absorption of Solar Energy. PLoS ONE 6(1): 1-7.
3. Amir, J.; Sinclair, T.R. 1991. A model of the temperature and solar-radiation effects on spring wheat growth and yield. Field Crop Research. 28 (1-2): 45-58. 4. Andrade, F.H.; Otegui, M.E.; Vega, C. 2000. Intercepted Radiation at Flowering and Kernel Number in Maize. Agronomy Journal. 92:92-97.
5. Aydın,1.,1990, Samsun Ekolojik ¸Sartlarında Yeti¸stirilen Adi Fi˘g+Bazı Tahıl Tür-lerinde Karı¸sım Oranlan ve Gübrelemenin Kuru Ot Verimine, Ham Protein Oranına, Ham Protein Verimine ve Bunlardan Sonra Ekilen Mısır Verimine Etkileri. Ondokuz Mayıs Üniv.Fen Bil.Enst.(Doktora Tezi).
6. Do˘gan N, Ödamar K. Chaid analysis and an application related with family plan-ning. Tükiye Klinikleri J Med Sci 2003;23(5):392-7.
7. Edwards, J.T.; Purcell, L.C. 2005. Soybean Yield and Biomass Responses to Increasing Plant Population Among Diverse Maturity Groups. I. Agronomic Charac-teristics. Crop Sci. 45:1770-1777.
8. Jame, Y. W. and Cutforth, H. W. 1996. Crop growth models for decision support systems. Can. J. Plant Sci. 76: 9—19.
9. Krebs CJ. Demographic techniques: Vital statistics. Ecology. 4th ed. New York: HarperCollins, Collage; 1994. p.175-84.
10. Maddonni, G.A.; Otegui, M.E. 1996. Leaf area, light interception and crop devel-opment in maize. Field Crop Research. 28 (1): 81-87.
11. Overman AR, Scholtz RV III, Brock KH (2006) Model analysis of corn response to applied nitrogen and plant population density. Commun. Soil Science and Plant Analysis 37: 1157—1172.
12. Prusinkiewicz, P. 2004. Modeling plant growth and development. Current Opinion in Plant Biology. 7(1):79-83.