KADİR HAS UNIVERSITY
GRADUATE SCHOOL OF SCIENCE AND ENGINEERING
COMPUTATIONAL BIOLOGY AND BIOINFORMATICS DISCIPLINE AREA
HOMOLOGY MODELING AND NORMAL MODE ANALYSIS OF
HUMAN NR1-NR2A NMDA TYPE RECEPTORS
AYHAN DEMİR
MASTER’S THESIS
2 AYH AN D EM İR M .S . Thesis 20 17 Stu d ent’s Fu ll Na m e P h .D. (o r M .S . o r M .A .) The sis 20 11
3
HOMOLOGY MODELING AND NORMAL MODE ANALYSIS OF HUMAN
NR1-NR2A NMDA TYPE RECEPTORS
AYHAN DEMİR
MASTER’S THESIS
Submitted to the Graduate School of Science and Engineering of Kadir Has University in partial fulfillment of the requirements for the degree of Master’s in the Discipline Area of Computational Biology and Bioinformatics under the Program of Bioinformatics and Genetic
4
vi
DEMİR, AYHAN. HOMOLOGY MODELING AND NORMAL MODE ANALYSIS OF HUMAN NR1-NR2A NMDA TYPE RECEPTORS, MASTER’S THESIS, Istanbul, 2017.
Abstract
N-Methyl-D-Aspartate (NMDA) receptors are ionotropic glutamate receptors located in the membrane of the nerve cells. The normal receptor activity has a vital importance in consciousness and normal brain functions. Neuronal death occurs as a result of overstimulation of NMDA-type glutamate receptors and leads to diseases such as stroke, epilepsy, Alzheimer's and Parkinson's. There are two recently available x-ray structures, one from Xenopus laevis and the other one from Rattus norvegicus. First the structures were analyzed and compared especially for ion channel parts by considering the general problems that arise when crystallizing structures of membrane proteins. Then human GluNR1-GluNR2A type NMDA receptor structure was modeled by homology modeling based on the Xenopus laevis template. NMDA receptor structure is a large membrane protein complex thus we followed a couple of different strategies such as modeling by the individual monomer, modeling as a tetramer and modeling as a tetramer without loops then adding loops with loop modeling. Final models were chosen according to the model assessment scoring function. Subsequently, elastic network analysis was used to understand the dynamics of the structural variations which govern the function of the protein. 20 slowest modes of NMDA receptor were examined according to 8 parameters which are found to be functionally important in previous NMDA studies. The 3th slowest mode was noticeable regarding to gating mechanism. In Mode 3, a twist motion of the TMD part rotates clockwise parallel to the membrane while LBD and TMD together rotate counter-clock wise parts cause opening of the channel. Mode 3, showed the relationship between TMD girdles, LDB and M3-TMD linker. Similarly, Mode 9 like Mode 3, showed the same relationship. In addition, Mode 9 showed like a breathing motion or expansion motion
vii
along the channel axis. We hope that these modes will be tested by a more through all atom molecular dynamics study of apo and ligand bound human NMDA structure in the near future.
viii
DEMİR, AYHAN. HOMOLOGY MODELING AND NORMAL MODE ANALYSIS OF HUMAN NR1-NR2A NMDA TYPE RECEPTORS, MASTER’S THESIS, Istanbul, 2017.
Özet
N-Metil-D-Aspartat (NMDA) reseptörleri sinir hücrelerinin zarında bulunan iyonotropik glutamat reseptörleridir. Normal reseptör aktivitesi, bilinçlilik ve normal beyin işlevlerinde hayati öneme sahiptir. Nöronal ölüm, NMDA tipi glutamat reseptörlerinin aşırı uyarılması
sonucu ortaya çıkar ve inme, epilepsi, Alzheimer ve Parkinson gibi hastalıklara neden olur. Xenopus laevis ve Rattus norvegicus olmak üzere yakın zamanda iki yeni x-ışını yapısı elde edilmiştir. Yapılar, zar proteinlerinin yapılarını kristalize ederken ortaya çıkan genel problemler göz önüne alınarak analiz edilmiştir. Bu çalışmada, insan GluNR1-GluNR2A tipi NMDA reseptör yapısı, Xenopus laevis şablonuna dayalı homoloji modellemesi ile
modellendi. Sonra Elastic Network analizi yapıldı. Daha sonra, NMDA reseptörü nispeten büyük bir sistem olduğundan ve modelleme geometrik parametrelerin optimizasyonu olduğundan, tek tek monomerler üzerinden modelleme, tetramer halinde modelleme, döngüler olmadan bir tetramer olarak modelleme ve ardından döngü modellemesi gibi birkaç farklı strateji izlendi. İnsan NMDA reseptörü için homoloji modellemesi yapılmıştır. Puanlama fonksiyonuna göre modeller seçildi ve daha sonra, proteinin fonksiyonunu düzenleyen yapısal değişkenliklerin dinamiklerini anlamak için ENM ile NMA gerçekleştirildi. NMDA reseptörünün en yavaş modları olan 20 mod, 8 parametreye göre incelendi. Kapı mekanizması ile ilgili olarak 3. en yavaş mod dikkat çekici bulunmuştur.Mod 3'te, membrana paralel olarak TMD’nin saat yönünde dönerken, LBD ve TMD’nin birlikte saat yönünün tersine dönmesi ile oluşan twist hareketi kanalın açılmasına neden olur. Mode 3’de TMD girdle, LDB ve M3-TMD bağlantısı arasındaki ilişki gözlenmiştir. Benzer şekilde, Mod 9’da da, Mod 3 gibi bu ilişki gözlenmiştir. Ek olarak Mod 9, kanal ekseni boyunca bir nefes alma hareketi veya
ix
genişleme hareketi gibi hareket etmektedir. Bu modların yakın gelecekte apo ve ligand bağlı insan NMDA yapısının Moleküler Dinamik çalışmalarıyla daha iyi test edileceğini umuyoruz.
x
Acknowledgements
There are many people who helped to make my years at the graduate school most valuable. First, I thank Asst.Prof.Dr. Şebnem EŞSİZ, my dissertation supervisor. Having the opportunity to work with her over the years was intellectually rewarding and fulfilling. I also thank my colleague, Muhammed AKTOLUN, who contributed much to the development of this research starting from the early stages of my dissertation work. Also, my sincere thanks go to Prof. Kemal Yelekçi and Asst. Prof. H. Bahar ŞAHİN for their guidance and insights.
Most importantly I would like to express my deep gratitude to my thesis committee: Prof. Kemal YELEKÇİ and Prof. Safiye ERDEM.
The last words of thanks go to my family and friends for their endless support.
i
List of Figures
Figure 1: NMDAR subunits illustration. NMDAR contains dimers of GluNR1-GluNR2A dimer. ... 23
Figure 2: Structure of ion channel (TMD part).. ... 24
Figure 3: A) Differences between the "4TLM" and "4PE5" structur ... 25
Figure 4: Pore profiles of transmembrane parts of structures "4TLM" segments... 25
Figure 5: Sequence alignment for the NR1 chain ... 27
Figure 6: Sequence alignment for the NR2A chain ... 29
Figure 7: A) The tetramer structure obtained using monomer structures. ... 31
Figure 8: Ramachandran plots. ... 32
Figure 9: Ramachandran plots of chains which are modeled as a monomer. ... 33
Figure 10: Dimeric structure. ... 34
Figure 11:A)Loop structure modeled as tetramer ... 36
Figure 12: Visualization of 8 parameters. ... 38
Figure 13: The change of parameters along the slowest 5 modes. ... 39
Figure 14: The change of parameters along the 2nd slowest 5 modes. (mode6-mode10) ... 40
Figure 15: The change of parameters along the 3th slowest 5 modes. (mode10-mode15) ... 41
Figure 16: The change of parameters along the 4th slowest 5 modes. (mode15-mode20) ... 42
Figure 17: Visualization of Mode 3. ... 43
Figure 18: Visualization of Mode 9. ... 44
ii
List of Abbreviations
3D 3 Dimensional
AMPA -Amino-3-Hydroxyl-5-Methyl-4-Isoxazole-Propionate
AMPA R -Amino-3-Hydroxyl-5-Methyl-4-Isoxazole-Propionate Receptor
ATD Amino Terminal Domain
CNS Central Nervous System CTD Carboxy Terminal Domain
DAG Di-Acyl-Glycerol
DOPE Discrete Optimized Protein Energy ENM Elastic Network Model
FDA Food Drug Association
iGluR Ionotropic Glutamate Receptor
IP3 Inositol Triphosphate
KAr Kainate receptor
LBD Ligand Binding Domain
LGICs Ligand-gated ion channels
mGluR Metabotropic Glutamate Receptor
NMA Normal Mode Analysis
NMDA N-methyl-D-aspartate
NMDAR N-methyl-D-aspartate receptor NMR Nuclear Magnetic Resonance PDB Protein Data Bank
PDF Probability Density Function
pLGIC Pentameric ligand-gated ion channels SCR’s Structurally Conserved Regions SVR’s Structurally Variable Regions
iii
Table of Contents
Abstract ... vi Özet ... viii Acknowledgements ... x List of Figures ... i List of Abbreviations ... iiTable of Contents ... iii
1. Introduction ... 1
1.1. Ion channels ... 1
1.1.1. Voltage-gated ion channels ... 2
1.1.2. Mechanosensitive ion channels ... 3
1.1.3. Ligand-gated ion channels ... 3
1.1.3.1. Glutamate receptor superfamily ... 3
1.2. Structural analysis of NMDAR ... 8
1.3. Normal mode analysis of NMDAR ... 9
2. Methods ... 12
2.1. Structural Analysis of Proteins ... 12
2.1.1. Ab initio Modeling ... 13
2.1.2. Fold Recognition Modeling ... 13
2.1.3. Homology Modeling ... 14
2.2. MODELLER ... 16
2.3. Normal Mode Analysis ... 18
2.3.1. Standard Normal Mode analysis ... 18
2.3.2. Elastic Network Models (ENM) ... 20
3. Results ... 23
3.1. Analysis of two template structures ... 23
3.2. Homology modeling of Human NMDAR ... 27
3.3. Elastic Network Model analysis ... 37
4.Conclusion ... 46
1
1. Introduction
1.1. Ion channels
Many neurodegenerative diseases that occur in the central nervous system are associated with ion channels. Ion channels are membrane protein complexes and their function is to assist the diffusion of ions across biological membranes (Celesia, 2001). The plasma membrane is 6-8 nm in thickness and composed of lipids and proteins, while the lipid bilayer consists of the hydrophilic head and the hydrophobic tail groups and it is impermeable to ions. Ion channels assist ions to pass the membrane by forming 3-5 Å holes (Akay and Turanlig, 2010).
An ion channel can be in three different functional states under the influence of different control mechanisms: Closed-impermeable to ions (inactive), open-permeable to ions (active) and desensitized-decreased response to stimulant (insensitive) (Bernard and Shevell, 2008). Opening or closing motion of ion channels is called “gating”. Under normal conditions, membrane potentiation is observed due the electrical potential difference between the inside and the outside of the biological cell. Through the ion flow, the membrane potential is conducted along the channel and the electrical excitability of the cell occurs. Electrical excitability is defined as the state of the cell, which is able to receive internal or external stimuli. In non-excitable cells and in the basic states of excitable cells, the membrane potential is almost steady and is called resting potential. In such a situation, the membrane is called polarized meaning that the intracellular side of the membrane is negative, while extracellular side is positive. When the membrane potential of the cell rises and falls suddenly within a short time, it is called the action potential. Action potential then leads neighboring cells to similarly depolarize which means an increase of membrane potential. In nerve cells, it plays a leading role in communication among cells, whereas, in other
2
types of cells, the main function of this is to activate intercellular processes. Then repolarization occurs when the membrane potential decreases to negative after action potential is generated (Lodish et al., 2000). One of the major cellular events that occur with ion channels is the regulation of the osmotic balance, i.e. cellular pH. Overall, the ion channels are essential for the normal cellular functions of the nervous system with three important features (Bernard and Shevell, 2008);
• Rapid response to ion flow • Selective ion permeation
• Response to electrical, chemical and mechanical stimuli
Depending on the activation by certain stimuli, three major subclasses of ion channels are present. These are voltage-gated ion channels, mechanosensitive ion channels and ligand (neurotransmitter)-gated ion channels (Bernard and Shevell, 2008).
1.1.1. Voltage-gated ion channels
Voltage-gated ion channels are members of a large, broad-range gene family. Most of the ion channels in this family do the gating motion in response to the membrane depolarization (Hernandes and Troncone, 2009). The ion channels in this class are named as voltage-gated sodium (Na+), potassium (K+), calcium (Ca2+), and chloride (Cl-) channels. Voltage-gated ion channel family members have several roles. Potassium channels provide resting potential and repolarization after action potential. Sodium channels are responsible for the generation of the action potential. Calcium channels are responsible for the generation of the action potential in the heart and smooth muscle (Bernard and Shevell, 2008).
3
1.1.2. Mechanosensitive ion channels
Mechanosensitive ion channels are activated or inactivated under the influence of mechanical conditions as stretching, pressure change, or displacement (Bernard and Shevell, 2008). The cell membrane is the target for external stimuli (Martinac, 2004).
1.1.3. Ligand-gated ion channels
Ligand-gated ion channels (LGIC) are the members of ionotropic receptors, and they are a group of transmembrane ion channel proteins. LGICs allow ions such as Na+, K+, Ca2+, and/or Cl− to cross the membrane through binding of a ligand such as a neurotransmitter (Purves et al., 2008).
In the synaptic cleft, neurotransmitters, which are released forum presynaptic neuron, binds to the receptor of the postsynaptic neuron. If these receptors are ligand-gated ion channels, this binding creates a conformational change leading to open the ion channels, and resulting in ion flow across the cell membrane (Lodish H, Berk A, Zipursky SL, 2000).
There are at least two different domains in these proteins, one of which is a transmembrane domain, which includes the ion pore, and the other is an extracellular domain, which includes the ligand binding domain. LGICs are modulated by allosteric ligands, by channel blockers, or ions (Lodish H, Berk A, Zipursky SL, 2000).
1.1.3.1. Glutamate receptor superfamily
Glutamate receptors are in pLGIC family belonging to LGIC receptors that contribute to memory and learning functions, play a role in synaptic transmission and play role in the formation of neuronal connections during the development of the nervous system (Wollmuth and Sobolevsky, 2004).Glutamate receptors are localized in the postsynaptic membrane and have two types.
4 II- Ionotropic glutamate receptors (iGluR)
I- Metabotropic glutamate receptors (mGluR)
Metabotropic glutamate receptors are G-protein dependent receptors that increase intracellular inositol triphosphate (IP3) and diacylglycerol (DAG) levels, or modulate intracellular secondary messengers (Koruyucu, 2007). Upon activation of metabotropic glutamate receptors, glutamate amino acid acts as an excitatory neurotransmitter and needs to bind like other receptors in glutamate receptors family (Traynelis et al., 2010).
II- Ionotropic glutamate receptors (iGluR)
Ionotropic glutamate receptors (iGluRs) are ligand-gated ion channels that are activated by the neurotransmitter glutamate (Traynelis et al., 2010; Sukumaran et al., 2011). The ligand-gated ion channel family has three members: N-methyl-D-aspartate (NMDA) receptors, -amino-3-hydroxyl-5-methyl-4-isoxazole-propionate (AMPA) receptors and kainate receptors. They are named according to their activator molecules (Collingridge et al., 2009).
α-Amino-3-Hydroxy-5-Methyl-4-Isoxazolepropionate (AMPA) Receptors
AMPA receptors are members of ionotropic receptors that are found in the central nervous system. These receptors are primarily in charge of the rapid excitatory glutamatergic neurotransmission. The majority of AMPA receptors are heterotetrameric in nature and compose of two dimeric states of GluR2 and/ or GluR1, GluR3 or GluR4(Mayer, 2005; Greger, Ziff and Penn, 2007). There are four binding sites for each subunit of the AMPA receptors. Each binding site or sub unit can bind exactly to one agonist; in other words one agonist for each subunit (Mayer, 2005).The active site is presumed to be uniquely formed by the amino-terminal and the extracellular loop that is between the transmembrane helices 3 and 4 (Sukumaran et al., 2011). In an event where the agonist binds, an opening of the pore is observed after some of the two loops in ligand binding domain move
5
towards one another. The channel opens if and only if the two binding sites are bounded or occupied (Platt, 2007) thus increasing its current give rise to more available binding sites to be occupied (Rosenmund et al., 1998). When a channel opens, it may be subjected to a rapid desensitization causing the current to stop or reach a momentary state. The so-called mechanism of desensitization is assumed to arise from little change in the angle of the areas of the binding site which lead to closing the pore of the channel (Armstrong et al., 2006; Sukumaran et al., 2011).
Kainate receptors (KA receptors)
Kainate receptors, are ionotropic glutamate receptors in the central nervous system. Additionally, it is also identified that Kainate receptors are one of the two non-NMDA ionotropic glutamate receptors in the central nervous system (CNS). They were originally discovered by their preferential response to kainate, namely a rapid desensitization in its presence that separate these receptors from the other class of non-NMDA ionotropic glutamate receptor; AMPA receptors (Davies and Watkins, 1979; Bettler and Mulle, 1995). Kainate receptors have five receptor subunits GluR5, GluR6, GluR7, Ka1 and Ka2 (Hollmann, Maron and Heinemann, 1994), and tetrameric structure of Kainate receptor contains altered version of these subunits. It is possible GluR5-GluR7 are formed in homomericly or heteromericly, however KA1 and KA2 subunits are only combined with one of GluR5-GluR7 (Traynelis et al., 2010; Sukumaran et al., 2011).
N-Methyl-D-Aspartate (NMDA) Receptors
NMDA receptors (NMDAR) are ionotropic glutamate receptors located in the membrane of the nerve cells. The normal receptor activity has vital importance in consciousness and normal brain functions. Neuronal death occurs as a result of overstimulation of NMDA-type glutamate receptors and leads diseases such as stroke, epilepsy, Alzheimer's and Parkinson's. Therefore, drugs that block the protein have to work by protecting the normal function of the receptor. For instance, on
6
the market, the FDA approves “Memantine” for Alzheimer’s therapies since it blocks the open conformation of the ion channel. Memantine inhibits cell death due to excitotoxicity. Excitotoxicity means that cells are damaged or die due to overstimulation (Gillessen, Grasshoff and Szinicz, 2002; Molinuevo, Lladó and Rami, 2005).
The structure of the GluR family is heterotetramer. This heterotetramer structure consists of two dimers of dimers. There are seven different subunit types: NR1, NR2A-B-C-D and NR3A-B. NMDA receptors are commonly found throughout the brain (Ozawa, Kamiya and Tsuzuki, 1998).
NR1: NR1 is composed of 938 amino acids. It contains the binding site for glycine and D-serine.
NR1 receptor subunit expression is found almost everywhere in the Central Nervous System (CNS).
NR2: Contains the binding site for glutamate. There are 4 different groups:
NR2A: it consists 1464 amino acids, present in the brain and is expressed in the brain after birth. It weighs 165.5 kDA. Even if NR2A locates in the entire brain, more intensively it is found in the cerebral cortex, hippocampus, and cerebellum.
NR2B: 1484 amino acids are found in that subtype. It weighs 165.9 kDa. It is expressed in all brain and cardiac myocytes in the embryonic stage. Postnatal synthesis occurs only in the anterior brain. The level of NR2B is predominantly found in the anterior; cerebral cortex, hippocampus, septum, caudate, and putamen.
NR2C: NR2C consists 1233 amino acids. It weighs 135.4 kDa. It is expressed in the cerebellum after birth.
7
NR2D: There are 1336 amino acids in NR2D structure. It weighs 142.9 kDa. The amount of NR2D is high in both the middle and in the back of the brain. The NR2D is found at lower levels in the thalamus, the olfactory bulbs, and the brainstem.
NR3: NR3A and NR3B are two types. Ca+2 permeability in these subtypes is slow and long. The NR3A is expressed in the cortex, the hippocampus, the midbrain, the backbone, and the spinal cord (Cull-Candy, Brickley and Farrant, 2001).
The most common human NMDA receptors are the GluNR1 and GluNR2A subunits. NMDA receptors structurally consist of three domains; amino terminal domain (ATD) which is on the top of the extracellular part of the receptor, ligand binding domain (LBD) and transmembrane domain (TMD) which is inside the membrane. As a result of ion concentration difference between extracellular and intracellular sides, ions tend to flow to intracellular region (Schneggenburger et al., 1993; Jin et al., 2009; Yao et al., 2011; Dutta, Indira H Shrivastava, et al., 2012; Vinson, 2014). Activation of NMDA receptors occurs when two glutamate and two glycine molecules bind to the clamshell-like ligand binding domain (LBD) of the different subunits of the receptor. Upon glutamate and glycine binding, lower part of the clamshell comes closer to the upper part and packs the ligand in the binding site. This motion pulls the transmembrane domain up to the membrane and causes the opening of the ion channel. The opening allows cations such as K+ and Na+ to flow across the membrane and thus facilitating the nerve transmission via potentiation (Schneggenburger et al., 1993; Lee et al., 2014; Zheng et al., 2017). The NMDA receptor includes various regions that allosterically affect the NMDA receptor and modulate channel function, namely there are seven different binding sites (Zhu et al., 2013).
8
1.2. Structural analysis of NMDAR
Until May 2014, the only intact structure resolved by X-ray crystallography was AMPA-GluR2 which also belongs to the tetrameric ionotropic glutamate receptor family. However, although the structural similarity between AMPA and NMDA receptors is very high, the sequence similarity is low. Two very important intact NMDA X-ray structures have been resolved in 2014 from Rattus norvegicus and Xenopus laevis. First of them is a X-ray crystallography study carried out by Karakas and Furukawa, published in Science (Karakas and Furukawa, 2014). This work enlightened the entire structure of the NMDA receptor at a resolution of 4 Å. The second one was an NMDA-type glutamate receptor X-ray structure (Lee et al., 2014),which was published in Nature and analyzed by Lee and colleagues at resolutions of 3.7 Å and 3.9 Å.
Both structures were obtained in physiologically inactive state. These proteins have shown us that the structure of NMDA receptor is similar to the AMPA structure, which was analyzed in 2009 (Sobolevsky, Rosconi and Gouaux, 2009). However, the NMDA receptor has a significant difference from other glutamate receptors. In AMPA receptors, the activation occurs when only ligands bind to LBD, while, NMDA receptors can be activated by either ATD (molecule binding to this domain modulates activity) or LBD binding sites (Dutta, Indira H Shrivastava, et al., 2012). The main structural difference of the AMPA receptor from the new X-ray structures is that the domains outside of the ion channel are much more compact in the NMDA receptor(Karakas and Furukawa, 2014; Lee et al., 2014).
In addition to the intact receptor structure, antagonist (closed) and agonist (open) bound X-ray structures of the ligand binding domain were isolated. Also, many X-ray structures are present in different agonist/antagonist bound states, which were also isolated for the ATD. Some of these are GluA1(Yao et al., 2011), GluA2 (Jin et al., 2009; Sukumaran et al., 2011), GluN1 (Farina et al.,
9 2011), Zn+2 bound GluN
2B monomer structure (Karakas, Simorowski and Furukawa, 2009) and GluN1-GluN2B heterodimeric structure (Karakas and Furukawa, 2014; Lee et al., 2014).
Even if the high-resolution information is present, and it is assumed that the dynamic structures are directly related to their functions, the mechanisms of the receptors are still controversial. The X-ray structures mentioned above also have ambiguity. For example, in the X-ray structure obtained by Lee et al (Lee et al., 2014), the agonist is bound to the LBD and the antagonist is bound to the ATD of the X-ray structure. However, the ion channel is closed. But the protein can only be crystallized in this way in that resolution. Therefore, the obtained structures are needed to be examined very carefully.
In the molecular dynamics simulations of the ATD, the clamshell-like LBD motion and the "twist" motions of the ATD, two lobes rotating against each other were observed as dominant global protein movements (Dutta, Indira H Shrivastava, et al., 2012; Zhu et al., 2013). Finally, in August 2014, an article was published in Cell inspecting the 'desensitized' AMPA receptor. By collecting low-resolution images via the cryo-electron microscopy method they look for the molecule which is insensitive to the ligand molecule but closed to ion transport, (Dürr et al., 2014). The conformational change between the protein apo state (ligand free) and the 'desensitized' state of the protein has a large rotational and twisted motions of the ATDs and LBDs (Dürr et al., 2014). In such a large conformational change, `global` movements of protein domains rather than atomic local details are observed.
1.3. Normal mode analysis of NMDAR
Knowing the protein sequence, structure is not enough to understand the biomolecular interactions and function. Since proteins are not static but dynamic structures in solution it is necessary to
10
understand the dynamics of the structural changes which governs the function of the protein. Normal mode analysis is one of the frequently used methods for simulation of the dynamic properties of protein systems. In this method, the potential energy function used during the simulation of the protein is an approximation to the function at the atomic level. At low energies, the molecule is assumed to be located near the bottom of this potential energy surface. Based on the normal mode analysis method, an elastic network analysis has been developed in which the coarser grains (protein only represented by C-alpha atoms) are displayed. This method has previously been used more generally to determine protein dominant motions and has been successfully applied to Torpedo, α7 and α4β2 nicotinic acetylcholine receptors (Taly et al., 2005; Cheng et al., 2006) to obtain a sketchy open-channel structure. In addition, this type of analysis was performed for the ATD portion of the NMDA receptor and the ATD rotation of the two loops in opposite directions, i.e., twist mode, was observed (Dutta, Indira H. Shrivastava, et al., 2012). However, none of the computational methods mentioned to include the entire NMDA receptor, i.e., ATD, LBD and TMD.
From this point of view, in order to design higher efficacy drug molecules, it is very important to understand how the molecules of the receptor bind to different regions that inactivate or activate the receptor and how the open channel structure differs from the closed channel structure. Once we understand these, new molecules targeting these regions and fitting into the gaps in the protein structure can be designed by identification of important binding points.
In this work, the structure of GluNR1-GluNR2A type human NMDA receptor will be modeled by homology modeling method using these two constructs which are Rattus norvegicus from mouse (Lee et al., 2014) and Xenopus laevis from Xenopus laevis (Karakas and Furukawa, 2014). Then,
11
normal mode analysis will be performed with elastic network model to understand dynamics of the structural changes which governs the function of the protein.
12
2. Methods
2.1. Structural Analysis of Proteins
The most common experimental technique used for structure determination of proteins are X-ray crystallography and nuclear magnetic resonance (NMR) spectroscopy, both of which provide atomic resolution information (Brändén and Tooze, 1999). Cryoelectron microscopy is used to produce low-resolution structural information about large protein complexes and viruses; Electron crystallography, a variant of which, in some cases, produces high-resolution information, especially for membrane protein crystals’ two dimensions (Gonen et al., 2005).
There are many more genes than the number of structurally well-known proteins. Moreover, those proteins whose structure has been resolved are those that can be easily subjected to experimental techniques. For example, it is relatively easy for the globular proteins to be crystallized for X-ray crystallography. Crystallization of membrane proteins, on the other hand, is difficult and is represented in a small number in the PDB (Walian, Cross and Jap, 2004).
Because of the insufficiency of experimentally solved structures, theoretical methods are also needed (Kundrotas, Lensink and Alexov, 2008). Theoretical methods are becoming more important as they not only determine the three-dimensional structure of proteins but also have the potential to predict relation between a specific function and the structure (Dandekar and Koni, 1997). For example, proteins translated from similar genomic sequences generally have similar functions. For this reason, the functions of the translated proteins in a recently sequenced genome can be explained by using sequence similarities of the other organisms’ genomes (Reeck et al., 1987).
13
In addition, the 3D protein structure is generally better conserved than the protein sequence, and structural similarity is a good indicator of similar function in two or more proteins (Whisstock and Lesk, 2003; Sleator and Walsh, 2010).
The theoretical methods to determine the 3-D structure of proteins can be examined in three main categories.
2.1.1. Ab initio Modeling
Ab-initio modeling is one of the first emerging computational modeling methods. Ab-initio modeling estimates the structure based on primary amino acid sequence. Ab-initio modeling uses a designed energy function to conduct a conformational search according to the peptide sequence. Via using energy function, a number of possible conformations are obtained, and then the model, which has the lowest energy value, is chosen among all. (Ab initio) To evaluate a successful modeling;
1) Thermodynamically stable conformation of native protein structure is needed to be obtained, therefore, an accurate energy function is required.
2) Search method must be efficient to find low-energy states rapidly.
3) Selection of native-like models from a collection of decoy structures is necessary (Chen et al., 1999; Hardin, Pogorelov and Luthey-Schulten, 2002; Wiltgen, 2009)
2.1.2. Fold Recognition Modeling
Fold recognition method is based on the search for protein folds that match a particular sequence. Rather than how the protein sequence folds, it is investigated whether folding is consistent with that sequence. In other words, the main concept in fold recognition is to compare a target sequence to other folded templates in a given library. This process is enhanced by incorporating energy
14
potentials and/or similar scoring function or method. Although this method does not always give definitive results, success is achieved by studies on known protein constructs, secondary structure predictions and target protein function (Rice and Eisenberg, 1997).
2.1.3. Homology Modeling
Homology modeling is an effective theoretical method used to construct a three-dimensional model for a protein whose structure is not known. This method is known as comparative modeling. During the development of this method, there has been a significant increase in the number of three-dimensional models of proteins (Kundrotas, Lensink and Alexov, 2008). In homology modeling, the template structure, also referred to as the known structure, is used to model the unknown structure of the target protein from its known sequence.
The first step in homology modeling is the identification of the best template structure for the target sequence. The identity between the target sequence and a possible template is found by pairwise sequence alignment programs such as BLAST (Altschul et al., 1990) or FASTA (Pearson, 1990). Identification of the template is the critical step, since the template structure will be comparatively replicated into the target sequence. To identify these hits, the program compares the query sequence to all the sequences of known structures in the protein data bank. At least a 30% similarity between the template sequence and the target sequence is required for modeling the target sequence while a 40% and above similarity is considered to be a good sequence match (Fiser and Šali, 2003; Krieger, Nabuurs and Vriend, 2003; Foster et al., 2008). The main assumption in here is again that the structure of the protein is better conserved than its sequence. Protein structure databases are available for searching template sequences, and from these databases template sequences that are most closely resemble the target sequence are selected. After having identified one or more
15
possible modeling templates, more sensitive methods are needed to be used to get better alignment (Šali and Blundell, 1993; Fiser and Šali, 2003).
It may be difficult to align two sequences in a region where the percentage sequence identity is very low. Then other sequences from homologous proteins are used to find a solution. Many programs are available to align several related sequences, for example CLUSTALW (Thompson, Higgins and Gibson, 1994), and the resulting alignment contains a lot of additional information.
Multiple sequence alignment method is used to produce a larger number of potential templates and to identify better templates for sequences that have only distant relationships to any solved structure (Thompson, Higgins and Gibson, 1994).
After the alignment, structurally variable regions (SVR’s) and structurally conserved regions(SCR’s) are analyzed before creating a model. While SCR’s correspond to the most stable structures and usually secondary structure units such as helices and beta sheets, SVR’s corresponds to the least stable and usually loop regions of protein. In the alignment, SCR’s are the sequence regions with lowest level of gapping and highest-level sequence conservation, but SVR’s are the sequence with highest level of gapping and lowest level sequence conservation. The backbone maps are created using the atomic coordinates of the conserved regions of the template structure. For different amino acids, only backbone coordinates (N, Cα, C and O) are transferred to the target protein. For similar amino acids, the backbone coordinates are transferred to the query protein and the side chain atoms are displaced relative to the χ angles, whereas, for identical amino acids, all atomic coordinates (X,Y,Z) are transferred (Krieger, Nabuurs and Vriend, 2003).
Side chains of the proteins tend to be in a limited number of low energy conformations, therefore instead of considering all possible conformations, only a small number of side chain conformations can be used to define frequently occurring rotamers of side chain. Two types of rotamer libraries
16
have been developed, a back bone-independent library (Ponder and Richards, 1987; Tuffery et al., 1991; Lasters, Desmet and De Maeyer, 1997; Lovell et al., 2000) and a backbone-dependent library (Dunbrack and Karplus, 1993). Both have been widely used for predicting side-chain conformations. Consequently, the speed and efficiency of finding an optimal protein conformation is dramatically increased (Liang and Grishin, 2009). Rotamers, which are taken from these libraries, are used to construct structurally variable regions’ side chain via superposition algorithm.
The stereochemistry of the newly created models is weak and for this reason, the bond geometry of the model is often re-evaluated by removing inappropriate bonds; followed by thermodynamically energy minimization calculation.
A good protein structure has minimum disallowed torsion angles, covalent and non-covalent energies, radius of gyration, number of buried charges, internal cavities, and also maximum number of hydrogen bonds, buried hydrophobic accessible surface area, exposed hydrophilic surface area.
2.2. MODELLER
MODELLER is a computer program used in the production of homology models based on the protocol described in homology modeling, (section1.1.2). It implements a technique inspired by NMR, known as satisfaction of spatial restraints, by which a set of geometric criteria is used to create a probability density function (PDF) for calculating the position of each atom in the target protein. The method is based on an alignment input sequence between the amino acid sequence to be modeled and the protein model whose structure has been resolved. Basically, atom-atom distances and dihedral angles are obtained from the template structure, then used in the target
17
structure according to sequence alignment in order to get correct bond length and angle preferences.(Martí-Renom et al., 2000; Fiser and Šali, 2003)
The program also includes a limited functionality for predicting the structure of protein loop regions which are often very variable even among homologous proteins by the Ab initio method. And so it is difficult to predict the structure by homology modeling (Šali and Blundell, 1993).
MODELLER protocol evaluates protein structure using the Probability PDF energy data and Discrete Optimized Protein Energy (DOPE) scoring function (Martí-Renom et al., 2000; Fiser and Šali, 2003).
In order to determine of the quality of the model for that particular residue, the Probability Density Function (PDF) energy regarding each residue is summed. Using the energies is an effective way to compare different models. If the energy in a given region of a model is low, that means the model is probably better in that region than the other models. In case of these models have been constructed with different initial alignments of the model sequence and homologous proteins, lower energy is an evidence for better alignment. Either residue or atomic based statistical potentials are used as quality indicators of protein structures and as potential energy functions in predicting protein structures (Martí-Renom et al., 2000; Fiser and Šali, 2003).
DOPE, is a statistical potential used to evaluate the homology model in predicting protein structure resolution. DOPE is based on an improvement in the reference state that corresponds to non-interacting atoms in a homogeneous sphere with the radius dependent on the native structure of a sample. It is used to evaluate the energy of the model of protein generated through a number of iterations by MODELLER, which produces homology patterns taking spatial constraints into account. Templates returning the minimum value of DOPE score can be chosen as the best
18
probable structures. The DOPE method is generally used to evaluate the quality of a structure model as a whole (Šali and Blundell, 1993; Fiser and Šali, 2003).
We also used several programs such as HOLE (Smart et al., 1996) and PROCHECK(Laskowski et al., 1993) to control protein properties. HOLE is a tool to find and analyze the pore of the channel. The method needs a predefined starting point in the channel and related direction of the channel. Monte Carlo method is preceded to determine the accurate direction of the pore. The algorithm proceeds from the specified initial point and goes through the direction of the channel to find possible points until finding endpoint of the channel (Smart et al., 1996). PROCHECK is a software used to calculate the residue angles (phi and psi angles) of protein (from pdb file) and analyze distribution of them with respect to the different regions of the Ramachandran plot. With this software, the percentage of residues is calculated in each plot for the most favored, additionally allowed, generously allowed and disallowed regions. According to results of calculations, quality of the model is determined if the rate of residues in most favored regions is over 90%. If so, then the model is thought to be acceptable (Laskowski et al., 1993).
2.3. Normal Mode Analysis
2.3.1. Standard Normal Mode analysis
Normal mode analysis (NMA) is a technique to determine conformational changes of large biomolecules (Brooks et al., 1983; Go, Noguti and Nishikawa, 1983). Though NMA is related with the experimental techniques of infrared and Raman spectroscopy, recently it is also used to predict functional motions in biomolecules such as proteins. Functional motions of proteins are connected with the function of proteins and result of interacting with different molecules. In normal mode analysis, the normal modes with the lowest frequency means largest fluctuation are assumed to be the functionally relevant ones. Because large fluctuations, like function, are
19
evolutionarily protected, they do not occur with the help of chance. By comparing the experimental data with the predictions of normal mode analysis this assumption was made. And this comparison suggests that low-frequency normal modes are often relevant to the function (Tirion, 1996; Tama and Sanejouand, 2001; Foster et al., 2008).
NMA is a harmonic analysis that assumes that, over the range of thermal fluctuations, the conformational energy surface can be characterized by the parabolic approximation to a single energy minimum. Potential energy function is written as the following by Taylor series expansion:
V (x) = V (x0) + V′(x0)(x − x0) +
V′′( x0)(x − x0)2
2 + . ..
At the minimum of the potential energy surface V′(x0) is 0. Moreover V (x0) is taken as 0 in NMA analysis. Thus, the only term left is the second derivatives when the molecule under investigation is at the minimum. Since the system is in equilibrium when all the displacements are zero, the restoring force along each cartesian coordinate of each atom will be linear. This is equivalent to the statement that the 3N dimensional potential energy function has a global minimum at this atomic configuration. which in turn implies that for small displacements the potential can be represented as a quadratic expansion about the equilibrium configuration(Case, 1994; Bahar and Rader, 2005).
NMA is accurate since it uses force fields, which are used in molecular dynamics simulations. On the other hand, both experimental and computational studies show that harmonic approximation fails at physiological temperatures for proteins because at that temperature it is not a single energy minimum but multiple minima energy crossing. Therefore, it has to be known that NMA has limitations at functioning temperatures(Tirion, 1996; Tama and Sanejouand, 2001; Foster et al., 2008).
20
In order to do a standard Normal Mode Analysis, coordinates of atoms, a force field, and a software for calculations are required. 3 main simple steps are necessary to do NMA,
1) Minimization of potential energy as a function of atomic coordinates.
2) The calculation of “Hessian” matrix. Hessian matrix is second derivative of the potential
energy.
3) Diagonalization of the Hessian matrix.
3th step calculates eigenvalues and eigenvectors. Eigenvalues represents the magnitude of the vector, and eigenvectors represents the direction of the vectors. Size of the molecule is related to computational cost. Energy minimization and diagonalization which has 3N x 3N matrix is demanding of CPU time and memory (Tirion, 1996; Tama and Sanejouand, 2001; Foster et al., 2008).
2.3.2. Elastic Network Models (ENM)
The Elastic network model was developed as a result of the encountered computational difficulties of the NMA. It was first developed by Tirion (Tirion, 1996) in protein-related studies. In this method, NMA is performed after the proteins have been greatly simplified (Tirion, 1996). As the name implies, all the atoms are assumed that they are connected by elastic connections and the potential energy is composed of these elastic harmonic spring interactions(Atilgan et al., 2001).
ENM, assumes that all bonded and non-bonded interactions are not specified in the folded structure. Cα atoms of residues are accepted as interaction centers(nodes). The elastic network connects all adjacent nodes via springs with a force constant γ and produces conformations that define the fluctuations of the residues from the averages. ENM analyzes harmonic vibrations of
21
protein structures around equilibrium states and predicts the orientations and magnitudes of collective motions. Total harmonic potential energy of neighboring nodes can be expressed as:
𝑉 = (γ
2) [∑ ℎ
𝑁
𝑖,𝑗
(𝑟𝑐− 𝑅𝑖𝑗)(𝑅𝑖𝑗 − 𝑅𝑖𝑗0)2]
γ is the harmonic force constant, 𝑟𝑐 is the cutoff distance,𝑅𝑖𝑗 is the instant distance, 𝑅𝑖𝑗0 is the
equilibrium distance between i and j in the native structure, h(𝑟𝑐 − 𝑅𝑖𝑗) is the Heaviside step function which is 1 if (𝑟𝑐 − 𝑅𝑖𝑗) ≥ 0 and zero otherwise (Tirion, 1996; Atilgan et al., 2001; Ozer,
Schiffer and Haliloglu, 2010).
The only parameter, which is predetermined, is cutoff distance. All atomic interactions are included in the network in accordance with that parameter. Cutoff distance is used as 15 Å. Information that is necessary to predict anisotropic motions which means directionally dependent, is included in force constant matrix. The force constant matrix can be described as a Hessian matrix: 𝓗 = [ 𝐻11 𝐻12 𝐻13 𝐻1𝑁 𝐻21 … … 𝐻2𝑁 𝐻31 … … … 𝐻𝑁1 … … 𝐻𝑁𝑁 ]
The Hessian matrix 𝓗 is a 3N × 3N symmetric matrix that including information about anisotropic motion is related with orientation of nodes i, j. Elements of Hessian matrix are super elements, each of size is 3x3 and given by second derivatives of the potential equation respect to 𝑅𝑖 and 𝑅𝑗
22 𝑯𝒊𝒋= [ 𝜕2𝑉/𝜕𝑋𝑖𝜕𝑋𝑗 𝜕2𝑉/𝜕𝑋𝑖𝜕𝑌𝑗 𝜕2𝑉/𝜕𝑋𝑖𝜕𝑍𝑗 𝜕2𝑉/𝜕𝑌 𝑖𝜕𝑋𝑗 𝜕2𝑉/𝜕𝑌𝑖𝜕𝑌𝑗 𝜕2𝑉/𝜕𝑌𝑖𝜕𝑍𝑗 𝜕2𝑉/𝜕𝑍𝑖𝜕𝑋𝑗 𝜕2𝑉/𝜕𝑍𝑖𝜕𝑍𝑗 𝜕2𝑉/𝜕𝑍𝑖𝜕𝑍𝑗 ]
Covariance matrix includes information about fluctuations of the structure according to Gaussian distribution. In order to obtain covariance matrix, Hessian matrix should be inverted. As Hessian rank is 3N-6, it is not invertible. To obtain pseudo inverse, solution is obtained by using:
𝐻 = 𝑈𝐷𝑈𝑇
An orthogonal transformation of the real symmetric Hessian matrix gives the normal modes of the elastic network with 3N-6 nonzero eigenvalues λi and corresponding eigenvectors Ui.
𝐻−1 = ∑ 1
λ𝑖 3𝑁−6
𝑖=1
𝑼𝒊 𝑼𝒊𝑻
This method has two important features when comparing with NMA. The first of these is that the energy minimization is not needed because all bonds between atoms are at the minimum energy length. And the second, the diagonalization is easier than NMA since the total number of atoms is reduced. If only Cα atoms is used, this leads ten-time reduction in the number of atoms (Tirion, 1996; Atilgan et al., 2001; Cheng et al., 2006; Foster et al., 2008).
In contrast to NMA, two parameters must be determined in the ENM. One of them is force constant or spring constant denoted as γ and second one is a cut-off distance denoted Rc or rc. Trion's has
shown that there is no serious difference between these two methods. Results of the ENM and NMA studies with 20 proteins from X-ray structures were very similar (Tama and Sanejouand, 2001).(Foster et al., 2008)
23
3.
Results
3.1. Analysis of two template structures
Homology modeling based on the recently available X-Ray structures was used for developing human GluNR1-GluNR2A type NMDAR ion channel structure. The two structures were resolved in 2014, and one was published in Science the other one in Nature, with X-ray structures around 4 Å and 3.7 Å resolution. This was a noticeable development in clarification of the structure of the NMDA heterotetramer. The sequence identity of the human NMDA receptor and X-ray structure derived from the Xenopus laevis3.7 Å X-ray structure (Lee et
al., 2014) is 92% and 81% with human NR1 and NR2A, respectively and the structure obtained from Rattus norvegicus (Karakas and Furukawa, 2014) is about 98% for both chains.
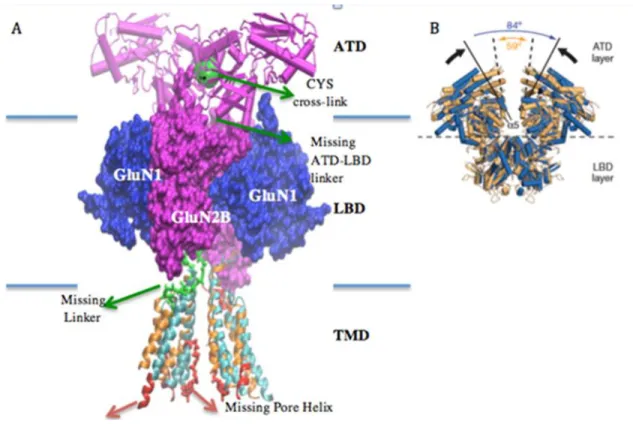
Using Rattus norvegicus NMDA receptor as the template for homology modeling seemed more reasonable since it has higher sequence identity to human sequence. Unfortunately, in order to crystallize these structures, a number of mutations have been introduced in both X-ray structures. For instance, approximately 15 neutralizations and 5 CYS cross-linking mutations were added to the Rattus norvegicus structure. Four of the CYS mutations (yellow bulks indicate cross link locations) are shown in Figure 2. These mutations link subunit M4 and M1 helices. The CYS mutations in the transmembrane domain on each subunit can be crucial in terms of transmembrane helices moving together when channel is gating. In other words when these mutations are recovered, the structure can gain freedom between the subunits. (Lee et al., 2014)(Karakas and Furukawa, 2014)
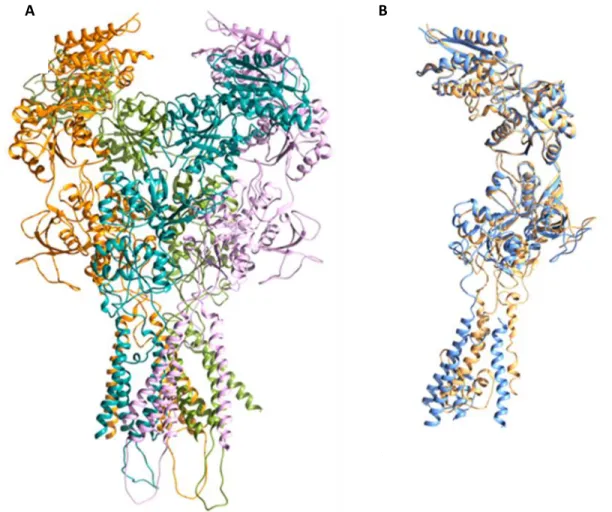
CTD Figure 1: NMDAR subunits illustration. NMDAR contains dimers of GluNR1-GluNR2A dimer.
24
There was a K216C mutation that links ATD parts in the Xenopus laevis structure This crosslinking can be thought not to have a significant effect on the ATD structure. However in the absence of this mutation, ATD fragments were observed to be opened approximately 25 degrees (Lee et al., 2014). Thus, K216C mutation may affect in opening and closing the LBD and TMD (Figure 3B)(Lee et al., 2014).
As a result of the abovementioned reasons, we focused primarily on the comparison and stability of these two NMDA X-ray structures before starting to model the human receptor. In Figure 3A, there is a comparison of the structure of Xenopus laevis and Rattus norvegicus. Especially we concentrated on the TMD part since it was the most challenging part to crystallize, the ion channel part and it was obtained by modeling using the potassium channel template (Lee et al., 2014). Figure 3A reveals that the M2-M1 linker helix, which plays an important role in channel closure in the transmembrane portion of the Rattus norvegicus structure, was not fully resolved and some other helical structures are missing (red parts). In addition, since it was not possible to obtain a stable TMD structure, the different subunits of TMD are linked by CYS links as indicated above. Xenopus laevis, that is, the structure from Nature publication seems less modified for TMD segment. But in that case, the two loop structures that we believed might be important in GluN2B were cut off. They are the loop structure of 9-10 amino acids long and connecting the M2 helix with the M1 helix and the M3 helix to the LBD region (Karakas and Furukawa, 2014; Lee et al., 2014).
Figure 2:
Figure 2: Structure of ion channel (TMD part). Red beads indicate TMD girdle (top), green beads TMD bottom, yellow beads cross link locations.
25
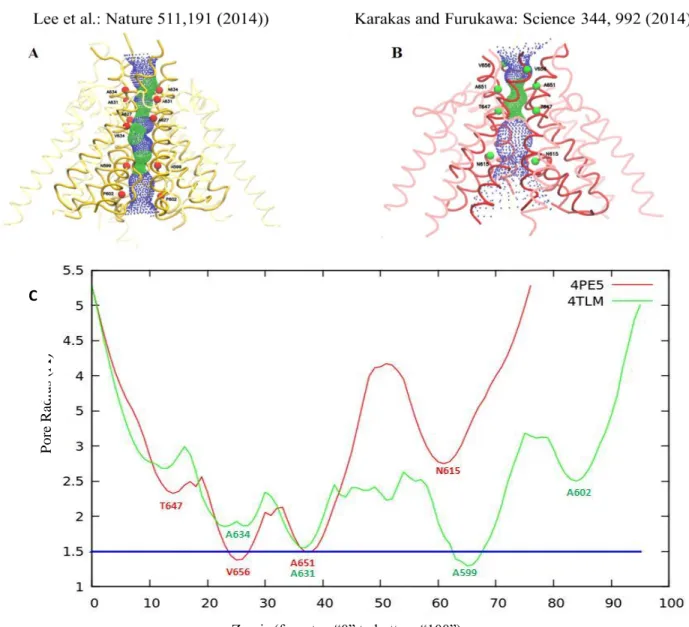
In addition, the ion-channel radius profiles were calculated using the Hole program (Smart et al., 1996) in both structures (see Figure 4C). Radius profiles along the channel of 4TLM(Xenopus laevis) and 4PE5(Rattus norvegicus) structures are shown in Figure 4C. Through the same program, the surface through the channel is also shown in Figure 4A and 4B in the order of 4TLM and 4PE5. Two girdles are observed from the plot. The first of these girdles (TMD girdle) was observed at the top of the M3 helix, i.e. near the end of the channel close to the LBD (between 30-40 in the Z axis in Figure 4). The second girdle named as TMD Bottom girdle was observed at the lower part of the point where the end of the M2 helix. This is around 65 Å in the Z axis in Figure 4C.
Missing TMD segments
Figure 3: A) Differences between the "4TLM" and "4PE5" structures, particularly as they concentrate on the TMD portion. B) Disulfide bridge mutation in the ATD region and the observed increase in angle in the absence of this mutation.
26
The second girdle region in the X-ray structure from Science publication is absent. The Xenopus laevis structure seems more detailed in terms of channel structure. As already mentioned above in the Rattus norvegicus structure, the M2 helix in the channel has not been resolved. The second girdle region corresponds exactly to this point. As a summary, our analysis showed that the TMD structure was more detailed and complete, thus Xenopus laevis structure was picked as the template for the human receptor.
Z-axis (from top “0” to bottom “100”)
P o re R ad iu s ( Å ) C
Figure 4: Pore profiles of transmembrane parts of structures "4TLM" (A) (yellow) and "4PE5" (B) (red). The small green dots show the narrow parts of the canal and the blue dots show the larger parts. The helixes forming the ion channel are shown in bold colors
27
3.2. Homology modeling of Human NMDAR
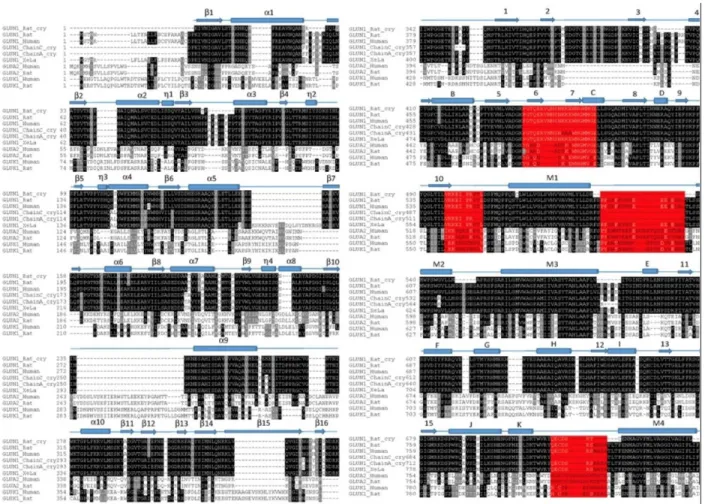
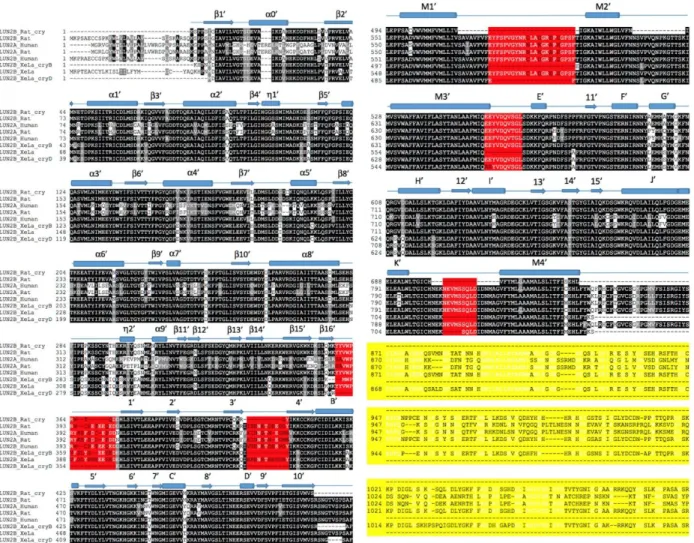
Sequence alignment was performed by assigning GluNR1-GluNR2A human sequences and sequences obtained from Xenopus laevis structure in ClustalW (Thompson, Higgins and Gibson, 1994). In the alignment, sequences of Rattus norvegicus, Xenopus laevis and all x-ray structures from the same family for the NR1-chain were used. These X-ray structures are Rattus norvegicus sequences, (Figure 5 and 6, GluNR_rat), the Xenopus laevis sequence (Figures 5 and 6, GluNR_xela), and the AMPA Rattus norvegicus A2 sequence (Figure 5 GluA2_rat) and Kainate receptor K1 chains that are more distant from the glutamate receptor family (Figure 5 GluK1_rat). The sequence similarity of the AMPA and kainate chains for the NR2A chain was low, thus they were only used in NR1 chain alignment.
28
Figure 5 shows ClustalW results for NR1 subunit. The Xenopus laevis X-ray structure of the NMDA receptor is a heterotetramer and there are two types of chains in the structure. These are NR1 and NR2B chains. In alignment, the chain A corresponds to NR1 and chain B corresponds to NR2B. Although the sequence of A and C chains was the same, there are variabilities in the parts resolved in X-ray structures. The chains in the crystal structures are shown separately for the Xenopus laevis sequence (Xenopus laevis sequence and two different X-ray sequence). And also In Figure 5, chain B and chain D, so that NR2B, are also shown separately for the Xenopus laevis sequence, since their sequences show variabilities in the resolved regions, even though the sequences are identical.
29
In Figure 5 and Figure 6, the black colored parts show conserved sequence regions. The parts colored with red show the structural regions that are present in the human sequence but not in the template Xenopus laevis structure. Figure 1 shows general the monomer illustration of the NMDA receptor. In Figure 5, the yellow-blotted portion shown at the end of NR2A sequence alignment is the intracellular loop portion of the human structure. This region was the Carboxy Terminal Domain (CTD) section in Figure 1, and removed from our modeling studies. This is because it was unlikely to properly model a loop structure of about 200 amino acids without any template structure.
30
The obtained alignment of templates sequences and human sequences was then transferred to homology modeling part. Homology modeling was performed using the MODELLER (Fiser and Šali, 2003) program.
A homology model with such a high sequence similarity is normally not difficult. But the fact that the size of the protein and some loop structures has not been resolved by X-ray has caused some problems in the model. So, two different ways for homology modeling were applied.
1) Modeling as a tetramer: The NMDA receptor is composed of 4 different chains. Chain A is NR1
in the X-ray structure, chain B is NR2B, chain C is NR1 and chain D is NR2B. These four chain templates were assigned to the modeling program as a tetramer via the tetramer template structure.
2) Modeling by individual monomer: Each chain monomer was given separately as a model. As a
result, the best model for each chain was selected and the tetramer structure was obtained by being structurally aligned to the template tetramer.
These two modeling strategies have the following differences: When independent chains are modeled, better quality models can be obtained since the optimization part becomes smaller. But at the same time, these chains are not independent of each other structurally. Since the chains are in contact with each other, modeling as a tetramer seems more accurate. In other words, in the homology modeling as a tetramer, neighboring atoms of different chains are represented more accurately during optimization.
31
The structures modeled by the two methods are shown below. The models were obtained by the MODELLER program by producing 100 models with a high degree of "refinement". The best of 100 models was selected using the scoring function of DOPE (Fiser and Šali, 2003)in the same program.
Figure 7A shows the model in which the chains modeled as monomers. In Figure 7B, the structural alignment of the structured NR1 (orange) and X-Ray C (blue) chains modeled as tetramers is shown.
Figure 9: A) The tetramer structure obtained using monomer structures. NR1 (pink) modeled from A chain, NR2A (light blue) modeled from B chain, NR1 (orange) modeled from C chain, NR2A modeled from D chain
B A
Figure 7: A) The tetramer structure obtained using monomer structures. NR1 (pink) modeled from A chain, NR2A
(light blue) modeled from B chain, NR1 (orange) modeled from C chain, NR2A modeled from D chain (green). B)
NR1 structure (orange) modeled from the C-chain of the structure modeled as tetramer, template structure C-chain
32
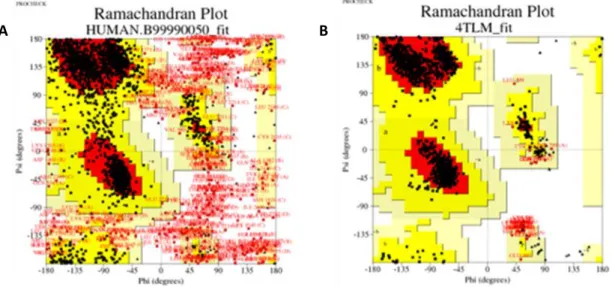
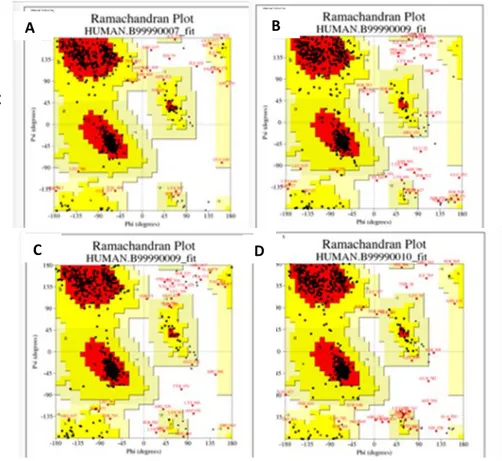
In addition to the models selected by the DOPE scoring method, the orientation of the side chains has been tested for clashing residues with each other via using PROCHECK (Laskowski et al., 1993) program. Figure 8 shows PROCHECK Ramachandran plots obtained by modeling all chains together. The percentage of amino acids found in the allowed "dihedral" angle combinations in the Ramachandran plots was 77% for the model, while the value for the template structure was 94%. The reason for confirming the template in addition to the homology model is that the template directly influences the homology model. That is, if there is a trouble with the angles in the template, the model would inherit those angles from template. But in our model, there was not a situation like that. When modeling was done with individual chains, this value reached 86% as an average for each chain. These results are shown in Figure 9 for the individual chains in the model.
A
Figure 8: Ramachandran plots. A) The results of the model obtained by modeling as tetramer. B) The results of the
template structure
B
Figure 8: Ramachandran plots. A) The results of the model obtained by modeling as tetramer. B) The results of the template structure
33
In addition, even when looking at the secondary structure of the models, some defects were observed, even in the case of alpha helices, for example. In Figure 7B, the NR1 structure modeled on the chain C was depicted by fitting the single-layer template structure. In this picture, the problems in one of the transmembrane part helices are clearly visible.
A A A A A A A A C C C C C C C C D D D D D D D D
Figure 9: Ramachandran plots of chains which are modeled as a monomer. A) NR1 modeled from chain A, B) NR2A modeled from B chain, C) NR1 modeled from C chain, and D) NR2A modeled from D chain.
A
C D
34 Once again, the problem in modeling was caused by two different reasons. The first was the existence of large loop structures that are not experimentally resolved, even though they are in the sequence of both X-ray structures of interest. However, only when these loops were cut off, the crystal structure could have been resolved.
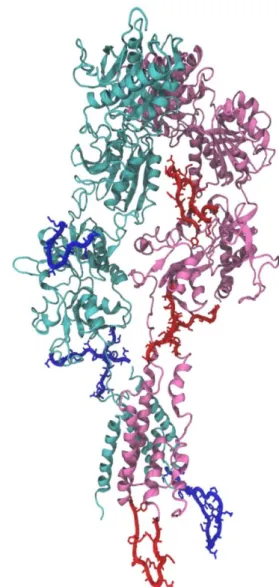
The second was that several loops in the human structure are not found in the Xenopus laevis or Rattus norvegicus sequences. Figure 10 shows the locations of loop structures found in both chains that are unresolved for NR1 and NR2A, or which are extra in human structure. These loops were observed between the ligand binding site and the ion channel, between the amino terminal and the ligand binding site, and in the intracellular portion of the ion channel. It had been
worked on a more detailed modeling of these loops on the B-plan because structural changes in the ligand binding site are important in the opening and closing motion the ion channel to ion transport.
Figure 10: Dimeric structure. NR1 (pink), extra loops
(Red) modeled from chain A, NR2A (light blue)
35 Modeling Without Loop Structures
First, the human structure was modeled as a tetramer, cutting off the loops that were not found in the X-ray structure. In the 100 models which were obtained from the MODELLER (Fiser and Šali, 2003), the best was selected using the scoring function. The Z-Dope scores obtained for model, which has loop structures, was around 1,06, but for this model it fell to -0,3. The Z-Dope MODEL was the normalized scoring function. Positive values indicate uncertain models, and when the score was -1, they indicate correct models as "native" structure.
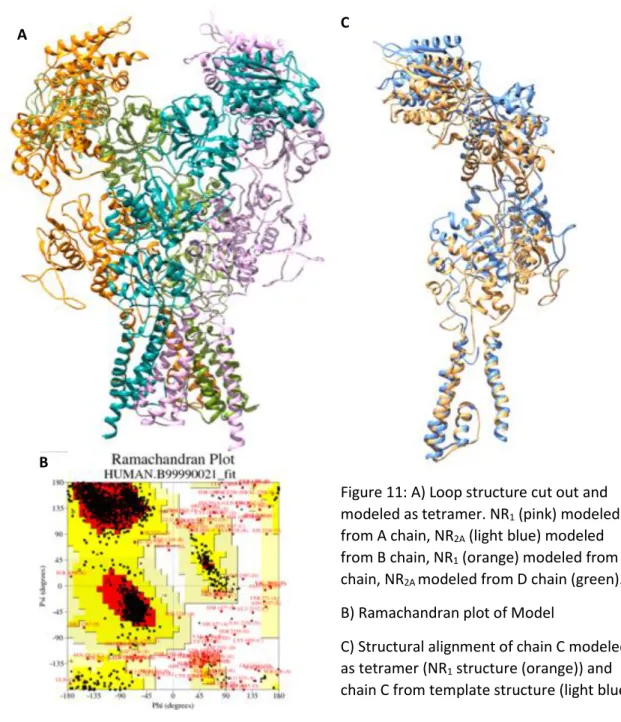
The tetrameric model without the loop is shown in Figure 11A. In addition, the more detailed structure of the same model is shown in Figure 11C for the chain C which has the most loop structure. Particularly the transmembrane domain can be matched better with the template structure. Ramachandran graphic values were calculated for the model which does not has loops with using the PROCHECK(Laskowski et al., 1993). The percentage of angle in the allowed regions of this model has increased to 90% (see Figure 11B).This model, which is more successful in terms of geometric and secondary structures, was transferred into a different loop program The loop structures in each chain were completed by creating 100 models for each of them by using Rosetta and choosing the best ones (Aktolun, unpublished) Rosetta (Rohl et al., 2004; Stein and Kortemme, 2013) is a specialized ab-initio loop modeling program.
36
Figure 34:A)Loop structure modeled as tetramer B)
Ramachandran plot of Model C) structural alignment of chain C and template
A C
Figure 11: A) Loop structure cut out and modeled as tetramer. NR1 (pink) modeled from A chain, NR2A (light blue) modeled from B chain, NR1 (orange) modeled from C chain, NR2A modeled from D chain (green). B) Ramachandran plot of Model
C) Structural alignment of chain C modeled as tetramer (NR1 structure (orange)) and chain C from template structure (light blue) B
37 3.3. Elastic Network Model analysis
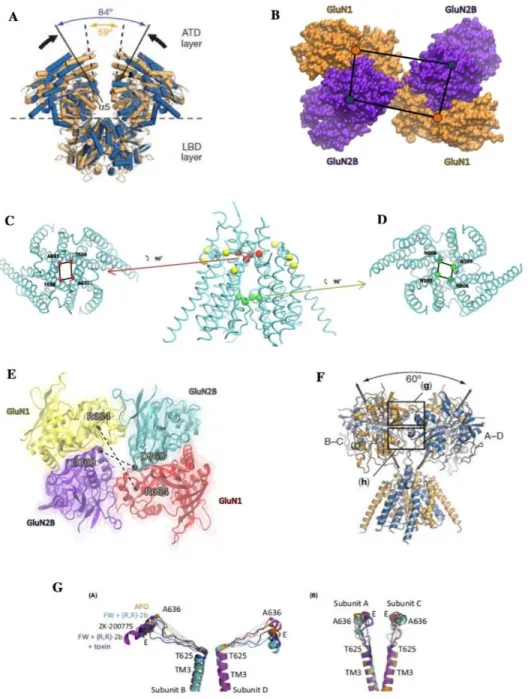
First 20 modes of the NMDAR were examined.The graphs given in Figure 13 are about examining the structurally parameters which are shown to be important on the mechanism of protein gating mechanism (Karakas and Furukawa, 2014; Lee et al., 2014). Namely 8 parameters are obtained from previous studies for the examination of the movement of the receptor. These parameters can be imagined as something similar to the reaction coordinates used in free energy calculations. Namely the change in these structural features can be directly used to monitor the structural changes of the protein linked to its activation. These parameters can be summarized as the following: (See Figure 12)
1. ATD Separation Angle: This is the point at which the Amino Terminal Domain point is linked to the CYS linkage in the Nature article. Calculated from the angle between the Alpha5 helices.
2. Distance between ATD subunits
3. TMD Girdle: The first narrowest region of the channel to the ion flow
4. TMD Bottom Girdle: This is the second narrowest region that this channel has encountered after the door (TMD Girdle).
5. Distance between LBD subunits
6. LBD Separation Angle: It is calculated as the angle between the different the 2-fold axes passing through the A-D subunits and B-C subunits, such as the same ATD separation angle.
7. TMD-M3 linker: This parameter is the linkage between the LBD part and the channel. The binding of the ligand molecule is essential in terms of how it is transmitted to the ion channel.
8. K216C Mutation Region: This mutation has played a role in the transmission of the ATD part and receptor to the desensitized position.(Karakas and Furukawa, 2014; Lee et al., 2014)
38
Figure 35: Visualization of 8 parameters.
.
Figure 12: A) GluN1-GluN2A amino terminal (ATD) and ligand binding (LBD) regions. In the absence of the K216C cross-linking mutation, the openings between the alpha 5 helices of the GluN2B subunits indicate the motility of the ATD. B) The distances between the center of masses of ATD regions. GluN1 (orange) and GluN2A (blue) are shown as a surface. The blue dots show the center of mass of GluN2A and the orange dots show the center of GluN1. (C-D) The distances calculated in the transmembrane part (TMD) are shown. The red spheres indicate the girdle on the top of the TMD, and the green spheres indicate the girdle on the bottom. The yellow spheres show residues with CYS cross-linking mutations added to the 4TLM structure. Residues with mutations; T559 and F800 in chains A and C, D550 and I798 in chains B and D, respectively. C) The view of the TMD Girdle is from above. The residues T638 and A631 are on A, C and B, D, respectively. D) The view from below of TMD Bottom Girdle. N606 and N599 residues are on subunits A, C and B, respectively. E) Distances of opposes LBDs. The constructs are shown as cartoon and from the top of the receptor. The distance between alpha carbon (black spheres) of the residues of ASP769 in GluN1 and ARG684 in GluN2B was calculated. The A, B, C and D chains are shown as yellow, blue, red and purple respectively. F) Separation angles of B-C and A-D heterodimers in the GluN1-GluN2B LBD fragment are shown. The box in where the LBD dimer-dimer interaction is present are shown. G) Distances between TMD M3 helix and LBD E helix. The B-D subunits on the left show distances for the A-C subunits on the right. Distances were calculated between V646-I657 for GluN1 and I638-L649 for GluN2B.
39 Figure 13: 8 parameters of first 5 modes.
40 Figure 14: 8 parameters of second 5 modes (6 to 10).
41 Figure 15: 8 parameters of third 5 modes (11 to 15).
42 Figure 16: 8 parameters of last 5 modes (16 to 20).