IN SILICO DESIGN AND MODELING OF
PEPTIDOMIMETIC DRUG CANDIDATES FOR
METHIONINE AMINOPEPTIDASE 2 ENZYME FOR
PREVENTION OF CANCER
S¸AFAK NAZ S¸ENT ¨URK
MASTER’S THESIS
Submitted to the School of Graduate Studies of
Kadir Has University in partial fulfillment of the requirements for the degree of Master of Science in the program of Computational Biology and Bioinformatics
TABLE OF CONTENTS
ABSTRACT . . . i ¨ OZET . . . ii ACKNOWLEDGEMENTS . . . iii DEDICATION . . . iv LIST OF TABLES . . . v LIST OF FIGURES . . . vi LIST OF SYMBOLS/ABBREVIATIONS . . . x 1. INTRODUCTION . . . 1 1.1 Cancer . . . 2 1.1.1 Reasons of Cancer . . . 51.1.2 Types of Cancer and their Incidence . . . 9
1.2 Methionine Aminopeptidase 2 . . . 11
1.2.1 Methionine Aminopeptidase 2 Enzyme Structure . . . 13
1.2.2 Methionine Aminopeptidase 2 Enzyme Binding Cavity . . . . 14
1.2.3 Methionine Aminopeptidase 2 Enzyme Divalent Center . . . . 15
1.2.4 Methionine Aminopeptidase 2 Enzyme Clinical Importance . 15 1.2.5 Biological Function of Methionine Aminopeptidase 2 Enzyme 15 1.3 Natural Products as Source of Lead Compound . . . 17
1.3.1 Stages of Modern Rational Drug Discovery and Development . 17 1.3.2 In Silico Approaches Used in Drug Design . . . 19
1.3.3 Molecular Docking in Drug Design . . . 21
1.3.4 AutoDock - A Tool for Molecular Docking in Drug Design . . 24
1.4 Peptidomimetics . . . 25
2. MATERIAL AND METHOD . . . 27
2.1 Preparation of Ligands for Docking . . . 27 2.2 Preparation of the MetAP 2 Enzyme Structure for Docking 29 2.3 Docking Study of Peptidomimetic Ligands with MetAP 2
3. RESULTS . . . 37
3.1 Docking Results . . . 37
3.2 The 2D and 3D Diagrams of Peptidomimetic Inhibitors . 56 3.3 ADMET Descriptors of Inhibitors . . . 76
4. CONCLUSIONS . . . 77
REFERENCES . . . 78
IN SILICO DESIGN AND MODELING OF PEPTIDOMIMETIC DRUG CANDIDATES FOR METHIONINE AMINOPEPTIDASE 2 ENZYME FOR
PREVENTION OF CANCER
ABSTRACT
Several disorders come together to form cancer. Cancer cells divide without a control. The cell proliferation in cancer is abnormal. More than 200 types of cancer have been diagnosed over the years. There are various factors that can cause cancer. These factors are heredity, diet, hormones, smoking, alcohol, viruses, bacteria, radiation and some chemicals. 17 million new cancer cases and 9.5 million cancer deaths were observed in 2018. Methionine Aminopeptidase 2 (MetAP 2) is a cobalt-containing metalloprotease located in cytosol of the cell. It cleaves methionine from amino terminus of a newly synthesized protein. MetAP 2 is a target for discovering new peptidomimetic inhibitors for angiogenesis used as an effective treatment for cancer. Peptidomimetics are designed to mimic peptide function and structure. They show high bioavailability and less side effects than peptides. Here, in this study we designed several peptidomimetic inhibitors using Discovery Studio. We used molecular docking to find best-fit modes between inhibitors and the target, MetAP 2. Lastly, 10 possible peptidomimetic inhibitors were obtained by further analysis such as Gibbs Free Energy and ADMET properties. These peptidomimetic inhibitors will serve as a promising drug candidates for MetAP 2 enzyme in drug design and development in the near future.
Keywords: Cancer, Methionine Aminopeptidase 2, Drug Design, Discovery Studio, Peptidomimetics, Molecular Docking, Gibbs Free Energy, ADMET Properties
KANSER˙I ENGELLEMEK ˙IC¸ ˙IN B˙ILG˙ISAYAR ORTAMINDA D˙IZAYN VE MODELLEME KULLANARAK MET˙IYON˙IN AM˙INOPEPT˙IDAZ 2 ENZ˙IM˙INE
UYGUN PEPT˙IDOM˙IMET˙IK ˙ILAC¸ ADAYLARI GEL˙IS¸T˙IRME
¨
OZET
Bir¸cok hastalık bir araya gelerek kanseri olu¸sturur. Kanser h¨ucreleri kontrols¨uz bir ¸sekilde b¨ol¨un¨ur. Kanserde h¨ucre ¸co˘galması anormaldir. Yıllar i¸cinde 200’den fazla kanser ¸ce¸sidi te¸shis edilmi¸stir. Bazı fakt¨orler kansere neden olabilir. Kalıtım, beslenme, hormonlar, sigara i¸cme, alkol t¨uketimi, radyasyon, bazı kimyasallar, vir¨usler ve bakteriler bu fakt¨orlerden birka¸cıdır. 2018 yılında 17 milyon yeni kanser vakası ve 9.5 milyon kanser nedenli ¨ol¨um g¨ozlenmi¸stir. Metiyonin aminopeptidaz (MetAP 2) kobalt i¸ceren ve h¨ucrenin sitozol¨unde bulunan bir metalloproteazdır. Bu enzim yeni sentezlenmi¸s proteinin amino kısmında bulunan metiyonin amino asidini proteinden ayırır. Ayrıca kanser tedavisinde anjiyojenezi ¨onlemek i¸cin yeni peptidomimetik inhibit¨orler ke¸sfedilmesinde bu enzim kullanılır. Peptidomimetikler peptitlerin i¸slev ve yapısını taklit etmek i¸cin dizayn edilir. Peptitlere g¨ore peptidomimetikler daha y¨uksek biyoyararlılık ve daha az yan etki g¨osterir. Bu ¸calı¸smada, Discovery Studio adlı program kullanılarak peptidomimetik inhibit¨orler dizayn edilmi¸stir. Daha sonra hedef resept¨or (MetAP 2) ve inhibit¨orler birbirlerine ba˘glanarak en iyi ba˘glanma modları bulunmu¸stur. Son olarak Gibbs serbest enerjisi ve ADMET ¨ozelliklerine bakılarak en iyi 10 peptidomimetik inhibit¨or se¸cilmi¸stir. MetAP 2 enzimine kar¸sı dizayn edilen bu peptidomimetik inhibit¨orler yakın gelecekte ila¸c dizaynında umut verici i¸sler ba¸saracaktır.
Anahtar S¨ozc¨ukler: Kanser, Metiyonin Aminopeptidaz 2, ˙Ila¸c Dizaynı, Peptidomimetikler, Molek¨uler Yerle¸stirme, Gibbs Serbest Enerjisi, ADMET ¨Ozellikleri
ACKNOWLEDGEMENTS
First and foremost, I would like to express my special thanks of gratitude to my academic advisor - Prof. Dr. Kemal YELEKC¸ ˙I. I am really grateful for his support. Working with him is such a privilege.
Besides my advisor, I would like to thank my thesis committee: Asst. Prof. Dr. S¸ebnem ES¸S˙IZ G ¨OKHAN and Asst. Prof. Dr. Vildan EN˙ISO ˘GLU ATALAY for their guidance and constructive feedbacks.
My deepest thanks also goes to Asst. Prof. Dr. Demet AKTEN AKDO ˘GAN and Asst. Prof. Dr. Hatice Bahar S¸AH˙IN for sharing their expertise and their time.
I thank my fellow colleagues for working hard together.
Last but not the least, I sincerely thank to my parents and my brother for their love, moral support and encouragement. I love you all so much.
LIST OF TABLES
Table 1.1 The Most Common Cancer Types Worldwide in 2018 (World
Cancer Research Fund, 2018) . . . 10
Table 1.2 Several Docking Programs and their Search Algorithms (Moitessier et al., 2008) . . . 22
Table 1.3 Several Scoring Functions and their Classes (Moitessier et al., 2008) . . . 22
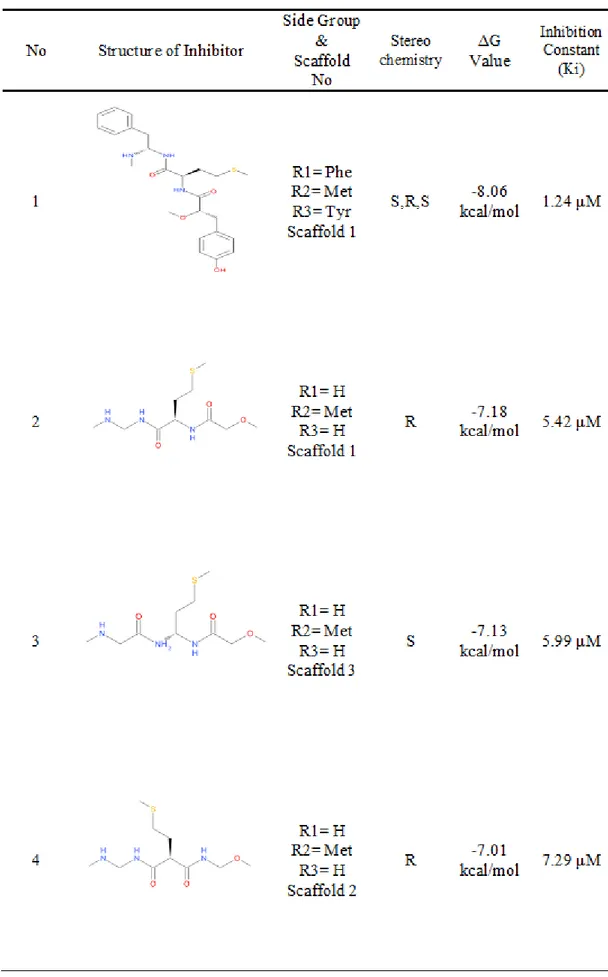
Table 3.1 Evaluation of 70 Peptidomimetic Ligand Inhibitors according to their Free Energy of Binding, Inhibition Constant (Ki), Side Groups and Stereochemistry for MetAP 2 . . . 38
Table 3.2 Continuation of Table 3.1 . . . 39
Table 3.3 Continuation of Table 3.1 . . . 40
Table 3.4 Continuation of Table 3.1 . . . 41
Table 3.5 Continuation of Table 3.1 . . . 42
Table 3.6 Continuation of Table 3.1 . . . 43
Table 3.7 Continuation of Table 3.1 . . . 44
Table 3.8 Continuation of Table 3.1 . . . 45
Table 3.9 Continuation of Table 3.1 . . . 46
Table 3.10 Continuation of Table 3.1 . . . 47
Table 3.11 Continuation of Table 3.1 . . . 48
Table 3.12 Continuation of Table 3.1 . . . 49
Table 3.13 Continuation of Table 3.1 . . . 50
Table 3.14 Continuation of Table 3.1 . . . 51
Table 3.15 Continuation of Table 3.1 . . . 52
Table 3.16 Continuation of Table 3.1 . . . 53
Table 3.17 Continuation of Table 3.1 . . . 54
LIST OF FIGURES
Figure 1.1 The Cell Cycle (Alberts et al., 2013) . . . 1
Figure 1.2 Mechanisms of Cancer Spread: Invasion and Metastasis (Soda, 2011) . . . 3
Figure 1.3 The six Characteristics of the Cancer (Hanahan and Weinberg, 2000) . . . 3
Figure 1.4 Skin Types and their UV Sensitivity (Greinert et al., 2015) . . . 8
Figure 1.5 General Structure of an Amino Acid (Nelson and Cox, 2000) . . 11
Figure 1.6 Structure of Methionine (Nelson and Cox, 2000) . . . 11
Figure 1.7 MetAP Enzyme Primary Structures in Different Organisms (Vetro and Dummit, 2004) . . . 14
Figure 1.8 The Biological Role of MetAP 2 and NMT (Chauhan et al., 2018) 16 Figure 1.9 The Stages in Drug Design (Alvarez and Scoichet, 2005) . . . 19
Figure 1.10 A Schematic for in Silico Drug Design (Ekins and Mestres, 2007) 21 Figure 1.11 Drug Discovery Process with Molecular Docking (Kumar, 2013) 24 Figure 1.12 Peptidomimetics as Therapeutics (Cunningham and Qvit, 2017) 26 Figure 2.1 Peptidomimetic Scaffold 1 . . . 27
Figure 2.2 Peptidomimetic Scaffold 2 . . . 28
Figure 2.3 Peptidomimetic Scaffold 3 . . . 28
Figure 2.4 Peptidomimetic Scaffold 4 . . . 28
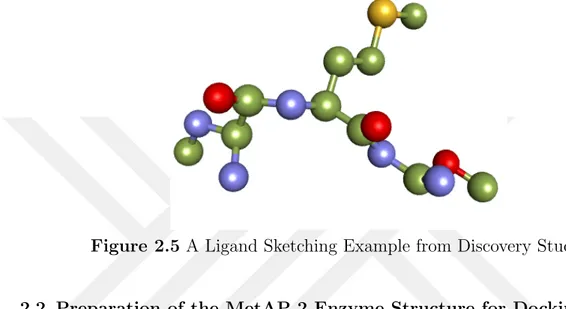
Figure 2.5 A Ligand Sketching Example from Discovery Studio . . . 29
Figure 2.6 3D Structure of MetAP 2 . . . 30
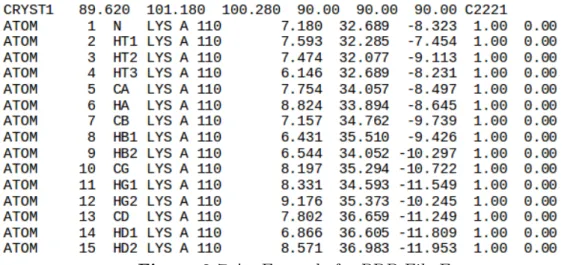
Figure 2.7 An Example for PDB File Format . . . 30
Figure 2.8 The Tool of the AutoDock . . . 31
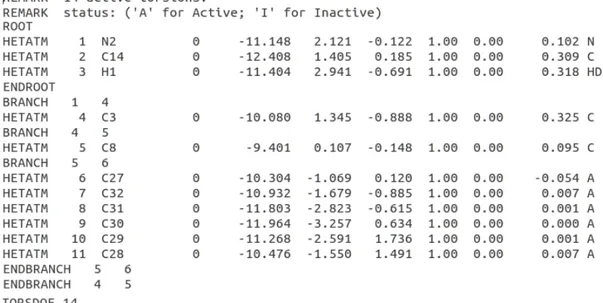
Figure 2.9 An Example for PDBQT File Format . . . 31
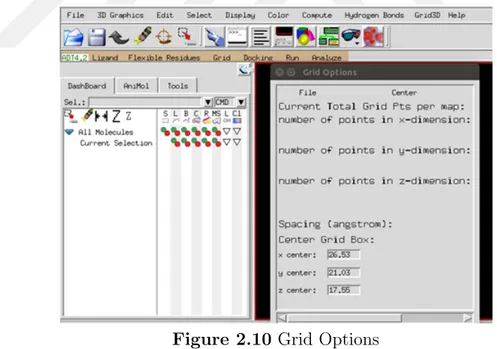
Figure 2.10 Grid Options . . . 32
Figure 2.11 An Example for *.glg File . . . 35
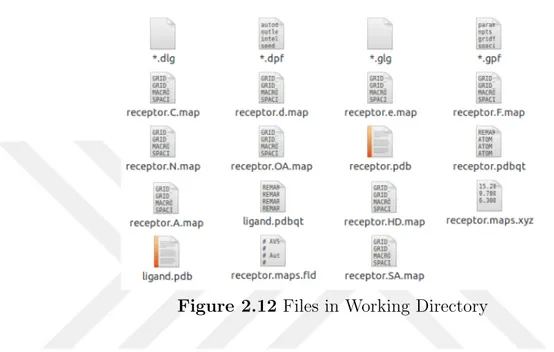
Figure 2.12 Files in Working Directory . . . 36
Figure 3.1 The 3-dimensional orientation of Inhibitor 8 in the active site of the MetAP 2 Enzyme. Amino acid residues are shown as scalled balls and sticks. Amino acid residues are labeled by Discovery Studio. The inhibitor is shown as a stick and the enzyme is shown as a solid ribbon. . . 56 Figure 3.2 2D Diagram showing various interactions between the Receptor
and Inhibitor 8 as depicted in different colors . . . 57 Figure 3.3 The 3-dimensional orientation of Inhibitor 9 in the active site of
the MetAP 2 Enzyme. Amino acid residues are shown as scalled balls and sticks. Amino acid residues are labeled by Discovery Studio. The inhibitor is shown as a stick and the enzyme is shown as a solid ribbon. . . 58 Figure 3.4 2D Diagram showing various interactions between the Receptor
and Inhibitor 9 as depicted in different colors . . . 59 Figure 3.5 The 3-dimensional orientation of Inhibitor 10 in the active site of
the MetAP 2 Enzyme. Amino acid residues are shown as scalled balls and sticks. Amino acid residues are labeled by Discovery Studio. The inhibitor is shown as a stick and the enzyme is shown as a solid ribbon. . . 60 Figure 3.6 2D Diagram showing various interactions between the Receptor
and Inhibitor 10 as depicted in different colors . . . 61 Figure 3.7 The 3-dimensional orientation of Inhibitor 12 in the active site of
the MetAP 2 Enzyme. Amino acid residues are shown as scalled balls and sticks. Amino acid residues are labeled by Discovery Studio. The inhibitor is shown as a stick and the enzyme is shown as a solid ribbon. . . 62 Figure 3.8 2D Diagram showing various interactions between the Receptor
Figure 3.9 The 3-dimensional orientation of Inhibitor 30 in the active site of the MetAP 2 Enzyme. Amino acid residues are shown as scalled balls and sticks. Amino acid residues are labeled by Discovery Studio. The inhibitor is shown as a stick and the enzyme is shown as a solid ribbon. . . 64 Figure 3.10 2D Diagram showing various interactions between the Receptor
and Inhibitor 30 as depicted in different colors . . . 65 Figure 3.11 The 3-dimensional orientation of Inhibitor 31 in the active site of
the MetAP 2 Enzyme. Amino acid residues are shown as scalled balls and sticks. Amino acid residues are labeled by Discovery Studio. The inhibitor is shown as a stick and the enzyme is shown as a solid ribbon. . . 66 Figure 3.12 2D Diagram showing various interactions between the Receptor
and Inhibitor 31 as depicted in different colors . . . 67 Figure 3.13 The 3-dimensional orientation of Inhibitor 32 in the active site of
the MetAP 2 Enzyme. Amino acid residues are shown as scalled balls and sticks. Amino acid residues are labeled by Discovery Studio. The inhibitor is shown as a stick and the enzyme is shown as a solid ribbon. . . 68 Figure 3.14 2D Diagram showing various interactions between the Receptor
and Inhibitor 32 as depicted in different colors . . . 69 Figure 3.15 The 3-dimensional orientation of Inhibitor 34 in the active site of
the MetAP 2 Enzyme. Amino acid residues are shown as scalled balls and sticks. Amino acid residues are labeled by Discovery Studio. The inhibitor is shown as a stick and the enzyme is shown as a solid ribbon. . . 70 Figure 3.16 2D Diagram showing various interactions between the Receptor
Figure 3.17 The 3-dimensional orientation of Inhibitor 35 in the active site of the MetAP 2 Enzyme. Amino acid residues are shown as scalled balls and sticks. Amino acid residues are labeled by Discovery Studio. The inhibitor is shown as a stick and the enzyme is shown as a solid ribbon. . . 72 Figure 3.18 2D Diagram showing various interactions between the Receptor
and Inhibitor 35 as depicted in different colors . . . 73 Figure 3.19 The 3-dimensional orientation of Inhibitor 36 in the active site of
the MetAP 2 Enzyme. Amino acid residues are shown as scalled balls and sticks. Amino acid residues are labeled by Discovery Studio. The inhibitor is shown as a stick and the enzyme is shown as a solid ribbon. . . 74 Figure 3.20 2D Diagram showing various interactions between the Receptor
and Inhibitor 36 as depicted in different colors . . . 75 Figure 3.21 Depiction of the ADMET PSA 2D versus ADMET Alogp98
LIST OF SYMBOLS/ABBREVIATIONS
DNA DeoxyriboNucleic Acid MetAP Methionine Aminopeptidase NMR Nuclear Magnetic Resonance
QSAR Quantitative Structure Activity Relationship CoMFA Comparative Molecular Field Analysis
CoMSIA Comparative Molecular Similarity Indices Analysis PDB Protein Data Bank
2D Two Dimensional 3D Three Dimensional ALA Alanine
ARG Arginine ASN Asparagine ASP Aspartic Acid CYS Cysteine GLN Glutamine GLU Glutamic Acid GLY Glycine HIS Histidine ILE Isoleucine LEU Leucine LYS Lysine MET Methionine PHE Phenylalanine PRO Proline SER Serine THR Threonine TRP Tryptophan TYR Tyrosine VAL Valine
1.
INTRODUCTION
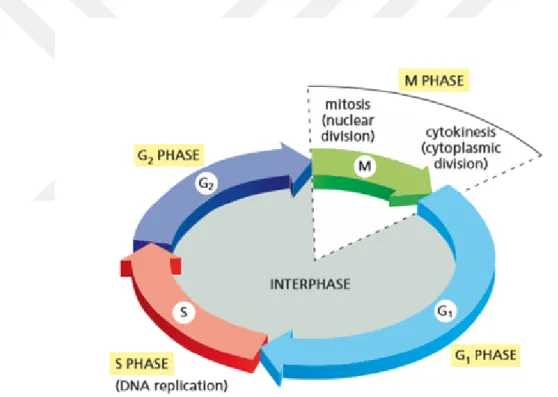
An eukaryotic cell duplicates itself into two daughter cells at proliferation. These two daughter cells share same amount of identical DNA from their progenitor. Also they are capable of reproducing new daughter cells. This means that cell production is cyclic and it is called cell cycle (Alberts et al., 2013).
Figure 1.1 The Cell Cycle (Alberts et al., 2013)
The cell cycle contains four phases as can be seen in the Figure 1.1. These four phases are G1, S, G2 and M. The cell cycle starts from G1 phase. G1 and G2 phases are named gap phases. Cell mass increases at gap phases. Replication of DNA occurs in S phase. G1, G2 and S phases come together to form interphase. Nuclear and cytoplasmic division occur in M phase. Mitosis and cytokinesis are the most important events in the cell cycle (Alberts et al., 2015).
On the cell cycle there are checkpoints. The checkpoints are specific time points during the cell cycle where the cell decides whether it goes for cell division or not. There are three checkpoints on the cell cycle. First one is G1 checkpoint and it checks up on the cycle at the end of G1 phase. Second one is G2 checkpoint and the third one is M checkpoint which makes check during metaphase of mitosis. G1 checkpoint controls if the cell growing well enough. Also if there is a significant damage on the DNA, G1 checkpoint arrest the cell cycle for repairing the DNA before its replication during S phase. G2 checkpoint ensures that whether proper replication of DNA happen at S phase. In the metaphase of mitosis the chromosomes connected to spindles start to align at the center of the cell. M checkpoint controls the misalignment of these chromosomes. Because if they do not align correctly, then the chromosomal segregation will not occur properly (Barnum and O’Connell, 2014).
1.1 Cancer
The dysfunction of checkpoints can cause cancer. More than 200 types of cancer have been diagnosed over the years. The types of cancer are named after the tissue that they have been come from. The most common cancer type is carcinomas and they arise from epithelial cells. If cancer occurs in the mesoderm cells like bone, muscle and connective tissue then it is called sarcomas. Adenocarcinomas occur in the glandular tissue like breast. Lymphomas are another cancer types that happen in lymph nodes and the last one leukemias arise from the immature blood cells that grow in bone marrow (Pecorino, 2012).
Cancer cells use invasion or metastasis for spreading in the body. In invasion cancer cells only invade into neighboring tissues. But in metastasis they move to the body’s distant sites using lymphatic and blood vessels. After this transportation, cancer cells reinvade and grow abnormal at their new location (Soda, 2011).
Figure 1.2 Mechanisms of Cancer Spread: Invasion and Metastasis (Soda, 2011)
Cancer cells divide without a control. As a result of this, they form growing mass of tissue called tumor. Depending on their spread mechanism as stated in the Figure 1.2 above -invasion or metastasis-, the tumors are identified as benign tumors or malignant tumors. Benign tumors do not use invasion or metastasis for spreading. They only grow locally. Benign tumors are called non-malignant. But malignant tumors use both invasion and metastasis for spreading throughout the body. Malignant tumors are cancerous, but benign tumors are not (Pecorino, 2012).
At 2000, Hanahan and Weinberg have specified the six important hallmarks of cancer in the Figure 1.3. The hallmarks are: sustaining proliferative signaling, evading growth suppressors, activating invasion and metastasis, enabling replicative immortality, inducing angiogenesis and resisting cell death (Hanahan and Weinberg, 2000).
1. Sustaining proliferative signaling
• Normal cells require growth factors for cell division.
• Cancer cells do not need growth factors to divide.
2. Evading growth suppressors
• Normal cells need inhibitory signals to continue homeostasis.
• Cancer cells don’t give an answer to signals that inhibit the growth.
3. Resisting cell death
• Normal cells with a significant DNA damage go to apoptosis.
• Cancer cells avoid from apoptotic signals.
4. Enabling replicative immortality
• After normal cells become senescent, they have an ability of counting the number of cell doublings.
• This autonomous counting device determines the chromosomal ends called telomeres that occurs during the DNA replication.
• The length of telomeres are preserved in cancer cells.
• The changing of telomeres’ regulation causes the limitless potential of replication.
5. Inducing angiogenesis (production of new blood vessels)
• Normal cells use blood vessels to transfer oxygen and nutrients.
• Cancer cells stimulate angiogenesis. Because new blood vessels are necessary for tumor survival and tumor spread.
• The changing balance between angiogenic inducers and inhibitors activate the angiogenic switch.
6. Activating invasion and metastasis
• Normal cells preserve their locations in the body and they do not migrate.
• The leading cause of deaths in cancer is migration of cancer cells throughout the body.
1.1.1 Reasons of Cancer
There are several factors that can cause cancer. Heredity, diet and hormones are intrinsic factors. Extrinsic factors such as smoking, alcohol, viruses, bacteria, radiation and some chemicals also lead to cancer.
A gene mutation can develop cancer. This kind of mutation makes cells cancerous and as a consequence they grow without control. Some mutated genes can pass from mother or father to their child. If a person has strong family history of cancer, it would be wise to make genetic testing. It helps to identify mutated genes passed through generations (Deelman, 1931).
The other factor is diet. Some foods are associated with specific cancer types. Consuming too much red meat can cause breast, prostate and pancreatic cancers. Also eating fatty foods like fast foods can develop colon cancer. The experiments committed on immigrants show how the diet is important to analyze cancer. For example, in Japan following a high-salt diet reduces the country’s colon cancer prevalence. But Japanese immigrants who live in United States show substantial increase at incidence of colorectal cancer due to their new diet. Therefore, immigrant communities develop high cancer risk profile of their new country through generations, due to the link between diet and cancer (Sapienza and Issa, 2016).
The last intrinsic factor is hormones. Some hormones have an important effect to develop cancer. For instance, a hormone called estrogen which plays a role in regulation of the menstrual cycle is related with developing breast and endometrial cancers. The occurence of endometrial cancer and breast cancer has increased significantly with a scale of 20-35 percent because of the women who had estrogen therapy (Shang, 2007). Another example is the incident of prostate cancer. The men from Africa have more testosterone hormone. The men from Europe have lower levels of testosterone. This means that the men from Africa have a higher risk of developing prostate cancer than European men. The men from Asia have the lowest levels of testosterone so they have the lowest levels of prostate cancer normally (Sonker et al., 2008).
Smoking is one of the environmental factor. Tobacco smoking is always related with lung cancer. Lung cancer is now the leading cause of cancer deaths worldwide. There are two breaking points in history for using tobacco. First one is the World War I in 1914 and the second one is taking the tobacco to Asian countries in the 1940s. Smoking comprises the 40 percent of cancer deaths. With this huge amount of deaths, the countries started to give educational campaigns about damages of smoking (Jung and Jeon, 2016).
Alcohols are chemical carcinogens that can cause cancer. Alcohols are made from ethanol. Contrary to common belief, ethanol in alcohol is not the carcinogen that causes cancer. During the ethanol oxidation, a metabolite called acetaldehyde is formed. The acetaldehyde in the alcohol is the carcinogen that develops cancer. Alcohol consumption causes cancer types such as liver, colon and oesophagus. Different alcoholic beverages develop different types of cancer. Absinthe increases oesophageal cancer occurrence. Beer increases 1,5-to 3,5-fold risk of colon cancer. The liver cancer is more common in Europe and North America because of high alcohol consumption ratio (P¨oschl and Seitz, 2004).
Humans are exposed to many known and unknown environmental chemicals at various stages of their life. These chemicals can cause cancer. The most known chemicals are chlorination products, cadmium, pesticides and hair dyes. The chlorination products keep swimming pools clean. But they are related with bladder cancer. Also cadmium used at the battery production can cause bladder cancer, too. An another chemical is pesticides. Pesticides are chemical compounds that are used to kill pests. Pests damage crops in agriculture. But this chemical compound is toxic to human. It can cause many cancer types such as brain, central nervous system cancer, breast, bladder, colon and prostate. Also using hair dyes increases the risk of developing brain cancer in women. Especially the black hair dye increases the risk of developing leukemia (Clapp and Jacobs, 2008).
Radiation is an electromagnetic spectrum from the sun. This ultraviolet radiation is generally associated with skin cancer. Ultraviolet radiation targets the DNA. The DNA damage on skin cells can cause skin cancer. Tanning is the defence of skin to ultraviolet damage. Different skin types show different risk levels of skin cancer (Greinert et al., 2015).
Figure 1.4 Skin Types and their UV Sensitivity (Greinert et al., 2015)
As shown in the Figure 1.4 an individual with very fair, pale white skin is the most sensitive to ultraviolet radiation. Also he/she has the greatest risk of skin cancer. A person with moderate brown skin type has the risk of skin cancer but it is less often than type I. Lastly, an individual with deeply pigmented dark brown skin type has rare risk of skin cancer (Greinert et al., 2015).
The last reason of cancer is viruses and bacteria. Certain bacterial and viral infections increase the risk of cancer. For example, a bacteria called Helicobacter pylori cause cervical cancer. Also hepatitis B, hepatitis C and human papillomaviruse (HPV) are oncoviruses that cause cancer types such as liver and stomach cancers (Vineis and Wild, 2014).
1.1.2 Types of Cancer and their Incidence
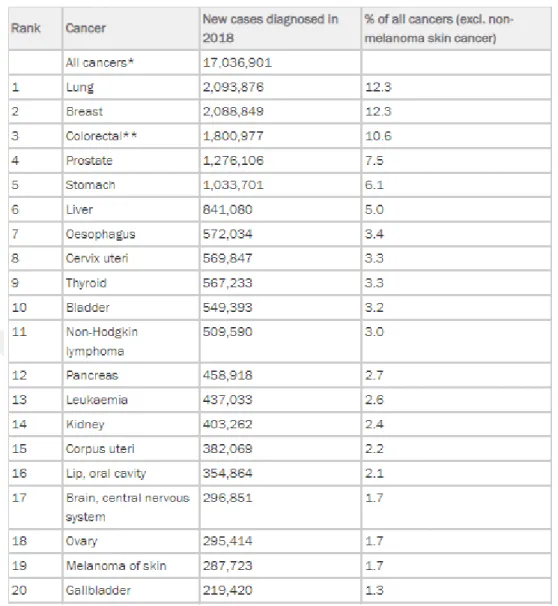
There are more than 200 cancer types worldwide. But the first five most common cancer types are lung, breast, colon, prostate and stomach as is seen in the Table 1.1. The scientists estimate that at the end of 2018, there would be 17 million new cancer cases and 9,5 million cancer deaths (Bray et al., 2018).
Lung cancer is the most common cancer type. It occurs in lungs which are a part of the respiratory system. Smoking tobacco is the main reason of lung cancer. Also arsenic in drinking water increases the risk of lung cancer. Three-quarters of whole lung cancer incidents occur in men. 2,093,876 new cases diagnosed in both sexes in 2018. Therefore lung cancer makes 12.3 percent of the total number of new cases diagnosed in 2018 (World Cancer Research Fund, 2007).
Breast cancer also makes 12.3 percent of the total number of new cases diagnosed in 2018. It is the most common cancer type in women. 2,088,849 new cases diagnosed in 2018. The risk factors of breast cancer are different at pre-menopause and post-menopause. At pre-menopause the risk factors are drinking alcohol, greater birth weight and adult attained height. At post-menopause drinking alcohol, body fatness and adult attained height increase the risk of breast cancer. The breast cancer commonly is diagnosed at post-menopause stage.
Colon cancer is the third common cancer type with 1,8 million new cases in 2018. With this amount colon cancer makes 10.6 percent of the total number of cancer occurence. The colon cancer rates increase with industrialisation. It is more common in men than in women. Consuming red meat and processed meat, drinking alcohol, body fatness increase the risk of colon cancer.
Prostate cancer is the fourth common cancer type overall but it is the second common in men. 1,276,106 new cases diagnosed in 2018. The incidence of prostate cancer is 7,5 percent of all cancers. Diets with high calcium can increase the risk of prostate cancer.
Table 1.1 The Most Common Cancer Types Worldwide in 2018 (World Cancer Research Fund, 2018)
The fifth one is stomach cancer. Stomach is a part of the digestive system. 1,033,701 new cases diagnosed in 2018. The incidence of stomach cancer is 6,1 percent of all cancer occurrence. Two out three cases occur in men. Diets with salt and salty foods can increase the risk of stomach cancer.
The other cancer types are liver, oesophagus, cervix uteri, thyroid, bladder, non-hodgkin lymphoma, pancreas, leukaemia, kidney, corpus uteri, lip, oral cavity, brain, central nervous system, ovary, melanoma of skin, gallbladder. The incidences of these cancers can be seen on the Figure 1.5 (World Cancer Research Fund, 2018).
1.2 Methionine Aminopeptidase 2
Proteins are organic macromolecules that contain carbon, oxygen, hydrogen and nitrogen elements. They are sorted as structural, storage, transport, hormonal, receptor, contractile, enzymatic and defensive proteins depending upon their roles in the body. Amino acids are monomers of proteins. Amino acids are connected by peptide bonds to form proteins. An amino acid contains a carboxylic group (COOH), an amino group (NH2), an alpha carbon (C), a hydrogen atom (H) and R group which differ in every amino acid as shown in the Figure 1.5 (Nelson and Cox, 2000).
Figure 1.5 General Structure of an Amino Acid (Nelson and Cox, 2000)
There are 20 essential amino acids and they are classified by their R groups. Methionine is one of the essential-alpha amino acid and its structure is in the Figure 1.6. It contains a carboxylic group, an amino group and a hydrogen atom. Besides that it has S-methyl thioether (CH3S) side chain which makes methionine nonpolar, aliphatic amino acid. The methyl group and sulfur are important for its structural and metabolic function (Guedes et al., 2010).
Methionine has three important roles at protein structure and function. First one is hydrophobicity. Methionine becomes hydrophobic because of the terminal methyl group at the side chain. At globular protein folding, methionine residues are buried in the interior of a protein due to the hydrophobicity. The second one is the oxidation of sulfur. The oxidation of sulfur is essential for protein repairing. Thus it is associated with age-related diseases like neurodegeneration. Last and the most important function of methionine is the initiation of protein synthesis. Methionine (iMet) which is coded by the codon AUG is the first amino acid produced in a nascent polypeptide during mRNA translation in eukaryotes. In prokaryotes (e.g. Escherichia coli ) formylmethionine (fMet) is the first amino acid. (Brosnan et al., 2007). Newly synthesized protein has methionine at its amino terminus. This methionine must be removed before protein is transported to its new location. The N-terminal methionine excision (NME) is essential for protein activity, protein stability and protein half-life. Also it is important for amino terminal modifications such as acetylation by N-alpha-acetyltransferase and myristoylation of glycine by N-myristoyltransferase (Selvakumar et al., 2009).
The N-terminal methionine excision is performed by the enzyme called methionine aminopeptidase. Methionine aminopeptidase or MetAP is a metalloprotease in the cytosol of the cell. Apart from the methionine cleavage activity, it plays a role in cellular growth and cellular viability (Ma et al., 2011).
MetAP has two sub-types. These sub-types are Methionine Aminopeptidase 1 (MetAP 1) and Methionine Aminopeptidase 2 (MetAP 2). They are both found in prokaryotes and eukaryotes. The bacteria and archaea have only one MetAP (type 1 or type 2). In eukaryotes the MetAP 1 is originated from eubacterial enzyme and MetAP 2 is originated from archaeal enzyme (Yuan et al., 2011).
Methionine aminopeptidase 2 enzyme needs cobalt or manganese ions to become active. MetAP 2 enzyme is encoded by MetAP 2 gene. The increased expression of this gene is associated with various forms of cancer. Therefore, using MetAP 2
as a target for finding new peptidomimetic inhibitors could be used as an effective treatment for cancer.
1.2.1 Methionine Aminopeptidase 2 Enzyme Structure
The genes that encode MetAP enzymes differ in each living organism. For instance, a gene with 264 codons in Escherichia coli encodes a monomeric MetAP 2 enzyme which has a 29-kDa molecular weight. In Homo sapiens, MetAP 1 gene encodes 42-kDa MetAP 1 enzyme and MetAP 2 gene encodes 67-42-kDa MetAP 2 enzyme (Arfin et al., 1995).
Prokaryotes have only one MetAP gene so elimination of this gene is fatal. Yeasts have both MetAP 1 and MetAP 2 genes but removal of these genes is also lethal. The knock-out of these genes decreases the growth rates in yeasts. That’s why both MetAP genes are important for yeast proliferation and function. Archaea have only MetAP 2 gene. Archaeal MetAP 2 enzyme encoded by archaeal MetAP 2 gene is homologous to eukaryotic MetAP 2 enzyme and bacterial enzyme is homologous to eukaryotic MetAP 1 enzyme (Li and Chang, 1995) (Shimizu et al., 2016).
In eukaryotes, there are more than one gene that encode MetAP 1 and MetAP 2 enzymes. In the Figure 1.7 eukaryotic MetAP enzymes show an elongation at their N-terminal. This region involves either a zinc finger domain in MetAP 1 or regions of charged residues like poly acidic and poly basic structures in MetAP 2 (Vetro and Dummit, 2004).
Both prokaryotes and eukaryotes have a preserved C-terminal catalytic domain. In this catalytic domain there are five amino acids. In Escherichia coli these conserved amino acids are ASP97, ASP108, HIS171, GLU204 and GLU235. Eubacterial MetAP 1, archaebacterial MetAP 2 and human MetAP 2 enzymes share similar structures but they have little sequence homology. The main difference between MetAP 1 and MetAP 2 structure is MetAP 1 has 60 residues addition into its C-terminal catalytic domain.
Figure 1.7 MetAP Enzyme Primary Structures in Different Organisms (Vetro and Dummit, 2004)
The other difference between MetAP 1 and MetAP 2 is MetAP 2 contains a single Cys228-Cys448 disulfide bond. It controls the substrate specificity and catalytic efficiency. This disulfide bond is in the active site of the enzyme. This allosteric disulfide bond regulates the MetAP 2 enzyme activity via chemical modifications (Chiu and Wong, 2014).
Lastly, MetAP 2 expression is more regulated than MetAP 1. MetAP 2 expression occur in highly proliferating cells like endothelium. Also it is suggested that MetAP 2 promotes methionine aminopeptidase activity more than MetAP 1 (Priest, 2009).
1.2.2 Methionine Aminopeptidase 2 Enzyme Binding Cavity
The active site of the MetAP 2 enzyme has preserved. The active site of MetAP 2 enzyme has structural motif characteristic resembling to several metalloproteases like hemerythrin, ribonucleotide reductase, leucine aminopeptidase, urease, arginase (Joharapurkar and Dhanesha, 2014).
1.2.3 Methionine Aminopeptidase 2 Enzyme Divalent Center
MetAP 2 needs several cations such as Cobalt (Co2+), Manganese (Mn2+), Zinc (Zn2+) and Iron (Fe2+) to show enzyme activity. But it only needs Zn+2 or Co2+ to become crystalized. Amongst these cations MetAP 2 is in need of two metal ions to become active. The one metal ion is required for enzymatic activity and the other metal ion has positive or negative enzymatic activity. Other studies suggest that Escherichia coli need Fe+2 metal ion for enzyme acitivity, too (D’souza and Holz, 1999).
1.2.4 Methionine Aminopeptidase 2 Enzyme Clinical Importance
MetAP 2 enzyme takes an active role in angiogenesis. Ovalicin and fumagillin are first inhibitors for MetAP 2 enzyme. When ovalicin or fumagillin covalently bind to the conserved histidine residue in the binding cavity of the MetAP 2, the enzyme becomes inactive so angiogenesis is inhibited. Apart from ovalicin and fumagillin; TNP-470 also known as fumagillol (AGM-1470), caplostatin, beloranib demonstrate anti-cancer activities in the cells. The inhibition of MetAP 2 leads to cell proliferation arrest at G1 phase, whereas inhibition of MetAP 1 acitivity conduce to arrest at G2/M phase in the cell cycle (Griffith et al., 1997).
1.2.5 Biological Function of Methionine Aminopeptidase 2 Enzyme
MetAP 2 is a bifunctional enzyme. Catalyzing the cleavage of methionine from the amino-terminus of newly synthesized protein is the major function of MetAP 2 which is crucial for further amino terminal modification such as protein myristoylation shown in the Figure 1.8. After the MetAP 2 removes methionine from the target protein, a myristoyl group is added to the exposed N-terminal glycine residue. This process is performed by the enzyme called N-Myristoyl transferase (NMT). It is liable for the covalent attachment of a 14C myristic fatty acid to the N-terminus of target proteins (Chauhan et al., 2018) (Kass et al., 2007).
Figure 1.8 The Biological Role of MetAP 2 and NMT (Chauhan et al., 2018)
In addition to its removal methionine activity and protein myristoylation, MetAP 2 enzyme regulates protein synthesis by affecting the phosphorylation state of eukaryotic initiation factor 2 alpha which promotes the binding of initiator tRNA to 40S ribosomal subunits (Kumar and Tiwari, 2017).
The last function of MetAP 2 enzyme in biological process is it plays an important role in the growth of different types of tumors via inducing angiogenesis which takes tumors from benign state to malignant state. Thus, inhibiton of angiogenesis can be used as an effective treatment for cancer. MetAP 2 is a promising target for identifying novel inhibitors of angiogenesis for the development of new anti-cancer drugs (Frottin et al., 2016) (Bainbridge et al., 2007).
1.3 Natural Products as Source of Lead Compound
Drugs generally are not discovered directly. First a lead compound is identified. Lead is a compound that shows both favourable (high pharmacological and pharmacokinetic properties) and unfavourable (high toxicity and poor solubility) characteristics. Natural products have higher cell permeability and pharmacokinetic features. They are used as source of lead compound in drug development such as anti-cancer drugs. In some cases their structure is modified to increase the pharmacological features. For instance, carbon six side chain position in fumagillin is altered for showing better pharmacological properties. Fumagillin is a natural product that inhibits MetAP 2 enzyme (Morgen et al., 2016) (Silverman and Holladay, 2014).
1.3.1 Stages of Modern Rational Drug Discovery and Development
Drugs are essential for prevention and treatment of diseases. But drug design and drug development are both very time-consuming and costly processes. It takes 15 years and approximately 15 billion dollars to discover just one new drug molecule. Every attempt of new drug design and research do not end up with success. Spending lots of money and years of hard work would end up with success or failure. For this reason, in silico approaches are used to overcome through these hard challenges (Kumar, 2013).
As can be seen in the Figure 1.9 drug design with in silico approach contains several steps. At first step, a target is identified. Target is a molecule that plays role in signaling or metabolic pathways. After target identification, target is validated whether it shows any unexpected therapeutic effects. In silico approaches like genetic-network mapping, protein-pathway mapping and protein-protein interactions are used at target validation. Then a lead compound is discovered. Lead is a molecule that binds to defined target. Several approaches such as fragment-based design, structure-based design and virtual high-troughput
screening are used at lead identification. After lead identification, lead optimization or lead modification is performed. The lead compound’s structure is used for chemical modifications to increase binding affinity, potency, selectivity, pharmacokinetic features. ADME (Absorption, Distribution, Metabolism, Excretion) properties are then checked, once a lead compound is identified.
ADME properties are measured by Lipinski’s Rule of 5. The drug shows poor ADME (pharmacokinetic) properties; if there are more than 5-Hydrogen bond donors, if the molecular weight is over 500 Da, if LogP (octanol/water partition coefficiency = lipophilicity) is over 5, if there are more than 10-Hydrogen bond acceptors.
When the lead compound doesn’t have poor ADME properties, then the pre-clinical studies are started. Pre-clinical testing is a stage between drug discovery and clinical development. The aim of this testing is to provide information on safety and efficacy. The animal models are used in pre-clinical studies. If the results from pre-clinical studies are promising, the final stages are started. Human clinical trials are the main testing of molecule in the human volunteers before applying for regulatory approval to the drug market.
Human clinical trials have four phases. At phase 0 the therapeutic dose of drug is given to 10 to 15 healthy individuals to obtain preliminary human ADME data. The safety, side effects and dosage levels of drug are evaluated at Phase I in about 20-100 individuals. These individuals are often healthy volunteers. Phase I lasts few months to one and a half year. The drug effectiveness is evaluated at Phase II in hundred diseased individuals. It takes one to three years. The drug efficacy is evaluated at Phase III in about thousand patients. Phase III lasts two to six years. Finally, the drug can take regulatory approval for being on the drug market (Kumar, 2013).
Figure 1.9 The Stages in Drug Design (Alvarez and Scoichet, 2005)
1.3.2 In Silico Approaches Used in Drug Design
There are several different methods used at in silico drug design. These approaches are: homology modelling, virtual high-throughput screening (VHTS), quantitative structure activity relationship (QSAR), comparative molecular field analysis (CoMFA), comparative molecular similarity indices analysis (CoMSIA), 3D pharmacophore mapping and molecular docking as stated in the Figure 1.10.
Proteins with similar sequences have similar structures according to evolution. Homology modelling predicts the unknown structure of the target protein from its sequence or 3D structure of a related protein taken as template (Wadood et al., 2013)
Virtual high-throughput screening scans the wide range of database containing chemical structures of compounds. Then these compounds are evaluated based on their binding specificity to the target molecules. The aim is to find the actual binding mode in a rational period of time.
QSAR demonstrates the relationship between structure and biological activity of compounds with their descriptors. These descriptors indicate steric, hydrophobic, topologic and electronic properties of compound.
CoMFA, also known as 3D QSAR, is used to explain the relationship between structure and activity. It describes the 3D structure-activity relationship in a quantified form. Also it shows the steric and electronic values of ligands.
CoMSIA is one of the 3D QSAR methods. It is used for locating the mutual characteristics which are essential for favourable biological receptor binding. This method also shows the steric and electrostatic characteristics, hydrogen bond acceptors, hydrogen bond donor and hydrophobic fields.
A pharmacophore is the ensemble of steric and electronic characteristics that is essential to provide the optimal interactions with a target protein. 3D pharmacophore mapping is used to find a lead compound to the proper target protein.
Molecular docking is used to find the best-fit mode of the target protein to ligand. They form a stable complex together when they bind to each other. It shows molecular interactions between ligand and the target protein. Molecular docking produces several ligand conformations and orientations.
In silico approaches used in drug design play an important role to develop new drugs in biotechnology or pharmaceutical field to cure diseases like cancer.
Figure 1.10 A Schematic for in Silico Drug Design (Ekins and Mestres, 2007)
1.3.3 Molecular Docking in Drug Design
Structure-based drug design is a computational method that used to design ligands which have favourable steric and chemical features to multiple sites in the target. The structure-based drug design uses the 3D structure of the target derived through experiments such as X-ray crystallography or NMR spectroscopy. The structure-based drug design has two categories: de novo design and molecular docking. De novo design relies on knowledge of building ligands within the restraints of binding pocket by integrating small pieces in a gradual form (Knegtel and Kuntz, 1997).
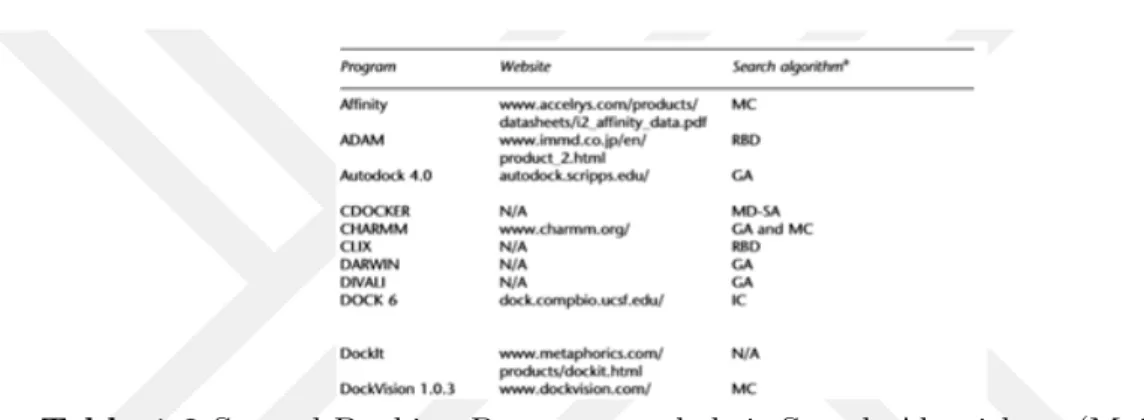
Molecular docking is one of the most popular approach used in structure-based drug design because of its capability to provide the binding conformation of ligands to binding site of the target. The goal in molecular docking is to guess the structure of ligand outrightly within the restraints of target binding site and predict the accurate binding mode. Simulations of docking contain two methods: a method to find the ligand’s or target’s conformational space and a scoring function to estimate the binding modes or poses. Accuracy for lead optimization and speed for screening large databases are substantial factors while working with docking (Moitessier et al., 2008). In the Table 1.2 several docking programs and their search algorithms are shown.
Table 1.2 Several Docking Programs and their Search Algorithms (Moitessier et al., 2008)
Nowadays, there are more than 60 docking programs and 30 scoring functions. Docking programs use different scoring (energy) functions. Scoring functions (SFs) have multiple assignments such as guessing the binding affinity of the last pose, leading the docking to find the accurate binding mode of ligand, doing an exchange between speed and accuracy. Various scoring function examples can be seen in the Table 1.3.
Scoring functions have three classes: force field (FF)-based, knowledge-based and empirical. Force field-based scoring functions produce kinetic, conformational and thermodynamic features of micromolecules and macromolecules. Also they evaluate the binding affinity and scale the effects adopted to the non-bonded interactions like van der Waals, electrostatic interactions to enhance prediction. Knowledge-based scoring functions, known as statistical potentials, observe the intermolecular interactions between specific types of atoms in greater 3D databases containing potentials of mean force. Empirical scoring functions count the number of different types of interactions between protein and ligand.
The other component that plays an effective role in docking program is search algorithms (Table 1.2). They compose a great number of molecule poses in the binding site. Search algorithms also have three classes: systematic methods, random (stochastic) methods and simulation methods. Systematic search algorithms in docking find the all degrees of freedom in a molecule. Random search algorithms analyze the conformational space by making random alterations to one or several ligands. Simulation search algorithms estimate the solutions to Newton’s equations of motion (Sousa and Fernandes, 2006).
Using molecular docking has both advantage and disadvantage. The lack of proper scoring function is the weakness of docking approach. Despite this, it is still commonly used method in drug design process due to its capability to guess the binding conformation of ligand to the target’s binding site as stated in the Figure 1.11.
Figure 1.11 Drug Discovery Process with Molecular Docking (Kumar, 2013)
1.3.4 AutoDock - A Tool for Molecular Docking in Drug Design
AutoDock is a software that evaluates the binding affinity and inhibition constant of ligand bound to the target. It is specially efficient for protein-ligand docking. It has two components: autodock and autogrid. Autodock calculates the main docking of ligand to number of grids that identify the target receptor. Autogrid calculates grid map files. Grid map files are calculated before docking. Grid map files contain energy of interactions between probe atom and protein. These files are essential for docking to be completed in a suitable period of time. AutoDock uses empirical scoring function and Lamarckian genetic search algorithm (LGA) - one of the stochastic search algorithm method (Park and Lee, 2006).
1.4 Peptidomimetics
Peptides are endogenous molecules that bind to several receptors. Endogenous peptides show anti-tumor activity. They can mimic protein surface. In addition to that, they are stabilized by chemical modifications (Cunningham and Qvit, 2017).
Using peptides in drug design have some advantages. They show high potency, high selectivity, low gathering on tissues, low toxicity than small molecules and high chemical diversity.
Although they are accessible synthetically, there are some disadvantages using peptides as therapeutics . These disadvantages are low metabolic stability in the intestines, poor absorption after oral uptake, low diffusion in certain organs, poor solubility, rapid excretion from liver and kidneys. Above all their bioavailability is very poor (Silverman and Holladay, 2014).
Because of these disadvantages peptides are altered into new compounds called peptidomimetics. Peptidomimetics can mimic or block the biological effect of peptides with interacting to their receptor or enzyme. Peptide mimics or commonly known as peptidomimetics are designed to mimic peptide function and structure (Cunningham and Qvit, 2017).
Peptidomimetics show more selectivity and efficiency than peptides. Therefore, peptidomimetics have less side effects than peptides. They have better oral bioavailability. Because of the lowered enzymatic degredation, biological activity of peptidomimetics lasts much longer. Also they come through toxicity as therapeutics shown in the Figure 1.12 and can get drug approval regulation.
Peptidomimetics have three types based on their functional and structural features. Structural Peptidomimetics (Type I) have similar local topography with the substrate. They have all the qualifications to bind an enzyme or a receptor. Functional Peptidomimetics (Type II) show similarity with the compound depended on the binding with a receptor or an enzyme. Structural-Functional Peptidomimetics (Type III) have a scaffold which is not the same as substrate structure. But they have all the effective groups required for biological interactions (Trabocchi and Guarna, 2014).
Figure 1.12 Peptidomimetics as Therapeutics (Cunningham and Qvit, 2017)
A goal for peptidomimetics is to replace as much of the peptide backbone as possible with non-peptide fragments while still conserving the amino acid side chains of peptide. This makes compound more lipophilic. Lipophilicity brings the increasing of bioavailability and pharmacokinetics profile with it.
The successful generation of peptidomimetics depends on understanding conformational, topochemical and electronic properties of lead peptide when bind to its target receptor or enzyme.
In this study, we designed four scaffolds with three different side groups. Scaffolds are sketched based upon the structure of methionine amino acid. The carboxyl group of amino acid is changed to methoxy group in scaffolds. Carbonyl groups using in scaffolds are also taken as a basis from carboxyl group. The amino group of amino acid is used at the formation of scaffolds. The main purpose of this study
2.
MATERIAL AND METHOD
At first possible ligand inhibitors were sketched for MetAP 2 enzyme. Then the grid calculations for every possible ligand were performed. Lastly, the enzyme and ligands were docked to each other for obtaining their free energy of binding and inhibition constant.
Multiple computational molecular modeling tools were used in this study. The peptidomimetic ligands were sketched with BIOVIA Discovery Studio Visualizer 2016 software. This software is used for simulating small molecules and macromolecules. The MetAP 2 enzyme’s pdb file was taken from PDB (Protein Data Bank). AutoDock 4.2 was used for molecular docking. The free energy value and inhibition constant were obtained from *.dlg files composed at the end of docking process. The possible ligands were qualified based upon their free energy value, inhibition constant and their interactions with the MetAP 2 enzyme.
2.1 Preparation of Ligands for Docking
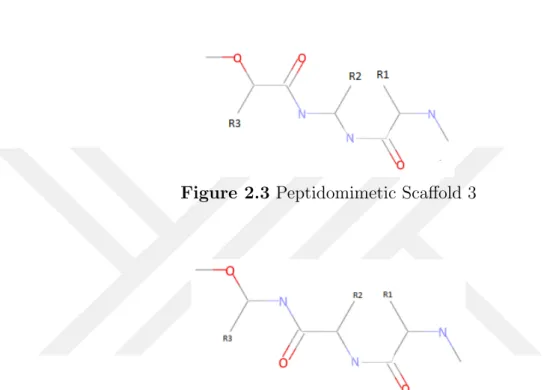
Our goal in this study is to use three different side groups on ligands while sketching four different peptidomimetic scaffolds: sketched as Figure 2.1, Figure 2.2, Figure 2.3 and Figure 2.4.
Figure 2.2 Peptidomimetic Scaffold 2
Figure 2.3 Peptidomimetic Scaffold 3
Figure 2.4 Peptidomimetic Scaffold 4
During sketch of ligands, S-methyl thioether side chain of nonpolar, aliphatic methionine amino acid was generally used at R2 side group. In certain circumstances the sulfur at CH3S was altered to oxygen. R1 and R3 side groups on scaffolds were varied with hydrogen and nonpolar, aromatic amino acids like tyrosine, tryptophan and phenylalanine.
Before docking, the ligands were minimized. A sketched ligand example can be seen in the Figure 2.5. When molecule is sketched with computational softwares, the primary geometry is not necessarily suitable to one of stable conformers. Energy minimization is performed to identify stable conformers. Because it is important to know the stable conformers of molecule due to understanding the behaviours dependent on structural assessments. It is commonly known as
geometry optimization. The Discovery Studio was used for optimization and minimization. At the Discovery Studio, under the toolbar of Structure, there is “Clean Geometry” tool which was used in this work to optimize all ligand candidates’ 3D structures. Then minimization tool of Discovery Studio was used to view results. At the end of the optimization and minimization, the files were saved at *.dsv and *.pdb formats.
Figure 2.5 A Ligand Sketching Example from Discovery Studio
2.2 Preparation of the MetAP 2 Enzyme Structure for Docking
The structure of human methionine aminopeptidase 2 complexed with Spiroepoxytriazole inhibitor (+)-31a (5CLS) was obtained from the Protein Data Bank (PDB) (Janowski and Miller, 2016). The 3D structure of MetAP 2 enzyme is shown in the Figure 2.6. At Discovery Studio software the enzyme was minimized and prepared by using protein preparation protocol and Clean Geometry tool for docking. Chain A, Hetatm and protein groups such as disulfide residues, acidic and basic residues, hydrophobic and hydrophilic residues, backbone, sidechain were preserved. Cobalt (Co2+) which is enzyme’s divalent co-factor used in energy calculation was also kept in active site of the MetAP 2 for docking. Water molecules (H2O) were removed. At pH 7.4, hydrogen atoms were attached to the receptor when it was on the protonation state. The force field was set to CHARMm and the partial charge was fixed to Momany-Rone. The dielectric constant was arranged to 10. The ionic strength was scaled to 0,145. At the end of the enzyme preparation, the file was saved at *.pdb format.
Figure 2.6 3D Structure of MetAP 2
2.3 Docking Study of Peptidomimetic Ligands with MetAP 2 Receptor
The docking method was performed after both ligands and receptor were ready. The prepared files of ligands and receptor were saved at *.pdb format. Protein Data Bank (PDB) format contains only atomic coordinates. An example for PDB file format is given in the Figure 2.7.
For molecular docking it is necessary to convert pdb files to pdbqt format via AutoDockTools which is seen in the Figure 2.8.
Figure 2.8 The Tool of the AutoDock
The pdbqt format helped us to place hydrogen bonds correctly. Also it stores the atomic coordinates, partial charges and AutoDock atom types for the receptor and ligands. In the Figure 2.9 an example for PDBQT file format is given.
The pdbqt file includes several records. These records are root, endroot, branch, endbranch, atom or Hetatm (it stands for hetero atom) and Torsdof. Root is a selected atom located closest to centre of mass of the ligand molecule. The root involves pdbqt-style atom or Hetatm records. Endroot is the last atom in root. Branches contain rotatable atom groups attached to the root. The last atom in the branch is endbranch record. The last line of the pdbqt file has Torsdof record which shows the torsional degrees of freedom number in the ligand.
The pdbqt files of ligand and receptor were used to make *.gpf files for each docking. The receptor’s pdbqt file was selected as macromolecule and then the ligand’s pdbqt file was opened from “Set Map Types” from AutoDockTools under the Grid toolbar in the Figure 2.10. In the grid box, spacing longs were set to 0.375, grid box size was kept 60 x 60 x 60. At gridcenter, the coordinates of xyz were fixed to 26.53, 21.03, 17.55 respectively. Before closing the grid box window “close saving current” was clicked in the File option. Finally *gpf. file was obtained as an output.
Figure 2.10 Grid Options
A *.gpf file contains several informations as follows:
npts 60 60 60 # num.grid points in xyz gridfld 5CLS prep.maps.fld # grid data file
receptor types A C Co H HD N NA OA SA # receptor atom types ligand types A C OA N SA HD # ligand atom types
receptor 5CLS prep.pdbqt # macromolecule
gridcenter 26.53 21.03 17.55 # xyz-coordinates or auto smooth 0.5 # store minimum energy w/in rad(A) map 5CLS prep.A.map # atom-specific affinity map map 5CLS prep.C.map # atom-specific affinity map map 5CLS prep.OA.map # atom-specific affinity map map 5CLS prep.N.map # atom-specific affinity map map 5CLS prep.SA.map # atom-specific affinity map map 5CLS prep.HD.map # atom-specific affinity map elecmap 5CLS prep.e.map # electrostatic potential map dsolvmap 5CLS prep.d.map # desolvation potential map dielectric -0.1465 # 0,AD4 distance-dep.diel;0, constant
After having *.gpf files, *.dpf files which are fundamental parameter files were prepared by again using AutoDockTools. Under the Docking option first the macromolecule was chosen, then ligand was selected. At search parameters, genetic algorithm runs were set to 10, number of generations = 27.000, number of evaluations to 25.000.000 and population size to 150. Then the Lamarckian genetic algorithm was chosen and as a result the *.dpf file was derived for each ligand.
A *.dpf file contains several informations as follows:
autodock parameter version 4.2 # used by autodock to validate parameter set outlev 1 # diagnostic output level
intelec # calculate internal electrostatics seed pid time # seeds for random generator
ligand types A C OA N SA HD # atoms types in ligand fld 5CLS prep.maps.fld # grid data file
map 5CLS prep.A.map # atom-specific affinity map map 5CLS prep.C.map # atom-specific affinity map map 5CLS prep.OA.map # atom-specific affinity map map 5CLS prep.N.map # atom-specific affinity map map 5CLS prep.SA.map # atom-specific affinity map map 5CLS prep.HD.map # atom-specific affinity map elecmap 5CLS prep.e.map # electrostatics map desolvmap 5CLS prep.d.map # desolvation map move lig1.pdbqt # small molecule
about -6.7208 1.1097 -0.1633 # small molecule center tran0 random # initial coordinates/A or random quaternion0 random # initial orientation
dihe0 random # initial dihedrals (relative) or random torsdof 14 # torsional degrees of freedom
rmstol 2.0 # cluster tolerance/A extnrg 1000.0 # external grid energy
e0max 0.0 10000 # max initial energy; max number of retries ga pop size 150 # number of individuals in population
ga num evals 25000000 # maximum number of energy evaluations ga num generations 27000 # maximum number of generations
ga elitism 1 # number of top individuals to survive to next generation ga mutation rate 0.02 # rate of gene mutation
ga crossover rate 0.8 # rate of crossover ga window size 10 #
ga cauchy alpha 0.0 # Alpha parameter of Cauchy distribution ga cauchy beta 1.0 # Beta parameter Cauchy distribution set ga # set the above parameters for GA or LGA
sw max its 300 # iterations of Solis & Wets local search sw max succ 4 # consecutive successes before changing rho sw max fail 4 # consecutive failures before changing rho sw rho 1.0 # size of local search space to sample
sw lb rho 0.01 # lower bound on rho
ls search freq 0.06 # probability of performing local search on individual set psw1 # set the above pseudo-Solis & Wets parameters
unbound model bound # state of unbound ligand ga run 10 # do this many hybrid GA-LS runs analysis # perform a ranked cluster analysis
After these steps ligand.pdbqt, receptor.pdbqt, *.gpf and *.dpf files,ligand.pdb, receptor.pdb were formed in the directory. Inside the working directory, the following unix command was typed: autogrid4 -p *.gpf -l *.glg. The Figure 2.11 is an example for *.glg file.
Figure 2.11 An Example for *.glg File
The process took few minutes. Once the program finished, the following new files showed in working directory:
receptor.maps.xyz receptor.maps.fld receptor.OA.map receptor.N.map receptor.HD.map receptor.e.map receptor.d.map receptor.C.map receptor.A.map receptor.SA.map
receptor.F.map *.glg file
These grid map files are essential for docking run. For docking the following unix command was typed: autodock4 -p *.dpf -l *.dlg
Figure 2.12 Files in Working Directory
This process took much longer, depending on ligand size. When it was completed, a *.dlg file appeared in working directory as stated in the Figure 2.12 above. The docking results were written in that single dlg file. An example for *.dlg file is given in the Figure 2.13.
3.
RESULTS
3.1 Docking Results
70 peptidomimetic ligands were obtained for MetAP 2 enzyme after molecular docking. Their structures, side groups, scaffold numbers and stereochemistry can be seen in the Table 3.1 and other continuation tables.
The best 10 possible peptidomimetic inhibitors were chosen according to their free energy of binding, inhibition constant and ADMET properties among these 70 ligands.
The best 10 possible peptidomimetic inhibitors are:
• Ligand 8 • Ligand 9 • Ligand 10 • Ligand 12 • Ligand 30 • Ligand 31 • Ligand 32 • Ligand 34 • Ligand 35 • Ligand 36
3.2 The 2D and 3D Diagrams of Peptidomimetic Inhibitors
Inhibitor 8 with R,R stereochemistry has Phe, Met and H at its side groups on scaffold 1 and it has -8.87 kcal/mol free energy and 316.11 nM inhibition constant.
Figure 3.1 The 3-dimensional orientation of Inhibitor 8 in the active site of the MetAP 2 Enzyme. Amino acid residues are shown as scalled balls and sticks. Amino acid residues are labeled by Discovery Studio. The inhibitor is shown as a
stick and the enzyme is shown as a solid ribbon.
In the Figure 3.1 there are interactions with ILE338, ALA414, HIS339, PHE219, ASP262, PRO220, HIS331, ASP251, GLU364, ASN329, LEU328, PHE366, ASN327, ALA229, SER224, ALA230, GLN457, GLY222, HIS382, TYR444 and HIS231 residues.
Figure 3.2 2D Diagram showing various interactions between the Receptor and Inhibitor 8 as depicted in different colors
In the Figure 3.2 the benzene in phenylalanine at R1 side group makes pi-alkyl bonds with HIS339 and LEU328. The sulfur in methionine at R2 side group makes pi-sulfur bond with HIS382. Also the methyl group in methionine make alkyl bonds with TYR444, HIS382 and HIS231. The carbonyl group at the scaffold make conventional hydrogen bond with HIS382. The methoxy group at the scaffold make conventional hydrogen bond with HIS231. The hydrogen atom connected to nitrogen makes conventional hydrogen bond with GLU364. The other hydrogen atom connected to same nitrogen makes carbon hydrogen bond with ASP251.
Inhibitor 9 with S,R stereochemistry has Phe, Met and H at its side groups on scaffold 3 and it has -7.82 kcal/mol free energy and Ki with 1.84 µM.
Figure 3.3 The 3-dimensional orientation of Inhibitor 9 in the active site of the MetAP 2 Enzyme. Amino acid residues are shown as scalled balls and sticks. Amino acid residues are labeled by Discovery Studio. The inhibitor is shown as a
stick and the enzyme is shown as a solid ribbon.
In the Figure 3.3 there are interactions with ILE338, HIS339, PHE219, PRO220, ASP262, HIS331, THR343, ASP251, GLY222, HIS382, TYR444, HIS231, ASN329, ALA230, LEU328, PHE366, GLU459 and GLU364 residues.
Figure 3.4 2D Diagram showing various interactions between the Receptor and Inhibitor 9 as depicted in different colors
In the Figure 3.4 the benzene in phenylalanine at R1 side group makes pi-alkyl bonds with ALA230, HIS382, PHE219 and HIS231. The sulfur in methionine at R2 side group makes pi-sulfur bond with HIS339. Also the methyl group in methionine makes alkyl bonds with TYR444 and HIS231. The carbonyl group at the scaffold make conventional hydrogen bond with ASN329. The methoxy group at the scaffold makes conventional hydrogen bond with HIS339. The hydrogen atom connected to nitrogen makes conventional hydrogen bond with GLU364. The other hydrogen atom connected to same nitrogen makes carbon hydrogen bond with GLU459.
Inhibitor 10 with R,R stereochemistry has Phe, C3H7O and H at its side groups on scaffold 1 and it has -8.22 kcal/mol free energy and 945.20 nM inhibition constant.
Figure 3.5 The 3-dimensional orientation of Inhibitor 10 in the active site of the MetAP 2 Enzyme. Amino acid residues are shown as scalled balls and sticks. Amino acid residues are labeled by Discovery Studio. The inhibitor is shown as a
stick and the enzyme is shown as a solid ribbon.
In the Figure 3.5 there are interactions with ILE338, ALA414, HIS339, PHE219, ASP262, HIS331, GLU459, GLU364, PHE366, ALA229, SER224, MET384, HIS382, TYR444, PRO220, ASP251, GLY222, HIS231, ALA230 and GLN457 residues.
Figure 3.6 2D Diagram showing various interactions between the Receptor and Inhibitor 10 as depicted in different colors
In the Figure 3.6 the benzene in phenylalanine at R1 side group makes pi-alkyl bonds with ILE338 and HIS231. The hydrogen connected to nitrogen at the scaffold makes conventional hydrogen bond with GLU364. The other hydrogen atom connected to same nitrogen makes carbon hydrogen bonds with GLU364 and ASP251. The carbonyl group located at the scaffold make conventional hydrogen bond with HIS382. Lastly, the carbon atom in the methoxy group makes carbon hydrogen bonds with ALA229, ALA230 and GLN457.
Inhibitor 12 with R,S stereochemistry has H, Met and Tyr at its side groups on scaffold 1 and it has -8.78 kcal/mol free energy and 364.65 nM inhibition constant.
Figure 3.7 The 3-dimensional orientation of Inhibitor 12 in the active site of the MetAP 2 Enzyme. Amino acid residues are shown as scalled balls and sticks. Amino acid residues are labeled by Discovery Studio. The inhibitor is shown as a
stick and the enzyme is shown as a solid ribbon.
In the Figure 3.7 there are interactions with ILE338, HIS339, ALA414, MET384, ASP262, PHE219, PRO220, ASP251, HIS331, THR343, GLU459, HIS382, GLU364, ASN329, GLN457, TYR444, HIS231, ALA230, LEU328, PHE366 and
Figure 3.8 2D Diagram showing various interactions between the Receptor and Inhibitor 12 as depicted in different colors
In the Figure 3.8 the benzene in tyrosine at R3 side group makes pi-alkyl bonds with HIS382, HIS231, ALA414, TYR444 and MET384. The hydrogen atoms connected to two nitrogens located at the scaffold make conventional hydrogen bonds with GLU364. The methyl group at the scaffold make carbon hydrogen bond with ASP262. The sulfur in methionine makes pi-sulfur bond with HIS339 and the methyl group of methionine makes alkyl bond with LEU328.
Inhibitor 30 with S,S stereochemistry has Phe, Met and H at its side groups on scaffold 1 and it has -7.62 kcal/mol free energy and Ki with 2.62 µM.
Figure 3.9 The 3-dimensional orientation of Inhibitor 30 in the active site of the MetAP 2 Enzyme. Amino acid residues are shown as scalled balls and sticks. Amino acid residues are labeled by Discovery Studio. The inhibitor is shown as a
stick and the enzyme is shown as a solid ribbon.
In the Figure 3.9 there are interactions with ILE338, ASP262, PHE219, HIS331, HIS339, PRO220, THR343, ASP251, HIS382, GLU459, GLU364, GLY222, HIS231, ASN329, GLN457, PHE366, LEU328 and ALA230 residues.
Figure 3.10 2D Diagram showing various interactions between the Receptor and Inhibitor 30 as depicted in different colors
In the Figure 3.10 the benzene in phenylalanine at R1 side group makes pi-alkyl bonds with HIS231, ALA230, HIS382 and PHE219. The sulfur in methionine makes pi-sulfur bond with HIS339 and conventional hydrogen bond with ASN329. The methyl group in methionine at R2 side group makes alkyl bond with HIS339. The hydrogen atom connected to nitrogen makes conventional carbon hydrogen bond with GLU364. Also methyl at the scaffold makes carbon hydrogen bonds with ASP262 and GLU459. Another methyl group makes pi-sigma bond with HIS331. The carbonyl group located at the scaffold make carbon hydrogen bond with HIS231.
Inhibitor 31 with R,S stereochemistry has Phe, Met and H at its side groups on scaffold 3 and it has -7.87 kcal/mol free energy and Ki with 1.70 µM.
Figure 3.11 The 3-dimensional orientation of Inhibitor 31 in the active site of the MetAP 2 Enzyme. Amino acid residues are shown as scalled balls and sticks. Amino acid residues are labeled by Discovery Studio. The inhibitor is shown as a
stick and the enzyme is shown as a solid ribbon.
In the Figure 3.11 there are interactions with ILE338, HIS339, ALA414, ASP262, PHE219, HIS331, PRO220, GLU364, ASP251, ASN329, GLY222, GLN457, LEU328, ALA230, PHE366, ASN327, HIS382, TYR444 and HIS231 residues.
Figure 3.12 2D Diagram showing various interactions between the Receptor and Inhibitor 31 as depicted in different colors
In the Figure 3.12 the benzene in phenylalanine at R1 side group makes pi-alkyl bonds with HIS339 and LEU328. The sulfur in methionine makes pi-sulfur bond with HIS382. The methyl group in methionine at R2 side group make alkyl bonds with HIS231, PHE219, ALA414, TYR444 and HIS382. The hydrogen atom connected to nitrogen makes conventional carbon hydrogen bond with GLU364. Also the methyl group at the scaffold make carbon hydrogen bonds with ASP251 and GLU364. Another methyl group make carbon hydrogen bond with ASP251. Lastly, an oxygen atom located at the scaffold makes conventional hydrogen bond with HIS231.