İSTANBUL BILGI UNIVERSITY INSTITUTE OF SOCIAL SCIENCES MARKETING MASTER’S DEGREE PROGRAM
MUSEUM MARKETING AND VALUE CO-CREATION
ORHUN ŞENER 116687010
PROF. DR. SELİME SEZGİN
ISTANBUL 2018
TABLE OF CONTENTS
TABLE OF CONTENTS ... ii
LIST OF FIGURES ... vi
LIST OF TABLES ... vii
ABSTRACT ... x
ÖZET ... xi
INTRODUCTION ... 1
1.LITARETURE REVIEW ... 2
1.1. Museum Learning Process ... 2
1.2. Value Co-creation ... 3
1.3. History of Museums ... 7
1.4. Value Co-creation and Consumers... 9
2. METHODOLOGY ... 13
2.1. Aim of the Research ... 13
2.2. Sampling Design ... 14 2.3. Measurement ... 14 2.4. Hypothesis ... 14 3. RESEARCH FINDINGS ... 18 3.1 Data Analysis ... 18 3.2 Factor Analysis ... 19
3.3 KMO, Bartlett’s Test of Sphericity and Factor Analysis Results of Consumer Types ... 19 3.4. Descriptive Statistics ... 22 3.4.1. Gender ... 22 3.4.2. Educational Level ... 22 3.4.3. Faculty of Education ... 23 3.4.4. Occupational Groups ... 24 3.4.5. Income Level ... 25
3.4.6. Cultural Activity Choices ... 26
3.4.7. Consumer Types Descriptive Statistics ... 28
3.5 Explanation for the Data Analysis ... 28
3.6. Pearson Correlation Analysis and Interpretations ... 29
3.6.1. Participation in Cultural Activities ... 29
3.6.2. Knowledge level of Art, History, and Science ... 30
3.6.3. Effort to Increase Level of Knowledge About Art, History, and Science ... 30
3.6.4. No Time to Research ... 31
3.6.5. Having Enough Knowledge ... 31
3.6.6. Could Not Find a Source for Information ... 32
3.6.7. Effect of Research on Experience ... 33
3.6.8. Just Experience, Not Learning ... 33
3.6.9. Motivation of Being There Instead of Learning ... 34
3.6.10. If Museum Offers Resources ... 34
3.6.11. Effect of Interior and Exterior Designs Before the Visit ... 35
3.6.12. Access to Museum by Public Transportation ... 36
3.6.13. Parking Lot and Visiting Plan ... 36
3.6.14. Spent Time to Reach the Museum ... 37
3.6.15. Ticket Price and Visiting Plan ... 38
3.6.16. Total Spent Time and Visiting Plan ... 38
3.6.17. Effect of Air Temperature, Precipitation, and Traffic on Canceling the Visiting Plan ... 39
3.6.18. Effect of People Who Consumer is Going to Museum with and Canceling Visiting Plan ... 40
3.6.19. Importance of Facilities and Visiting Plan ... 41
3.6.20. Going to Museum with Someone Who Has More Knowledge About the Content ... 41
3.6.21. Highly Praised Movie Coming to the Cinema ... 42
3.6.22. Information Labels ... 43
3.6.25. Level of Internalizing the Conveyed Idea ... 44
3.6.26. Appreciating the Artifact and Level of Knowledge ... 45
3.6.27. Human Interaction and Experience ... 45
3.6.28. Orientation of the Consumer to the Exhibition ... 46
3.6.29. Belongingness and Museum ... 47
3.6.30. Having Fun During the Visit ... 47
3.6.31. Importance of Having Fun During the Visit ... 48
3.6.32. Effect of Curation and Interior Design... 48
3.6.33. Effect of Exterior Architecture... 49
3.6.34. Museum Location and Experience ... 49
3.6.35. Human Interaction and Learning Process ... 50
3.6.36. Satisfaction from the Provided Information ... 50
3.6.37. Provided Information and Making of Meaning ... 51
3.6.38. Perceived Outcomes of the Learning Process ... 52
3.6.39. Unique Meaning Making Process ... 53
3.6.40. Escapism During the Visit ... 54
3.6.41. Met Expectations During the Visit ... 54
3.6.42. Belongingness and Visitor ... 55
3.6.43. Visiting Without an Expectation ... 56
3.6.44. Entourage and Satisfaction ... 57
3.6.45. Information and Satisfaction ... 57
3.6.46. Content Generation ... 57
3.6.47. Re-visiting the Same Exhibition ... 58
3.6.48. Visiting a New Exhibition ... 58
3.6.49. Effect of Souvenir Shop ... 59
3.6.50. Level of Satisfaction and Hypothetical Offerings ... 59
3.6.51. Source of Satisfaction ... 61
3.6.52 Motivation of Re-visiting ... 62
CONCLUSION ... 63
MANAGERIAL IMPLICATIONS ... 67
APPENDIX ... 72 Table A.1 Hypothesis Results ... 72
LIST OF FIGURES
Figure 3.4.1.1. Gender Pie Chart 22
Figure 3.4.2.1 Educational Level Pie Chart 23
Figure 3.4.3.1. Faculty of Education Pie Chart 24
Figure 3.4.4.1. Occupational Group Pie Chart 25
Figure 3.4.5.1. Income Level Pie Chart 26
LIST OF TABLES
Table 3.3.1. KMO, Bartlett’s Test Results of Consumer Types 19
Table 3.3.2. Factor Analysis of Consumer Types 20
Table 3.3.3. Cronbach Alfa Results of Consumer Types 21
Table 3.4.1.1. Frequency of Gender 22
Table 3.4.2.1. Frequency of Educational Level 23
Table 3.4.3.1. Frequency of Faculty of Education 24
Table 3.4.4.1. Frequency of Occupational Groups 25
Table 3.4.5.1. Frequency of Income Level 25
Table 3.4.6.1. Frequency of Cultural Activity Choices 27 Table 3.4.7.1. Consumer Types Mean and Std. Deviation Results 28 Table 3.6.1.1. Pearson Correlation Results of Consumer Types with Questions
from Seven to Nine 29
Table 3.6.5.1. Pearson Correlation Results of Consumer Types with Questions
from Forty-two to Forty-seven 32
Table 3.6.10.1. Pearson Correlation Results of Consumer Types with Question
Forty-eight 35
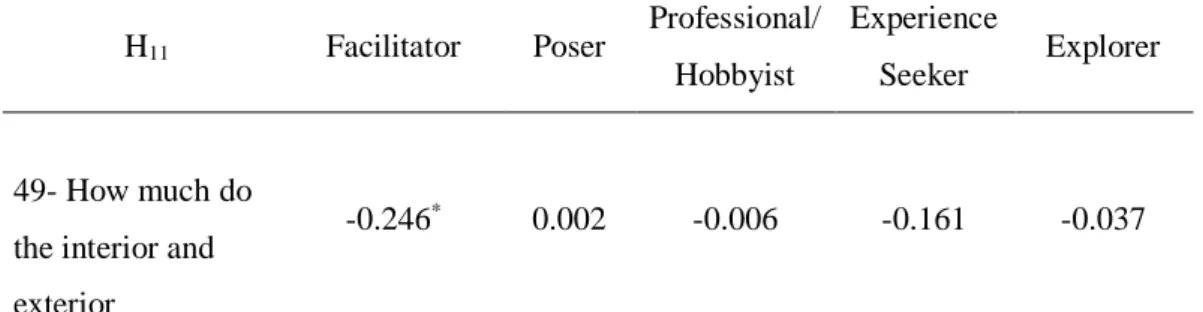
Table 3.6.11.1 Pearson Correlation Results of Consumer Types with Question
Forty-nine 35
3.6.12.1. Pearson Correlation Results of Consumer Types with Question Fifty 36 Table 3.6.13.1. Pearson Correlation Results of Consumer Types with Question
Fifty-one 37
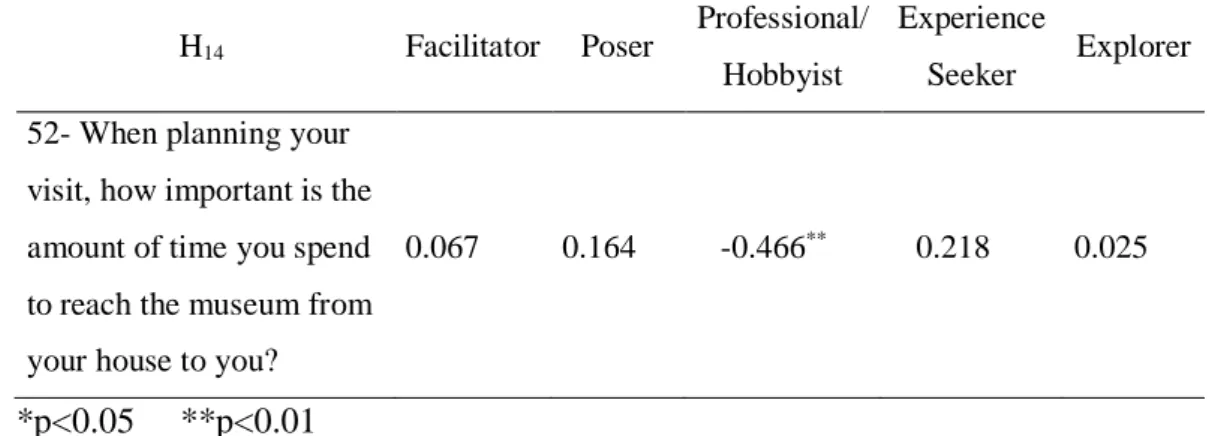
Table 3.6.14.1. Pearson Correlation Results of Consumer Types with Question
Fifty-two 37
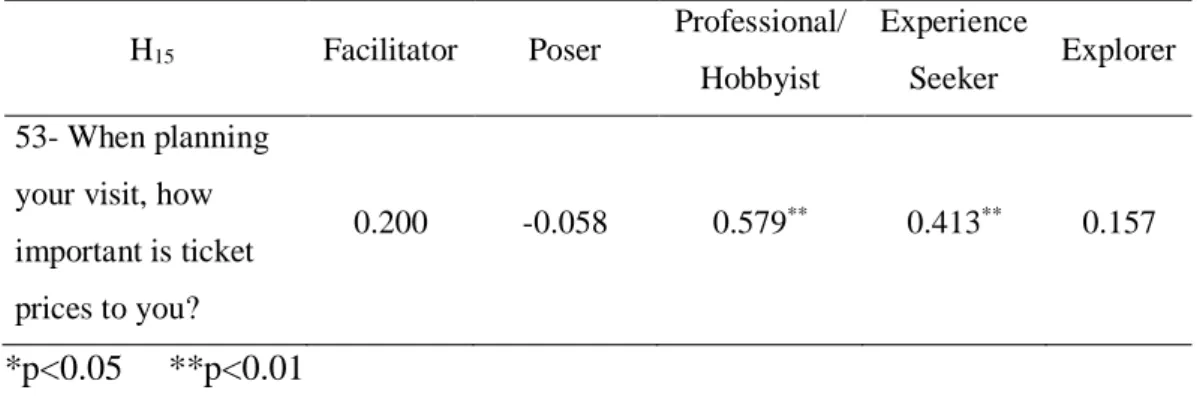
Table 3.6.15.1. Pearson Correlation Results of Consumer Types with Question
Fifty-three 38
Table 3.6.16.1. Pearson Correlation Results of Consumer Types with Question
Fifty-four 39
Table 3.6.19.1. Pearson Correlation Results of Consumer Types with Question
Fifty-seven 41
Table 3.6.20.1. Pearson Correlation Results of Consumer Types with Question
Fifty-eight 42
Table 3.6.21.1. Pearson Correlation Results of Consumer Types with Question
Fifty-nine 42
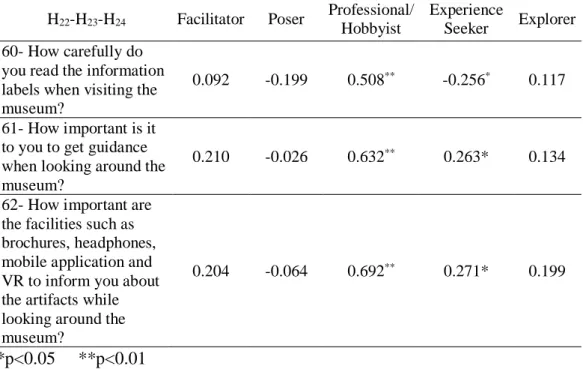
Table 3.6.22.1. Pearson Correlation Results of Consumer Types with Questions
from Sixty to Sixty-two 43
Table 3.6.25.1. Pearson Correlation Results of Consumer Types with Question
Sixty-three 44
Table 3.6.26.1. Pearson Correlation Results of Consumer Types with Question
Sixty-four 45
Table 3.6.27.1. Pearson Correlation Results of Consumer Types with Question
Sixty-five 46
Table 3.6.28.1. Pearson Correlation Results of Consumer Types with Questions
Sixty-six and Sixty-seven 46
Table 3.6.30.1. Pearson Correlation Results of Consumer Types with Questions
Sixty-eight and Sixty-nine 47
Table 3.6.32.1. Pearson Correlation Results of Consumer Types with Questions
Seventy and Seventy-one 48
Table 3.6.34.1. Pearson Correlation Results of Consumer Types with Question
Seventy-two 49
Table 3.6.35.1. Pearson Correlation Results of Consumer Types with Question
Seventy-three 50
Table 3.6.36.1. Pearson Correlation Results of Consumer Types with Question
Seventy-four 51
Table 3.6.37.1. Pearson Correlation Results of Consumer Types with Question
Seventy-five 52
Table 3.6.38.1. Pearson Correlation Results of Consumer Types with Questions
from Seventy-six to Eighty 53
Table 3.6.39.1. Pearson Correlation Results of Consumer Types with Questions
Table 3.6.40.1 Pearson Correlation Results of Consumer Types with Question
Eighty-two 54
Table 3.6.41.1. Pearson Correlation Results of Consumer Types with Question
Eighty-three 55
Table 3.6.42.1. Pearson Correlation Results of Consumer Types with Question
Eighty-four 56
Table 3.6.43.1. Pearson Correlation Results of Consumer Types with Questions
from Eighty-five to Eighty-seven 56
Table 3.6.46.1. Pearson Correlation Results of Consumer Types with Question
Eighty-eight 57
Table 3.6.47.1. Pearson Correlation Results of Consumer Types with Questions
Eighty-nine and Ninety 58
Table 3.6.49.1. Pearson Correlation Results of Consumer Types with Question
Ninety-one 59
Table 3.6.50.1. Pearson Correlation Results of Consumer Types with Questions
from Ninety-two to Ninety-six 60
Table 3.6.51.1. Pearson Correlation Results of Consumer Types with Questions
from Ninety-seven to One Hundred 61
Table 3.6.52.1. Pearson Correlation Results of Consumer Types with Questions
ABSTRACT
This study intends to better understand the museum visitors and their perspective about the museum visit and to describe the museum’s objectives. Different museum visitor types and their tendencies about before, during, and after the museum visit time lines are investigated from the value co-creation and museum learning perspective. The museum learning theory’s twelve dimensions such as motivation and expectation, prior knowledge, previous experience, prior interest of the visitor, control and choice, social group mediation, mediation by people from the outer social group, advance organizers, the orientation of the visitor within the physical environment, large-scale environment and architectural elements, design, and reinforcing experiences and events outside the museum are mentioned. Value Co-creation’s five axioms, museum transformation in time periods, and their common points are explained and supported with data analysis in this study. The survey questions are prepared to test several postulates about the Turkish market to combine the marketing and museology mentality.
Based on the collected data by online survey method from a sample of 148 respondents, by using factor analysis, this study designates five factors, namely Facilitator, Professional/Hobbyist, Poser, Experience Seeker, and Explorer. General descriptive data about the respondents is explained in the study. Secondly, designated factors and their correlations with several variables are investigated by Pearson correlation analysis to get several insights about the consumers and museums. Finally, each factor’s correlation results with asked matters such as participation in cultural activities, prior knowledge, pre-learning, effect of physical environment, time, price sensitiveness, cancelation reason, social group, information source, appreciation, human interaction, orientation, belongingness, enjoyment, learning, escapism, content generation, re-visiting, and source of satisfaction are shown and explained. The study provides several insights about the museum visiting experience.
ÖZET
Bu araştırmanın amacı müze ziyaretçilerini ve onların müze ziyareti hakkındaki bakış açılarını anlamak ve müzelerin hedeflerini tanımlamaktır. Farklı müze ziyaretçi tipleri ve onların müze ziyaretleri sırasındaki eğilimleri, ziyaret öncesi, ziyaret anı ve ziyaret sonrası ortak değer yaratımı ve müze öğrenimi bakış açısı ile incelenmiştir. Bu çalışmada müze öğrenimi teorisinin on iki boyutu, ortak değer yaratımının beş önermesi, zaman aralıklarındaki müze dönüşümü ve onların ortak noktaları açıklanmış ve veri analizleri ile desteklenmiştir. Anket soruları, Türkiye piyasasındaki pazarlama ve müzecilik mantalitesini bir araya getirmek amacında olan bazı varsayımları, bazı teorik bilgilerin yardımı ile test etmek hedefiyle hazırlanmıştır.
Bu çalışma, çevrimiçi anket yöntemi ile, araştırmaya katılan 148 katılımcıdan elde edilen verilere dayanarak ve faktör analizi kullanılarak Facilitator, Professional/Hobbyist, Poser, Experience Seeker, ve Explorer olmak üzere beş faktörü belirtmektedir. Araştırmaya katılan kişiler hakkında genel tanımlayıcı veriler çalışmada açıklanmıştır. Buna ek olarak, tüketiciler ve müzeler hakkında birtakım bakış açıları elde etmek amacı ile, belirtilen faktörler ve bu faktörlerin çeşitli değişkenler ile olan bağıntıları Pearson korelasyon analizi ile incelenmiştir. Son olarak, her faktörün kültürel faaliyetlere katılım, ön bilgi, ön öğrenme, fiziksel çevrenin etkisi, zaman, fiyat hassasiyeti, iptal etme sebebi, sosyal grup, bilgi kaynağı, anlama, insan etkileşimi, çevreye uyum, zevk alma, aidiyet hissi, öğrenme, dış dünyadan kaçma, içerik üretimi, tekrar ziyaret etme ve memnuniyet kaynağı gibi sorulan konular ile korelasyon sonuçları gösterilmiş ve açıklanmıştır. Çalışma, müze ziyareti deneyimi hakkında birçok öngörü sağlamaktadır.
Anahtar Kelimeler: Müze pazarlaması, ortak değer yaratımı, müze öğrenimi, müze deneyimi, Poser
INTRODUCTION
The word of museum covers several aspects like education, enjoyment, research, conservation, and so on. These elements of the museum concept have been transformed in time with the influences of several social, political, and economic variables. Defining the transformation of the museums is a complex study but trying to understand it to implement the concept of museum on marketing field is a necessary work for the survival of the museums.
From the perspective of the consumers, museum experience’s personal, sociocultural, and physical dimensions should be examined like Falk and Storksdieck (2005) did. In this way, the experience’s some subheadings can be explained. Also, internalization of the museum concept is required for marketer because only this way a link can be established between the consumers and museums. To internalize the concept, historical background of the museums can be the prospective narration of the future. Cause and effect relationship of the past is the lodestar to understand the today’s and future’s museums. For combining the both sides of the interaction, the museum and consumer, Vargo and Lusch’ s (2017) value co-creation theory can be a tool to achieve that because the theory focuses on all possible actors which take place in the interaction. For reaching the level of creating value for all parties, the museums need to give scope for their consumers with recognizing different consumer types and their behaviors about museum visiting experience. In light of this mentality, this study is conducted to comprehend the museums and their consumers.
1.LITARETURE REVIEW
1.1. Museum Learning Process
“A museum is a non-profit, permanent institution in the service of society and its development, open to the public, which acquires, conserves, researches, communicates, and exhibits the tangible and intangible heritage of humanity and its environment for the purposes of education, study and enjoyment.”
ICOM
According to the International Council of Museums, one of the most significant purposes of museums is education. In other words, museums are places for learning. However, there are dissimilarities between museum learning and conventional school education. Basically, museums offer a free choice learning system, a setting. It means that it is the visitors who decide on how, what, and where they want to learn. Falk and Dierking (2000) use The Contextual Model of Learning as a tool for organizing the variables of the complex phenomenon of free choice learning. The model explains learning as an effort which contains a never-ending dialogue between a person and his/her physical and socio-cultural environment. The model uses of personal, physical, and sociocultural contexts. Falk and Storksdieck (2005) accepted The Contextual Model of Learning as a framework. The personal dimension of the model refers to the individual motivation and expectation about learning from the museum experience. According to the framework, motivation and expectations are shaped by a person’s beliefs, interests, and prior knowledge. These factors cumulatively reveal a desire for learning with informed choice and personal control over what individual receives as information. Falk and Storksdieck (2005) point out at two different extents of the sociocultural dimension of the framework. A museum's cultural position in the society and the cultural value of free choice learning are the sociocultural influencers of museum learning. The major influencer is defined as social interaction within and also without an individual’s social group.
dimensional place which houses lighting, climate, exhibition objects, crowding, color, sound and so on. Falk and Storksdieck (2005) underline the need for orientation between the physical environment and the visitor for a better learning process, and, after considering hundreds of studies, they set forth twelve influential factors for a museum learning experience.
Personal Dimension
1. Motivation and expectation of the visitor 2. Prior knowledge of the visitor
3. Previous experience of the visitor 4. Prior interest of the visitor
5. Control and choice
Sociocultural Dimension 6. Social group mediation
7. Mediation by people from the outer social group
Physical Dimension
8. Advance organizers
9. The orientation of the visitor within the physical environment 10. Large-scale environment and architectural elements
11. Design
12. Reinforcing experiences and events outside the museum
These factors are chosen for determining the influencer effects of the museum learning process. When we scrutinize these twelve factors, we see that together they form the human factor. Therefore, we can conclude that visitors are the co-creators of the museum learning process, instead of being passive receptors. Hence, visitors should be part of the co-curation processes.
1.2. Value Co-creation
Service-dominant logic is based on a postulate which suggests that value creation is a reciprocal process. The customer is a party as a co-creator of value in the
process which is interactional, relational, and experiential (Vargo and Lusch, 2004, 2008; Ranjan and Read, 2014). A company's goods are the transmitter of services, and services are company's value propositions. A consumer is the determinative actor of the value; and value cannot be emerged only by a company. Its creation is about the consumer’s experience or usage (Vargo and Lusch, 2004). This explanation is broadened when multiple actors are added, other than the company and customer (Vargo and Lusch, 2016). This way, value creation happens between the firm, customer and all other alterable actors.
Vargo and Lusch (2017, p.47) suggest axioms for determining the essentials of the service-dominant logic:
1. Service is the root cause of the exchange.
2. Value co-creation can be performed by multiple actors, and always with the beneficiary.
3. Economic and social agents are resource integrators. 4. The beneficiary determines the value uniquely.
5. Actor-generated institutions and institutional arrangements coordinate the value co-creation process.
In several articles on value co-creation and museum marketing, there is a confusion about the difference between consumer centricity and value co-creation. Targeting to do better or trying to find ways to attract more customers is consumer-centric, but is also linked to goods-dominant logic. From the perspective of the service-dominant logic, value creation is some sort of a support mechanism to help consumers for getting their tasks done (Bettencourt, Lusch and Vargo, 2014: 44). This means that the combination of consumers’ value judgment and companies’ know-how to improve the consumer experience, with what companies have to offer, are fundamental topics for service-dominant logic. For a museum, considering to add new technologies to exhibition spaces, creating a more attractive environment for visitors, and constructing new features for receiving appreciation from visitors are consumer-centric ideas; but if there is a lack of emphasis on value co-creation, such initiatives will not go beyond old-fashioned methods. Focusing on increasing
mean that the performed work was carried out with a service-dominant logic behind it; because value that is offered through new methods is a production of the firm, and is transferred to the consumer at the exchange time. However, value co-creation is part of the process that goes from the moment of the company's resource integration to when the customer's tasks are done (Bettencourt, Lusch and Vargo, 2014, p.48). Because of that, the timing of value co-creation is alike before, during, and after the visit.
According to Falk and Dierking (2000, p.87-88), visitors come to the museum with their pre-knowledge, skills, beliefs, interests, and experiences. The background of the consumers affects their educational experience and their meaning-making process in the museum. There is a relationship between the museum's operant and operand resources, and the visitor's operant resources. From this point of view, the museum can offer its value proposition, and the consumers can be the editors of their experience. It shows that value creation begins before the moment of exchange, i.e. before the visit. In the Contextual Model of Learning, Falk and Storksdieck (2005) argue that the personal elements are part of the visitor’s operant resources. In this case, the experience starts before the visit takes place. The differences between consumers' backgrounds may lead them to follow a different kind of visiting plan. Because of this difference, visitors' intentions and expectations from the museum may vary in terms of their interaction, learning process, and meaning-making processes.
Falk and Storksdieck (2005) argue that the physical environment and the socio-cultural settings are essential parts of the experience. As it is explained in the Contextual Model of Learning, the value of the physical environment and the socio-cultural setting is related to participation and human interaction. From the service-dominant logic perspective, participation should include cooperation, active involvement, and dialogue between the firm and the consumer, which makes the consumer a developer and creator of the experience, rather than a sole spectator. According to Minkiewicz, Evans and Bridson (2014: 31-58), social interactions can be the basis of the experience. Visitors' in and out-group interactions and interaction with employees happen at the moment of delivery, during the visit. During the visit, visitors share the environment, the museum setting. Value co-creation process
during the visit cannot be explained only as a relation between a consumer and a firm. Other visitors and employees who share the service environment can also be influential upon an individual’s experiences. From this perspective, there is a correlation between the learning and experience variables, and others who share the physical environment. The physical environment and the social-cultural settings are part of the co-creation process during the visit, but we need to remember that personal elements are also significant parts of the procedure. To sum up, personal motivation, expectation, prior knowledge, interest, and previous experience shape an individual's approach to their museum visit. The interaction between individuals includes these personal aspects too; because every visitor, who is the sole value creator and who can be an influencer of other consumers comes to the service environment with its capability as a determinant actor.
The final phase of the co-creation process is not the moment when the visit is concluded. Content generation, re-visiting plan, continued learning intention and real buying are also parts of the value co-creation after the visit. However, these elements of value creation are linked with the intervals before and during the visit. Experienced value outcomes, which this paper aims to investigate, such as learning, escapism, belongingness, aesthetics, and entertainment lead the consumers to the value co-creation stage after the visit.
According to Prahald and Ramaswamy’s (2004: 4-8) model for value co-creation, companies should provide accessibility, dialogue, transparency, and risk-benefit consideration. These are defined as a sub-structure of value co-creation process. The risk-benefit consideration shows the possible adverse outcomes of value co-creation. Terblanche, (2014: 7) states that a high level of consumer participation can result in uncertainty and risk. Parties of the value co-creation process may show lack of knowledge, skill, and also unexpected manners. In this case, the process can transform into value co-destruction.
The value co-creation process requires a high level of harmony between all actors. A suitable environment and procedure for value co-creation cannot be maintained only with rules, methods, and models. For correct matching between parties, the social, political and cultural transformation of the parties need to be examined.
1.3. History of Museums
In 3rd century BC, there was a place in Egypt named Mouseion. Mouseion can be translated as the Seat of the Muses. Who were the Muses? They were the nine daughters of Zeus and Mnemosyne, and represented poetry, history, music, tragedy, hymns, dancing, comedy, and astronomy. However, Mouseion was not a museum! There was not a collection of artistic works or artifacts to exhibit. This place was dedicated to contemplation and philosophical discussion, but, over time, the word Mouseion nevertheless transformed into the word museum. The very first example of a museum-like concept was Lorenzo de' Medici's collection in the 15th century in Florence; but the collection, the denoted building, and the mentality of having a collection were far different from the understanding of modern museum (Lewis, 1998).
Between the 16th and 18th centuries, the most popular type of collection was the cabinets of curiosity (Wunderkammer). It was the interest of nobles, scholars, and members of royal families. The collection in these cabinets were a combination of chaotically collected materials. Vegetable lamps, sculptures, paintings, minerals, botanical objects, and ethnographic objects were present in the same collection without any order and installation (Barrett, 2014). The difference between modern museums and cabinets of curiosity is not only about the technical details. In a cabinet of curiosity, the owner is the center of the artificial universe of wonders. The owner, an elite in the society, who holds power, privilege and wealth, presents his collection to other elites here. Educating the society or creating a democratized place was not the objective of and reason for owning a collection, even if the collection was open to public display.
In the 19th century, understanding of museum had become more public related matter. Until this time, there was a confusion about museums’ raison d’être. The found reason was basically about the public good (Lewis, 1998). The time that we are examining is significant because changes in mentality about the museum concept is related to politics. While authorities tried to shape museums, one of the major target was establishing a nationality based awareness of the society. Especially, industrialization and urbanization (Booth, 2014, p.209) triggered the
change in museums like all the changes in social life and institutions. According to Lewis (1998), the second half of the 19th century was the time of museum boom.
100 museums in Britain and 50 museums in Germany were established (Lewis, 1998). The reason for this boom cannot be explained only by needs of public about art and science. Movements of free education and idea of civic pride were influencers about the boom because exhibited pieces were introduced in schools as well. At the same time, we can see the integration of museums to the education system.
An example about museums and their importance about educating the society can be seen in the early 20th century. After the Russian Revolution, the position of art
and culture in the society were changed systematically (Lewis, 1998). Art and culture were accepted as tools for education, educating the society according to scientific socialist forms, under the political system which is based on social ownership, equality, and democratic control. Marxist art theory indicates that art should be for the public, especially for working class and their enlightenment. Basically, art needs to be revolutionary world outlook. Private interest as egoism and empiricism were Marx’s and Marxist art’ s major principles to attack (Lifshitz, 1976). On the other hand, there was a different kind of target for achieving with museums in Germany. According to Lewis (1998), nationalistic tones, history of the homeland, and important figures of German history were promoted by museums after WWI. The policies of this era from museums to daily life resulted with Nazi regime.
After the Second World War, museums transformed into educational and leisure-oriented communication places. Specialists and marketing managers involved in the museums and their works. Because of these, museums became more attractive and popular in the society. American museums visited 350 million times in 1970, 566 million times in 1988 and Russian museums reached the annually 140 million visits (Lewis, 1998).
It is obvious that there are complex relations between social change, political environment, understanding of art, culture, and museums. The relationship between visitor and museum is also a relationship between object, aesthetic pattern, history,
Looseley (2004), history of finding a social mission in art goes back to the French Revolution. Artistic productions and collections began their journey with private ownership of rulers, nobles, and elites; but the path of time led them to the public. In other words, the democratization of world resulted with the democratization of museum and art. However, this is not a concluded process. According to the research of Antonovica and Idoeta (2012) which is mentioned by Booth’s article, museum visitors are generally well-educated people who have higher income and high-status jobs in Germany (Booth, 2014). This shows that the place, museum, is accessible to the public today, but the benefits are for people who have specific types of cultural and social capitals.
1.4. Value Co-creation and Consumers
The theory of value co-creation is completely about marketing, but it focuses on various actors from the level of production to consumption. Hence, the real-life practice of value co-creation theory should cover social, cultural, economic, and political aspects, too. The relationship between the actors can be influenced by these aspects. Therefore, the theory represents more than an innovative marketing axiom. It describes what society wants in the 21st century. Implementation of value co-creation to museums can be the definer of understanding of museum concept in the 21st century. In parallel with this deduction, understanding the consumer, the visitor, is crucial for museums. To do this, finding different consumer types and their characteristics is a necessary work.
John H. Falk (2006) creates five consumer groups in his article, “An Identity-Centered Approach to Understanding Museum Learning”, claiming that each group has its own visit intention, expectation, understanding of satisfaction, visiting plan, learning aim, level of interaction, interest, understanding of escapism, and relation with the environment when visiting a museum.
The Explorer’s visit intention is based on curiosity and general interest. Individuals who belong to this group mostly defined themselves as curious people. In the Explorer group, there are people who self-described themselves as science lovers, learners, and discoverers too. Satisfaction of others, their social group, does not
have a direct influence on the Explorers. They see the museum visit as an individualistic experience (John H. Falk, 2006). Because of the general interest in the content, these people's visiting plan may not be designed for a specific artwork or an artifact. Institution's general concept is more significant for them. In other words, the theme of the exhibition is more important than the one particular exhibited object. Based on this, these people may have less possessed background knowledge than the people who belong to Professional/Hobbyist type. Also, they may be less selective about conveyed information than the Professionals/Hobbyists. In the matter of possessed knowledge and learning intention, Explorers seem to be more purposeful than Facilitators and Experience Seekers. Their experience is individualistic. Therefore, social interaction can be limited to them in contrast to Facilitators.
Facilitators are socially motivated consumers for their visit. In contrast to Explorers, the satisfaction of their social group is highly essential for them. Their visiting intention is shaped by their children's, boyfriend's/girlfriend's, or relative's potential perceived benefits from the visit. For the facilitator, a museum is not the firstly desired destination for an activity (John H. Falk, 2006). The Facilitator has a purpose for doing something good for his/her social group. Their source of motivation depends on others. Because of that, others' perspective about the level of satisfaction, level of enjoyment, learning, perceived benefit, and perceived quality can be influential on the Facilitator's idea about the museum experience. Obviously, Facilitator is more open to social interaction before, during, and after the visit. The interaction can happen as a group social interaction and inter-group social interaction. The Facilitator' s opinion about the museum visiting for an activity gives us a chance to interpret their expectation from the museum about getting information, information sources, quality of information sources, and enhancing their level of knowledge. These expectations tend to be lower than those of the Explorer's and Professional's/Hobbyist's. Expectations about collecting experience also tend to be different from the Experience Seekers’.
Professionals/Hobbyists possess strong knowledge and interest about the content. Museum learning and getting information is highly significant for them. Enhancing
visit. Because of that, the way of conveying information is significant for these customers (John H. Falk, 2006). Museum learning and getting information are visiting intentions for this consumer group. Because of that, their sensitivity about these matters should be the highest among other groups. Their strong knowledge about the content can lead them to experience a more professional meaning-making process. Therefore, they may tend to evaluate design elements, setup, and scenography more attentively than other groups.
The Experience Seekers’ visiting intention is about collecting experience. Being in the museum space can be sufficient experience. They are generally tourists or people who are driven by other's recommendation. Remembering and learning are limited to these individuals. Their recreational identity perspective affects what they learn and remember (John H. Falk, 2006). Learning from a museum is limited for this group because their visiting intention is about the experience. Therefore, learning and information variables are fade into insignificance beside their experience of being in and discovering a new place, museum or exhibition. For this group, the critical word is “new”.
The Spiritual Pilgrims’ visiting intentions are rejuvenating, being enjoyed by the wonder of the place, and having spiritual/restorative experience (John H. Falk, 2006). For them, a museum is a place for escaping daily life. This group’s intentions and expectations are emotional. Escapism is the visiting intention for them. Physical environment, setup, and scenography have great importance for this group. In the study of John H. Falk, The Spiritual Pilgrim group cannot be found with necessary number of consumers. Only one individual was found suitable for The Spiritual Pilgrim group. After discussing with several art history graduates, it is predicted that this group can be a part of the Professional/Hobbyist group in the Turkish market.
These groups show the unique type of consumer behaviors in terms of the museum visit. Collected variables may show differences among different societies because the concept of museum is not perceived the same way in everywhere. As seen in the historical background of the museums, transformation of the museums and transformation of the society is linked to each other. Because of that, Falk's investigated variables may show distinctness in different markets. This situation
creates alternative groups with the same topics to study. From the value co-creation perspective, there should be a relation between groups' tendency and feeling of belongingness too. Do visitors feel that museums are for them? Theoretically, museums are democratized places today. However, the perception of the consumers is significant in determining this. Therefore, belongingness and other variables should be examined attentively.
Bourdieu (1986) focuses on cultural capital, and he breaks down the capital into three distinctive forms, namely embodied, objectified and institutionalized. Having these three forms gives an individual a chance to possess a high cultural capital. People who have high cultural capital also have a good taste about culture (Hanquinet, 2016). According to Bourdieu, these people possess greater social value and elevated position in the social strata. If we consider the relationship between place and individual, we can interpret that place has a position in cultural capital concept too. Combination of embodied and objectified forms of cultural capital requires materialistic goods, ability to use them, and also economic resources. Basically, being art literate and economically sufficient to reaching cultural and artistic instruments are part of this cultural capital equation. Museum as a place which represents culture and art can be accepted as an instrument which can be placed in cultural capital concept. In this case, visiting a museum, art consumption, requires embodied and objectified forms of the capital. Cultural capital is not a stationary accumulation. There is a relationship between age, generation, and emerging forms of cultural capital (Reeves, 2016). The important part of this research is not about socio-professional strata, age, gender or education of the possible new consumer group. There are people who have the viable cultural capital for visiting a museum like a mirror effect about forms of the capital. The possible new consumer group is based on an axiom which claims that there are people who want to be placed in the different social strata and who want to have a higher social value perform museum visits because of the relationship between cultural capital and place. They are named as "Poser". This group is based on social strata and cultural capital. These consumers have a concern about their social strata or adapting their lifestyle to a specific, usually a higher strata. Consumers may
themselves in different strata, but the important thing is their museum visiting details. These visitors' learning expectation, social interaction, and evaluation of the environmental instruments can be limited. Being there like a completing a duty without educational and emotional outcomes can be enough for them. These consumers tend to see the museum as a highbrow's place, elite environment, and place for reflecting individual's cultural capital. This group may show several common attitudes with aforementioned five consumer groups. However, the main difference can be about the expectations of the consumer, Poser, concerning to learning, satisfaction and emotional process that comes with the museum visiting experience.
In the literature review part, the museum learning theory’s twelve dimensions such as motivation and expectation, prior knowledge, previous experience, prior interest of the visitor, control and choice, social group mediation, mediation by people from the outer social group, advance organizers, the orientation of the visitor within the physical environment, large-scale environment and architectural elements, design, and reinforcing experiences and events outside the museum are mentioned. The theory of value co-creation and the museum transformation in time periods are explained. The museum transformation is also explained for laying emphasis on necessity of progressive marketing mentality for the survival of the museums. Five different consumer types which are resultant of several research and one consumer type, namely Poser, which is built on cultural capital theory uniquely for this thesis are clarified. The consumer types are designed and determined according to all findings of the literature review.
2. METHODOLOGY
2.1. Aim of the Research
The main aim of the study is to find different factors and their correlation with the museum visiting experience. Different factors’ correlation with pre-learning, learning, visiting plan, importance of museum’ s physical elements, spent time, human interaction, influence of alternative plans, level of understanding the
exhibition, belongingness, enjoyment, meaning making process, escapism, content generation, re-visiting plan, and reason of satisfaction were investigated.
2.2. Sampling Design
In order to find factors and their correlation with several matters, an online survey was conducted. With survey questions, respondents’ personal perspectives about general cultural activities and specific museum related ideas were investigated. Data was collected between February 2018 and May 2018. 96 people were accepted as involved individuals in the study.
2.3. Measurement
Two types of questions were asked to participants. For reaching the descriptive statistics, multiple choice questions were used. For other variables, five point Likert scale ranging from Strongly Disagree=1 to Strongly Agree=5 were used.
2.4. Hypothesis
H1: Different consumer types differ in the frequency of participation in cultural activities.
H2: Different consumer types differ in the level of knowledge about art, history, and science.
H3: Different consumer types differ in the effort of increasing level of knowledge about art, history, and science.
H4: Different consumer types differ in the reason of not doing research because of the time allocation.
H5: Different consumer types differ in the reason of not doing research because of the prior knowledge.
H6: Different consumer types differ in the reason of not doing research because of the information sources.
H7: Different consumer types differ in the reason of not doing research because of the potential effect of research on experience.
H8: Different consumer types differ in the reason of not doing research because of the purpose of experience without a learning process.
H9: Different consumer types differ in the reason of not doing research because of the main motivation of just being in the museum environment.
H10: Different consumer types differ in the usage of hypothetical information sources offered by the museums.
H11: Different consumer types differ in the effect of interior and exterior design of the museum on museum visit plan.
H12: Different consumer types differ in giving importance to access to the museum by public transportation.
H13: Different consumer types differ in giving importance to the museum’s parking lot.
H14: Different consumer types differ in giving importance to spent time to reach the museum.
H15: Different consumer types differ in giving importance to ticket price. H16: Different consumer types differ in giving importance to total spent time. H17: Different consumer types differ in canceling decision of the museum visiting plan because of the air temperature, precipitation or traffic.
H18: Different consumer types differ in canceling decision of the museum visiting plan because of the entourage’s decisions.
H19: Different consumer types differ in giving importance to facilities of the museum such as restaurant, café, and garden.
H20: Different consumer types differ in going to museum with someone who has more knowledge about the content of the museum/exhibition.
H21: Different consumer types differ in canceling decision of the museum visiting plan because of a highly praised movie.
H22: Different consumer types differ in carefulness about reading the information labels.
H24: Different consumer types differ in giving importance to the facilities such as brochures, headphones, mobile application, and VR.
H25: Different consumer types differ in level of internalizing the conveyed idea of the exhibition.
H26: Different consumer types differ in the possessed knowledge to appreciate the artifacts.
H27: Different consumer types differ in the effect of human interaction on the experience.
H28: Different consumer types differ in the orientation to exhibition.
H29: Different consumer types differ in the belongingness from the museum’s perspective.
H30: Different consumer types differ in the perceived fun.
H31: Different consumer types differ in giving importance to have fun.
H32: Different consumer types differ in the effect of curation and interior design on experience during the visit.
H33: Different consumer types differ in the effect of museum’s exterior architecture on experience during the visit.
H34: Different consumer types differ in the effect of historical or architectural significance of the neighborhood, where the museum is located, on experience. H35: Different consumer types differ in the effect of human interaction on the learning process during the visit.
H36: Different consumer types differ in the satisfaction level from the provided information.
H37: Different consumer types differ in the idea of provided information has enabled them to go through a better meaning making process.
H38: Different consumer types differ in increasing the level of knowledge during the visit about what visitor already knew.
H39: Different consumer types differ in visualizing what visitor already knew without increasing the level of knowledge during the visit.
H40: Different consumer types differ in the idea of learning a whole lot of new things during the visit.
H41: Different consumer types differ in finding what they learn during the visit unnecessary.
H42: Different consumer types differ in the idea of learning nothing from the museum during the visit.
H43: Different consumer types differ in having a unique meaning making process. H44: Different consumer types differ in escapism during the visit.
H45: Different consumer types differ in the level of satisfaction during the visit. H46: Different consumer types differ in the belongingness from the consumer’s perspective.
H47: Different consumer types differ in the idea of just being in the museum without an expectation.
H48: Different consumer types differ in the effect of entourage’s satisfaction on visitor’s level of satisfaction.
H49: Different consumer types differ in the effect of received information from the museum on visitor’s overall satisfaction level after the visit.
H50: Different consumer types differ in the intention of providing content to other people.
H51: Different consumer types differ in the intention of re-visiting the same exhibition.
H52: Different consumer types differ in the intention of visiting a new exhibition in the same museum.
H53: Different consumer types differ in the effect of souvenir shop on the level of satisfaction.
H54: Different consumer types differ in the hypothetical offering of more specific information to increase the consumer satisfaction.
H55: Different consumer types differ in the hypothetical offering of more descriptive and understandable general information to increase the consumer satisfaction.
H56: Different consumer types differ in the hypothetical offering of a better environment for feeling free from the outside world to increase the consumer satisfaction.
H57: Different consumer types differ in the hypothetical offering of better time for the consumer and his/her entourage to increase the consumer satisfaction.
H58: Different consumer types differ in the hypothetical offering of making consumer feel like being in the museum is a sociocultural outcome to increase the consumer satisfaction.
H59: Different consumer types differ in the satisfaction source of learning H60: Different consumer types differ in the satisfaction source of feeling. H61: Different consumer types differ in the satisfaction source of sharing.
H62: Different consumer types differ in the satisfaction source of being in the museum environment.
H63: Different consumer types differ in the motivation of re-visiting the same exhibition to live the same experience once more.
H64: Different consumer types differ in the motivation of re-visiting the same exhibition to get information and learn more.
H65: Different consumer types differ in the motivation of re-visiting the same exhibition to visit with people consumer recommended to.
H66: Different consumer types differ in the motivation of re-visiting the same exhibition to feel free from the outside world and relax.
H67: Different consumer types differ in the motivation of re-visiting the same exhibition for the sociocultural value of simply being in the museum.
3. RESEARCH FINDINGS
3.1 Data Analysis
Collected data was analyzed using SPSS 24.0 (Statistical Package for Social Sciences) program. Exploratory Factor Analysis was used for discovering the factors. During the factor analysis, KMO (Kaiser-Meyer-Olkin) and Bartlett’s test of Sphericity results were checked. Cronbach’s Alpha measures were checked for internal consistency. In this part of the analysis, factors were found and specified.
Descriptive analysis techniques (mean, standard deviation, minimum, maximum), frequency analysis, and Pearson’s correlation analysis were used at the second stage of the analysis.
3.2 Factor Analysis
The aim of the factor analysis is to determine the sets of variables which have high interrelations (Hair et al. 2006). Factor analysis is executed to examine the relationship between content categories and construct. In this research, factor analysis is done for finding different factor groups that are theoretically created. Questions for designing factors are not cited from another study. Therefore, adequacy of the data should be checked. For this reason, Keiser-Meyer-Olkin (KMO) and Bartlett’s test of Sphericity are done to find out that the data is appropriate to apply the factor analysis or not (Hair, 2016, p.114). According to Hair (2006, p.115), lower limit for KMO result is 0.50. If the KMO is higher than the point of 0.50, data is a set of variables which have homogeneity and correlation between them. Bartlett’s test shows inter-correlation between variables (Hair, 2006). Result of Bartlett’s test, p, should be lower than the result of 0.05.
3.3 KMO, Bartlett’s Test of Sphericity and Factor Analysis Results of Consumer Types
For designing the factors, related questions of the survey were analyzed. Results (KMO=0.69, χ2 Bartlett’s test=1534,81 and p=0,00) show us that appropriateness
of the data is enough for the factor analysis.
Table 3.3.1. KMO, Bartlett’s Test Results of Consumer Types
KMO (Kaiser-Meyer-Olkin Measure) 0,69
Bartlett’s Test of Sphericity
χ2 1534,81
df 465
After checking necessary assumptions, factor analysis was conducted. Analysis resulted with several factors which have eigenvalues over one. These factors were retained. The items which have factor loadings lower than the 0.50 and high cross loadings were excluded. Scree plot graphic in the SPSS shows that 6th point is the place where the curve is leveling off. In the light of this information, five number of factors (Facilitator, Poser, Explorer, Experience Seeker, and Professional/Hobbyist) are designated for the research. After this stage, exploratory factor analysis is repeated and Varimax rotation method was used for minimizing the number of variables which have high loadings about each factor. According to results of the factor analysis, some items were excluded because of the cross loadings and factor loadings results. According to Comrey and Lee (1992), factor loadings higher than 0.71 is excellent, between 0.71 and 0.63 is very good, between 0.63 and 0.55 is good, between 0.55 and 0.45 moderate, and between 0.45 and 0.32 is explained as weak. For this research, factor loading of 0.55 is assigned for the designation process. Five items were excluded one by one and factor analysis were repeated several times because excluding an item can affect other factor loadings. Results can be seen on the Table 3.3.2.
Table 3.3.2. Factor Analysis of Consumer Types
Items
Factor 1 Factor 2 Factor 3 Factor 4 Factor 5 Facilitator Professional/ Hobbyist Poser Experience Seeker Explorer Q18 .878 Q15 .872 Q16 .844 Q17 .842 Q20 .805 Q19 .715 Q23 .842 Q24 .836 Q22 .807 Q21 .728 Q30 .682 Q32 .676 Q31 .626 Q34 .791
Q39 .758 Q38 .583 Q36 .556 Q26 .806 Q27 .735 Q37 .670 Q29 .609 Q12 .866 Q11 .860 Q14 .711 Eigenvalues 5.82 4.04 3.67 2.23 1.92 Variance explained (%) 22.37 15.53 12.95 8.57 7.40
According to results, Facilitator has six, Poser has seven, Professional/Hobbyist has seven, Experience Seeker has four, and Explorer has three items. Factor loadings of Facilitator were found between 0.878 and 0.715, Poser’s factor loadings were found between 0.791 and 0.556, Professional/Hobbyist’s factor loadings were found between 0.842 and 0.626, Experience Seeker’s factor loadings were found between 0.806 and 0.609, and Explorer’s factor loadings were found between 0.866 and 0.711. Eigenvalue and Variance Explained are 5.82 (22.37%) for Facilitator, 3.67 (12.95%) for Poser, 4.04 (15.53%) for Professional/Hobbyist, 2.23 (8.57%) for Experience Seeker, and 1.92 (7.40%) for Explorer. Cumulatively, five factors’ total variance is 66,83%.
For measuring the reliability, Cronbach Alfa internal consistency results were found. According to Tavşancıl (2005), reliability coefficient 0.7 and higher can be acceptable. Findings show us that consistency and internal consistency of the set is reliable.
Table 3.3.3. Cronbach Alfa Results of Consumer Types
Factors N of Items Cronbach Alfa
Facilitator 6 0.91
Poser 6 0.81
Professional/Hobbyist 7 0.88
Experience Seeker 4 0.74
TOTAL 26 0.83
3.4. Descriptive Statistics
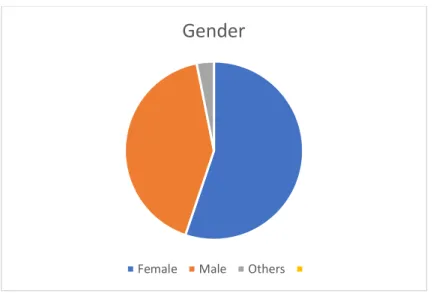
3.4.1. Gender
Three different gender groups were found. Respondents’ 55.2% are female, 41.7% are male, and 3.1% are defined as others.
Table 3.4.1.1. Frequency of Gender
Frequency Percent
Gender
Female 53 55.2
Male 40 41.7
Others 3 3.1
Figure 3.4.1.1. Gender Pie Chart
3.4.2. Educational Level
In the survey, there are respondents who have different educational levels. 4.2% of the participants are high school graduates, 66.7% of the participants are BA
Gender
graduates, 22.9% of the respondents are MA graduates, and 6.3% of the participants are PhD graduates.
Table 3.4.2.1. Frequency of Educational Level
Frequency Percent Educational Level High School 4 4.2 BA 64 66.7 MA 22 22.9 PhD 6 6.3
Figure 3.4.2.1 Educational Level Pie Chart
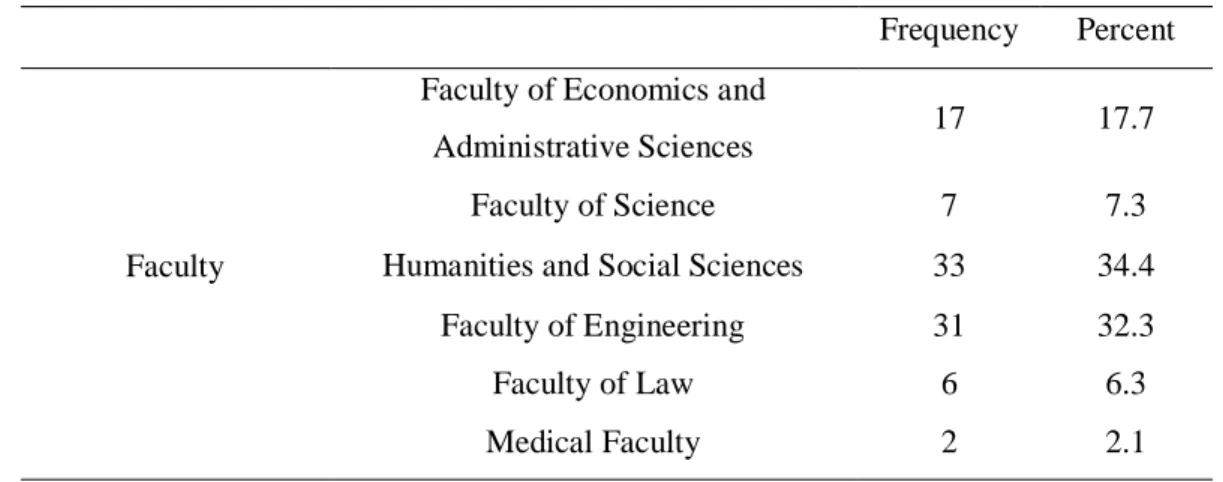
3.4.3. Faculty of Education
In the survey, there are respondents who have different educational paths. 17.7% of the participants come from Faculty of Economics and Administrative Sciences, 7.3% of them come from Faculty of Science, 34.4% of them come from Humanities and Social Sciences, 32.3% of them come from Faculty of Engineering, 6.3% of them come from Faculty of Law, and 2.1% of them come from Medical Faculty.
Educational Level
Table 3.4.3.1. Frequency of Faculty of Education
Frequency Percent
Faculty
Faculty of Economics and
Administrative Sciences 17 17.7 Faculty of Science 7 7.3 Humanities and Social Sciences 33 34.4
Faculty of Engineering 31 32.3
Faculty of Law 6 6.3
Medical Faculty 2 2.1
Figure 3.4.3.1. Faculty of Education Pie Chart
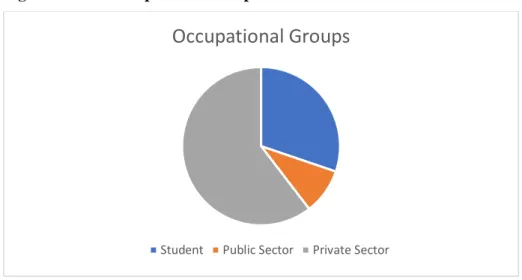
3.4.4. Occupational Groups
In the survey, there are respondents who work in different occupational groups. 30.2% of the participants are students. 9.4% of the participants work in public sector
Educational Paths (Faculties)
Faculty of Economics and Administrative Sciences Faculty of Science
Humanities and Social Sciences Faculty of Engineering Faculty of Law Medical Faculty
Table 3.4.4.1. Frequency of Occupational Groups Frequency Percent Occupational Group Student 29 30.2 Public Sector 9 9.4 Private Sector 58 60.4
Figure 3.4.4.1. Occupational Group Pie Chart
3.4.5. Income Level
In this survey, there are participants who have different income levels. 4.2% of the participants have earned less than 1600TL, 10.4% of the participants have an income level between 1600TL and 2000TL, 25% of the participants have an income level between 2001TL and 4000TL, 31.2% of the participants have an income level between 4001TL and 8000TL, 15.6% of the participants have an income level between 8000TL and 12000TL, and 13.5% of the participants have earned more than 12001TL.
Table 3.4.5.1. Frequency of Income Level
Frequency Percent
Income Level Less than 1600TL 4 4.2
1600TL-2000TL 10 10.4
Occupational Groups
2001TL-4000TL 24 25
4001TL-8000TL 30 31.2
8000-12000TL 15 15.6
More than 12001 13 13.5
Figure 3.4.5.1. Income Level Pie Chart
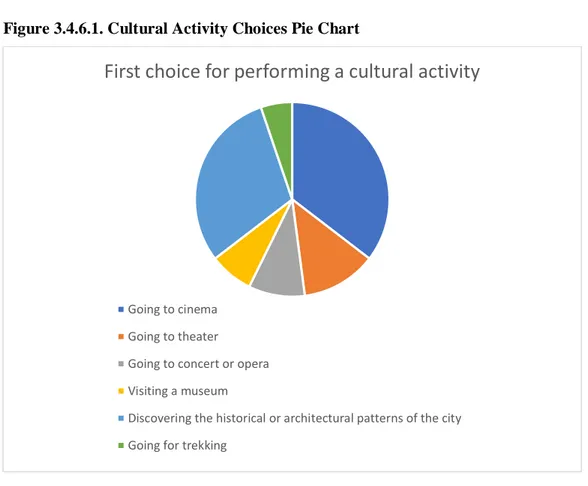
3.4.6. Cultural Activity Choices
In this survey, a question which is about consumer’ s first choice for performing a cultural activity was asked. There are participants who have different decisions about this question. 35.4% of the participants selected the cinema option, 12.5% of the participants selected the theater option, 9.4% of the participants selected the concert or opera option, 7.3% of the participants selected the museum option, 30.2% of the participants selected the discovering the historical or architectural patterns of the city option, and 5.2% of the participants selected the trekking option. We can see that cinema and discovering the historical or architectural patterns of the city options are more preferred activities than visiting a museum. All participants that analyzed in this study performed a museum visit recently. However, results show us that visiting a museum is a first choice only for 6.8% of them. From this perspective, competitors of the museums in the market are not only
Income Level
Less than 1600TL 1600-2000TL 2001-4000TL
other museums. These results can be accepted as a useful insight for understanding the consumers.
Table 3.4.6.1. Frequency of Cultural Activity Choices
Frequency Percent
10-First choice for performing a cultural
activity
Going to cinema 34 35.4 Going to theater 12 12.5 Going to concert or opera 9 9.4
Visiting a museum 7 7.3 Discovering the historical or
architectural patterns of the city 29 30.2 Going for trekking 5 5.2
Figure 3.4.6.1. Cultural Activity Choices Pie Chart
First choice for performing a cultural activity
Going to cinema Going to theater Going to concert or opera Visiting a museum
Discovering the historical or architectural patterns of the city Going for trekking
3.4.7. Consumer Types Descriptive Statistics
Respondents tendency about factors can be seen on the Table 3.4.7.1. Found results are 3.45±0.93 (Facilitator), 3.10 ±0.78 (Poser), 3.12±0.98 (Professional/Hobbyist), 3.23±0.88 (Experience Seeker), and 4.05±0.74 (Explorer) for the factors. According to results, respondents have moderate tendency about Poser, Professional/Hobbyist, and Experience Seeker factors. On the other hand, respondents have strong tendency about Facilitator and Explorer factors.
Table 3.4.7.1. Consumer Types Mean and Std. Deviation Results
Factors N Minimum Maximum Mean Std.
Deviation Level
Facilitator 96 1.00 5.00 3.45 0.93 Strong Poser 96 1.00 4.83 3.10 0.78 Moderate Professional/Hobbyist 96 1.14 4.86 3.12 0.98 Moderate Experience Seeker 96 1.00 5.00 3.23 0.88 Moderate Explorer 96 2.67 5.00 4.05 0.74 Strong
3.5 Explanation for the Data Analysis
Further data analysis which is explained in this research is based on correlations. There are several statistical methods to find correlations, for example linear regression, co-variation, and analysis of correlation. In the majority of conducted research in the field, it can be seen that multiple regression analysis is the desired method. However, the insights which are targeted to reach with help of this analysis should not be grouped like “effect of physical environment on consumers” because the aim is finding insights like effect of interior design before, during, and after the visit periods according to factors. Even if the findings of grouped questions are statistically meaningful, the insights can be limited or misleading. Therefore, the rest of the data is analyzed with Pearson Correlation method to find meaningful correlations between factors and asked matters with questions one by one. In this
specific subjects, and perspective of value co-creation can be set up on museum related issues.
The coefficient result varies from -1 to +1. If r=0, there is no linear relation between parameters. If r > 0, there is a positive correlation between parameters. If r < 0, there is a negative correlation between parameters. For having a meaningful-significant result, p number should be p < 0.05. The symbol of “*” indicates p < 0.05, and the symbol of ”**” indicates p < 0.01. If r is between 0 and 0.29, correlation is weak. If r is between 0.30 and 0.69, correlation is moderate. If r is between 0.70 and 1.0, correlation is strong. This scale works with both way, negative or positive (Çokluk et al, 2012).
3.6. Pearson Correlation Analysis and Interpretations
3.6.1. Participation in Cultural Activities
H1: Different consumer types differ in the frequency of participation in cultural activities.
Table 3.6.1.1. Pearson Correlation Results of Consumer Types with Questions from Seven to Nine H1-H2-H3 Facilitator Poser Professional/ Hobbyist Experience Seeker Explorer 7-Participation in cultural activities -0.043 0.012 0.125 -0.305** 0.149 8-Knowledge level of
art, history, and science -0.057 -0.064 0.704
** -0.201 0.186
9-Effort to increase level of knowledge about art, history, and science
-0.124 -0.023 0.217 -0.360** 0.202
Question seven, how often do you prefer to participate in cultural activities, is asked to the respondents. This matter is about prior interest of the visitor which is mentioned in the contextual model of learning. Experience Seeker factor has a significant negative moderate correlation (r= -0.305**) with participation frequency. Therefore, H1 is accepted as a partially corrected hypothesis.
3.6.2. Knowledge level of Art, History, and Science
H2: Different consumer types differ in the level of knowledge about art, history, and science.
The meaningful correlation result between the factors and knowledge level of respondents about art, history, and science is found for Professional/Hobbyist factor. The question is about the personal dimension’s prior knowledge aspect. Professional/Hobbyist factor has a positive strong correlation (r= 0.704**) with the knowledge level. Therefore, H2 is accepted as a partially corrected hypothesis. When level of knowledge increase, tendency of being Professional/Hobbyist increase as well. Theoretically, Professionals/Hobbyists possess strong knowledge about the content (John H. Falk, 2006). Data analysis supports this theory.
3.6.3. Effort to Increase Level of Knowledge About Art, History, and Science
H3: Different consumer types differ in the effort of increasing level of knowledge about art, history, and science.
The meaningful correlation result between the factors and effort to increase level of knowledge is found for Experience Seeker factor. Experience Seeker factor has a negative moderate correlation (r= -0.360**) with increasing the level of knowledge. Therefore, H3 is accepted as a partially corrected hypothesis.
Experience Seeker factor’s negative correlation with the effort of increasing level of knowledge can be accepted as an insight about the prior knowledge of the consumers. The correlation cannot explain their level of prior knowledge, it can only be an insight. Also, a question cannot explain what they know and what they
meaningful. Therefore, insight that Experience Seekers have limited tendency about knowledge can be emphasized.
3.6.4. No Time to Research
H4: Different consumer types differ in the reason of not doing research because of the time allocation.
The meaningful correlation result between factors and the reason of having no time to research before visiting a museum is found for Experience Seeker factor. Experience Seeker factor has a positive moderate correlation (r= 0.384**) with having no time to research. Therefore, H4 is accepted as a partially corrected hypothesis.
Research before visiting the museum can be explained as a pre-learning process. According to correlation results, Experience Seekers’ reason for skipping this process before visiting the museum is based on allocating time.
3.6.5. Having Enough Knowledge
H5: Different consumer types differ in the reason of not doing research because of the prior knowledge.
The meaningful correlation result between factors and the reason of having enough knowledge to not doing a research before visiting a museum is found for Professional/Hobbyist factor. The question is about the contextual model of learning’s prior knowledge of personal dimension. Professional/Hobbyist factor has a positive moderate correlation (r=0.584**) with this reason. Therefore, H5 is accepted as a partially corrected hypothesis.
Professional/Hobbyist factor has a positive strong correlation (r= 0.704**) with knowledge level. When level of knowledge increases, tendency of being a Professional/Hobbyist also increases. If we interpret both results together, we can see the connection between knowledge and Professionals/Hobbyists.
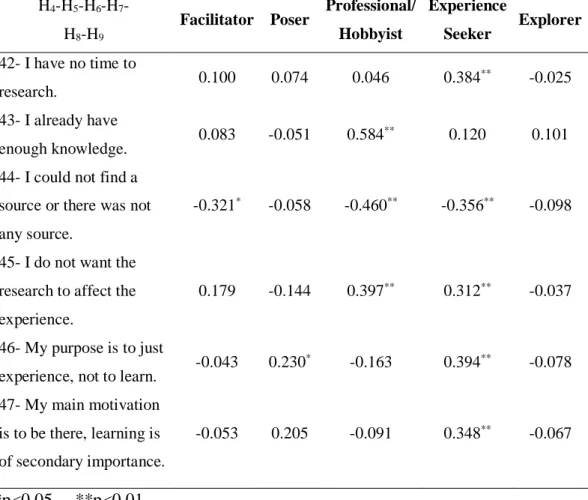
Table 3.6.5.1. Pearson Correlation Results of Consumer Types with Questions from Forty-two to Forty-seven
Before you visit the museum, if you haven’t done detailed research about the exhibits; how much do the following reasons explain the reason for it?
H4-H5-H6-H7-
H8-H9
Facilitator Poser Professional/ Hobbyist Experience Seeker Explorer 42- I have no time to research. 0.100 0.074 0.046 0.384 ** -0.025 43- I already have enough knowledge. 0.083 -0.051 0.584 ** 0.120 0.101
44- I could not find a source or there was not any source.
-0.321* -0.058 -0.460** -0.356** -0.098
45- I do not want the research to affect the experience.
0.179 -0.144 0.397** 0.312** -0.037
46- My purpose is to just
experience, not to learn. -0.043 0.230
* -0.163 0.394** -0.078 47- My main motivation is to be there, learning is of secondary importance. -0.053 0.205 -0.091 0.348** -0.067 *p<0.05 **p<0.01
3.6.6. Could Not Find a Source for Information
H6: Different consumer types differ in the reason of not doing research because of the information sources.
Could not finding a source as a reason for not doing a research and factors have meaningful correlations. Facilitator factor has a negative moderate correlation 0.321*), Professional/Hobbyist factor has a negative moderate correlation 0.460**), and Experience Seeker factor has a negative moderate correlation (r=-0.356**) with the asked reason. Therefore, H6 isaccepted as a partially corrected