Application of tqm in the construction industry of developing countries - case of Turkey
Tam metin
Şekil
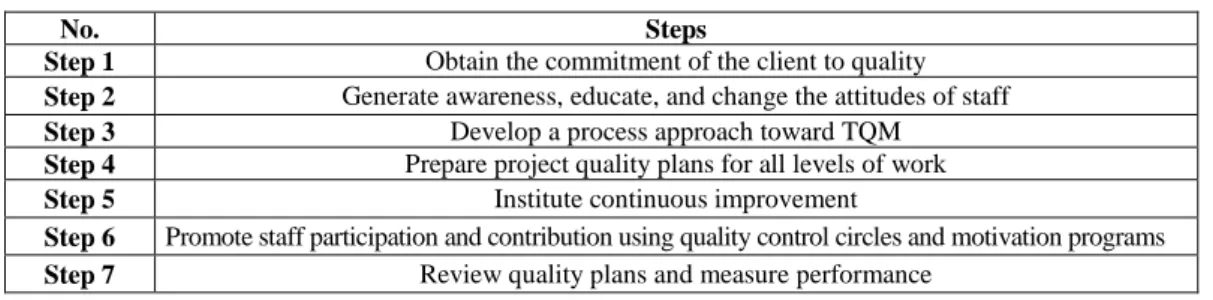
![Figure 1. The TQM pyramid [7]](https://thumb-eu.123doks.com/thumbv2/9libnet/4142891.63260/3.892.258.629.441.713/figure-the-tqm-pyramid.webp)

Benzer Belgeler
Second action programme (1984-1988): concentrated on safety, ergonomics, health, hygiene, information, training, and initiatives of SMEs. 2013-2020 programme: a change of
In the previous chapter, the literature review was finished through journals, related thesis sample, internet survey and construction management books. By observing this
Therefore, questionnaire survey and interviews were selected as the research method in order to collecting information and then the application of Probability and impact
From your experience, please express your opinion on the importance of the following factors as key performance indicators of construction projects in Jordan. (Please tick
The application of the framework in LCI and the analysis of the survey responses have resulted an identification of twenty one stakeholders involved in Libyan
Awareness in order to take actions to avoid on-site C&D waste generation Motivation to reuse or recycle the generated C&D waste on-site Training concerning
Makalemizde Hatay’ın İskenderun ilçesine bağlı Karaağaç beldesinde yaşamını sürdüren Arap Alevilerinin ölüm inançları, cenaze uygula- maları, defin işlemleri,
Bu konuda McLuhan’ın (2001) mekanik dönemde bedenimizin bizi götürdüğü yere kadar gidebilirken, artık elektronik dönmede, vücudumuzu saran sinir sistemimiz
