Journal of Micromechanics and Microengineering
PAPER
Flexible strain sensors based on electrostatically
actuated graphene flakes
To cite this article: Somayeh Fardindoost et al 2015 J. Micromech. Microeng. 25 075016
View the article online for updates and enhancements.
Related content
Low tension graphene drums for electromechanical pressure sensing
Raj N Patel, John P Mathew, Abhinandan Borah et al.
-Electromechanical resonator based on electrostatically actuated graphene-doped PVP nanofibers
S Fardindoost, S Mohammadi, A Iraji zad et al.
-Mechanical and electromechanical properties of graphene and their potential application in MEMS
Zulfiqar H Khan, Atieh R Kermany, Andreas Öchsner et al.
-Recent citations
Noninvasive Scanning Raman Spectroscopy and Tomography for Graphene Membrane Characterization
Stefan Wagner et al
-A review on in situ stiffness adjustment methods in MEMS
M L C de Laat et al
Somayeh Fardindoost1, Akbar Alipour2, Saeed Mohammadi3,
Sayim Gokyar2, Reza Sarvari4, Azam Iraji zad1,5 and Hilmi Volkan Demir2,6
1 Institute for Nanoscience and Nanotechnology, Sharif University of Technology, Azadi Street, Tehran
11155–8639, Iran
2 Department of Physics, Department of Electrical and Electronics Engineering, and UNAM—Institute of
Materials Science and Nanotechnology, Bilkent University, Ankara 06800, Turkey
3 Stanford Center for Cancer Nanotechnology Excellence, Stanford School of Medicine, Department of
Radiology, Stanford University, Palo Alto, CA 94305, USA
4 Department of Electrical Engineering, Sharif University of Technology, Azadi Street,
Tehran 11365–9161, Iran
5 Department of Physics, Sharif University of Technology, Azadi Street, Tehran 11365–9161, Iran 6 LUMINOUS! Center of Excellence for Semiconductor Lighting and Displays, Microelectronics
Division, School of Electrical and Electronics Engineering, and Physics and Applied Physics Division, School of Physical and Mathematical Sciences, Nanyang Technological University, Nanyang Avenue 639798, Singapore
E-mail: [email protected] and [email protected]
Received 16 January 2015, revised 24 April 2015 Accepted for publication 27 April 2015
Published 8 June 2015 Abstract
In this paper we present flexible strain sensors made of graphene flakes fabricated, characterized, and analyzed for the electrical actuation and readout of their mechanical vibratory response in strain-sensing applications. For a typical suspended graphene membrane fabricated with an approximate length of 10 µm, a mechanical resonance frequency around 136 MHz with a quality factor (Q) of ~60 in air under ambient conditions was observed. The applied strain can shift the resonance frequency substantially, which is found to be related to the alteration of physical dimension and the built-in strain in the graphene flake. Strain sensing was performed using both planar and nonplanar surfaces (bending with different radii of curvature) as well as by stretching with different elongations.
Keywords: graphene electromechanical resonator, strain sensing, flexible sensor (Some figures may appear in colour only in the online journal)
1. Introduction
The field of nanoelectromechanical systems (NEMS) is moving toward mechanical devices with critical dimen-sions in the submicrometer range [1–5]. Recent studies have shown that graphene as a two-dimensional (2D) atomically thin material can opportunely be utilized in NEMS systems in the megahertz regime [1–4]. For NEMS, graphene exhibits promising electrical and mechanical properties including high stiffness, high carrier mobility, and low mass, which together make it well suited for various types of sensors [6]. Also, the winning advantages of graphene’s exceptional mechanical
flexibility and reversibility make it an excellent candidate in the field of strain sensors. Strain sensors have been intro-duced in different fields of research from civil engineering [7] to health monitoring [8]. They are important for identifying any deterioration or deformation from civil infrastructure (e.g. bridges and buildings) and internal healing processes (such as bone fracture) [9]. There are several previous reports on the investigations of how strain affects graphene (e.g. via Raman mapping to observe the disruption of graphene sym-metry and the band gap opening, and by scanning tunneling microscopy (STM) to observe pseudomagnetic quantum Hall effects) [10]. The applied strain on the graphene sheet leads to
electrostatically actuated graphene flakes
S Fardindoost et al Printed in the UK 075016 jmm © 2015 IOP Publishing Ltd jmm 0960-1317 10.1088/0960-1317/25/7/075016
Papers
7S Fardindoost et al
2
a significant elongation, which distorts the hexagonal honey-comb crystal structure and shifts its electronic band structure, thereby increasing its band gap and thus its resistance [11]. In this report, we are interested in showing the feasibility and assessing the capabilities of graphene-based flexible nano-electromechanical systems (GNEMS) for strain sensing. To the best of our knowledge, this is the first account of strain sensing based on GNEMS on a flexible Kapton substrate. In the first part of this work, we study the mechanical resonance parameters of the graphene flake by employing electrical actuation and readout. Here, for a typical graphene resonator fabricated with a suspended length of approximately10 µm and width on the order of 1 mm, we observed a resonance fre-quency around 136 MHz with a quality factor (Q) of 60 in air under ambient conditions.
The second part of this paper presents the strain sensing of the suspended flake on nonplanar surfaces with varying radii of curvature (from planar to the severely bent case). In the case of using strain sensors on non-flat surfaces and accom-modating larger mechanical deformation, a flexible sensor made on Kapton tape was prepared. Here, the suspended gra-phene can eliminate the undesired adverse influence of any graphene–substrate interactions for strain sensing. Response to the applied strain is probed by observing the shift in resonance frequency. Similarly, a shift in the resonance fre-quency was also induced by stretching the graphene sample. This shifting confirms the mechanical vibratory origin of the response as well as the possibility of GNEMS use for sensing applications. This 2D nanostructure holds great promise for future sensing array applications because of its electrome-chanical functionalities, reduced size, and low cost.
2. Fabrication and structural characterization 2.1. Sensor design
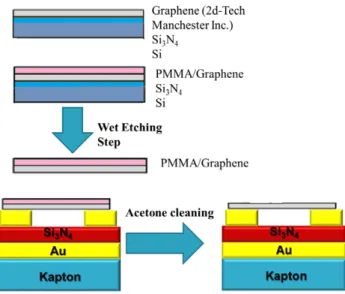
In this study, we prepared suspended graphene flakes actuated using electrostatic force. The Kapton tape was chosen as a flexible substrate. As shown schematically in figure 1, due to high electrical resistivity of the Kapton tape, a uniform gold film was first deposited by thermal evaporation, which was then followed by plasma-enhanced chemical vapor deposition (PECVD) of a 100 nm thick Si3N4 film as the dielectric layer.
Finally a 5 × 5 mm array of gold rectangular trenches with 10 µm width and interspacing and a thickness of 100 nm was
patterned onto the Kapton/Au/Si3N4 layered films using
tradi-tional microfabrication processes.
Then a large graphene flake (1 × 1 mm2) on Si 3N4/Si
wafer, commercially available from 2-dtech Inc. (Manchester, UK), was transferred onto the prepatterned gold electrodes following the technique reported in [12] and shown schemati-cally in figure 2.
2.2. Structural analysis
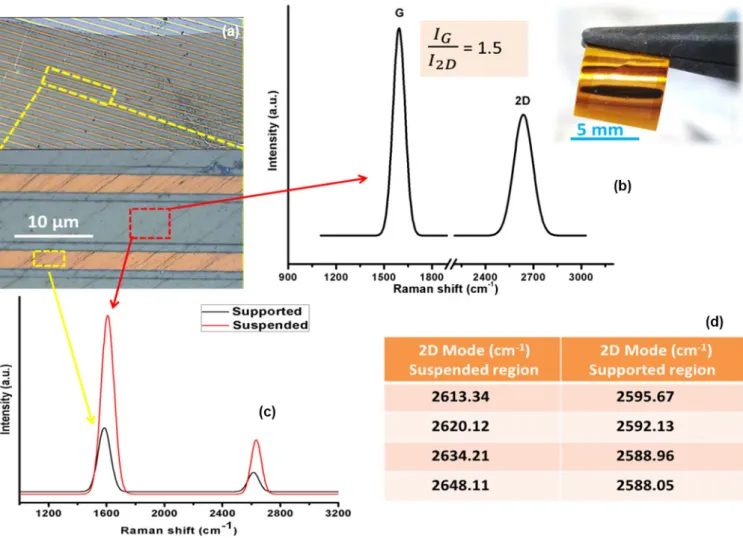
The proper placement of the graphene flake was observed by optical microscopy and confirmed by Raman spectroscopy. As can be seen from the optical microscopy image (figure 3(a)), the large graphene flake has a relatively smooth surface with some ripples due to the applied strain while it was transferred over the electrodes. Here, due to Van der Waals forces, the gra-phene flake is contacted strongly to the Au electrodes [10] and suspended and bridged over the gap distances. We considered a model of a series of double-clamped graphene membranes with a rectangular shape, each with a length of 10 µm and 100 nm spacing from the substrate. Raman spectroscopy is one of the most frequently used techniques based on light scat-tering for investigation of 2D hexagonal crystal structure of carbon atoms in graphene. In graphene research, Raman spec-troscopy is widely used for identifying the number of layers as
Figure 1. The schematic (left) and the real structure (right) of patterned Au contacts.
Figure 2. Schematic for transferring and suspending a graphene flake over Au contacts.
well as probing mechanical, electrical, and optical properties [13]. Here a WITEC Alpha300R scanning confocal Raman system with an excitation 532 nm laser was used to perform the Raman experiment. Figure 3(b) shows Raman spectra recorded on the suspended portion of the graphene sample. As can be seen in these figures, the location (2648.1 cm−1) and full width at half-maximum (FWHM) (100 cm−1) of the 2D Raman peak were obtained. Also, the intensity ratio of the G-peak over the 2D peak, (IG/I2D) was found to be 1.5, which
corresponds to four layers of graphene sheets. This error is caused by ripples in the flake due to transferring process [11].
In addition Raman spectroscopy is an effective technique to show the presence of strain on graphene [13]. Comparison of the recorded 2D-mode of both the suspended and supported portions revealed that there is a downshifting observed for the supported regions, which arises from the strain induced by the substrate (figure 3(c)). In addition, the integrated intensity of the 2D mode is enhanced for the suspended part compared to the supported region. On the supported portion of the sample, the data are more widely scattered, which is in agreement with the previous reports of measurements on several different suspended graphene flakes [13–16]. With regard to D-mode, which reflects the defect and disorder density, however, no disorder is observed for either the suspended or the supported
parts. As reported in [10], even within the same piece of gra-phene, the frequency of the 2D Raman mode could differ from one region to the other, so in figure 3(d), we present the values of 2D modes for different spots on both the suspended and supported regions of the graphene sample.
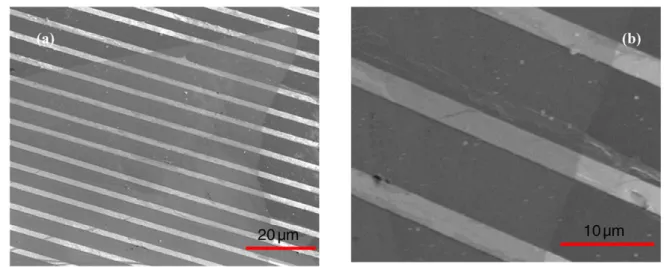
The scanning electron microscopy (SEM) images from the edges of the flake (figures 4(a) and (b)) were taken after several strain-sensing performances. We tried to visualize the cross section of the flake in contact with Au, but due to the small distance (<100 nm) and Si3N4 dielectric, there was a
huge charging effect which made it impossible.
3. Results and discussion 3.1. Measuring mechanical resonance
The graphene sample was actuated by the potential differ-ence between the graphene sheet and the gold-coated Kapton substrate. A dc voltage was applied to the gate electrode to adjust the tension in the sheet. An RF voltage was used to set it into motion at frequency f . All the measurements were car-ried out under the environmental conditions and the frequency response was measured by an Agilent E5061B Network Analyzer. As explained above, the resonators were driven into
Figure 3. Optical microscopy image of the suspended graphene flake sensor (a), Raman spectrum of the suspended region (b), and comparison of Raman spectra of the suspended and supported regions (c and d).
S Fardindoost et al
4
motion using an electrostatic actuation scheme. We performed a calibration to establish the sensor’s baseline transmission spectra without any applied bias potential. Transmission spectra were normalized relative to this reference spectrum to eliminate the effect of parasitic capacitance. We consider a model of series of double-clamped graphene membranes with a rectangular shape, each with a length of 10 µm and a 100 nm spacing from the substrate as shown in figure 3(a).
A direct electrical detection method is used for the readout. Figure 5(a) shows the mechanical resonance and phase response for one of the measured GNEMS at ambient condi-tions at Vdc = 10 V and Vac = 0 dBm. The motional contribution
of the flake is detected by measuring the ratio of the output RF power of the device to the RF power applied by network analyzer. Due to 50 Ω drive and detection impedances at the output and input ports of the network analyzer, the electrome-chanical impedance (Zm) of the flake can be extracted from
equation (1): = Ω +Ω V V Z 50 50 out in m (1) An equivalent electrical model—the Butterworth–van Dyke (BVD) model—is suitable for extracting the equivalent electrical parameters that lead to the correct evaluation of the
quality factor (Q), as shown in figure 5(b). With the extracted parameters, Cm, Lm, and Rm, the respective value of Q in air
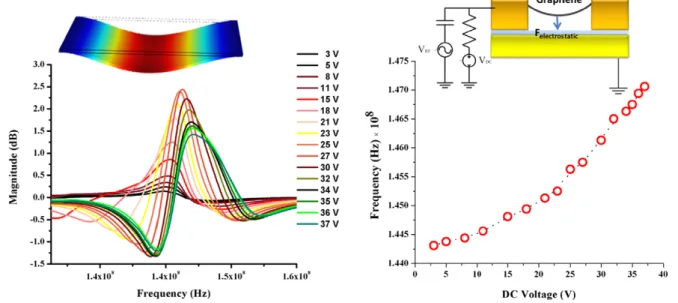
is obtained from equation (2) to be approximately 62 for one of the devices. ω = Q L R m m (2) The dependence of S21 on the applied dc shows the stiffening effect due to the applied tension in the graphene membranes (figures 6(a) and (b)). As a very thin membrane, an applied strain due to deformation and electrostatic attrac-tion toward the substrate can tune the frequency of resonance. The strain built up with increasing Vdc can shift up the
reso-nance frequency, which is observed for our graphene sample because of the stiffening effect and also reported by [1–4]. At a given Vdc (bias voltage) and z (static equilibrium position),
the spring constant can be given by ε
= + −
k 16EW /3L 256EWz2/3L3 1/2 ¨CV dc2
(3) where W is the width of the flake and C is the capacitance of electrostatic actuator. The first term in (3) represents the graphene’s natural mechanical resonance and the second term gives the stiffening due to the increasing strain with increasing
Figure 4. SEM images of suspended graphene flake over the Au contacts.
Figure 5. The measured frequency response and phase plots of one of the devices in air for Vdc = 10 V (a) and the extracted electrical
equivalent circuit of a graphene flake (b). J. Micromech. Microeng. 25 (2015) 075016
z. The third term reflects the nonlinearity of the electrostatic force, which results in the spring constant softening.
3.2. Strain-sensing results
Here the direct electrical strain sensing of the suspended gra-phene sample on the flexible Kapton tape is demonstrated. The flexibility of the sensor results in experiencing much more strain and accommodating large mechanical deforma-tion for a given applied strain. Also, suspending the graphene can eliminate the influence of any graphene-substrate interac-tions while strained. For the small strain responses, the sensor was affixed and wrapped on nonplanar surfaces with different radii of curvature (figure 7(a) inset). The electrostatic field is orthogonal to the graphene flake and the applied strain is in the parallel direction. The applied elongation deforms the sensor, producing dimensional alterations, and subsequently changes the sensor’s resonance frequency. With increasing applied load (achieved by decreasing the radius of curvature),
the physical dimension changes, and the resonance frequency is further reduced to the lower values.
In addition, multicycle operation of the other sample between the two states of the planar and nonplanar configu-rations (approximately 1% strain) is presented in figure 7(b). As shown, the response shows stability when repeating the measurements 20 times. After removing the strain, these sen-sors are immediately recovered to their unstrained state as a result of the graphene’s high elasticity. The small differences between the first cycle in unstrained state and the relaxed one for the rest cycles might be due to the residue of the strain in the flexible Kapton substrate which can also affect the gra-phene flake.
In the above setup, the maximum obtainable applied strain was about 4%. So, to achieve higher strain and measure the sensors’ responses at higher applied strain, we also tried elon-gating the suspended graphene sample by holding stages. As shown inset in figure 8, we used two thin clamps at the ends of the sensor to fix it. An adjustable screw was used to modify
Figure 6. The dependence of dc electrical conductance of the graphene flake sensor as a function of the gate dc bias (Vg) measured at room
temperature (a) and the frequency shift of a resonating graphene flake as a function of the gate voltage (b).
Figure 7. The strain dependence of the resonance frequency of the graphene flake sensor on a nonplanar surface (inset) as a function of the radius of curvature (a) and multicycle operation of the device between the two states (b).
S Fardindoost et al
6
the applied load. When a force was applied by turning the screw with a 1 mm pitch distance, it elongated the sensor as displayed schematically inset in figure 8.
When a force is applied to the sensor, it creates strain, which can be calculated from ε = ΔL L/ , where L represents the length of the sensor. The strain shifts the resonance fre-quency as a result of dimensional alterations or deformation of the sensor’s resonating area. The resonance frequency shifted (Δ ≈f 3.5 MHz) when the strain was increased from 7 to 13, to 20, to 27%. The shift in resonance frequency as a function of the applied strain (figure 8) can be divided into two different regions according to equation (4):
ρε = f L E 1 2 . (4) The frequency was first reduced at lower strain, which could be explained by the dominant effect of L in (4) as physical dimension changes. By further increasing the strain, the reso-nance frequency was later increased. The frequency increase is attributed to the dominant role of ε in (4), which reflects the stiffening of the resonator. By turning the screw twice (2 mm elongation), due to high stretch in the Kapton substrate, it was torn. Therefore we were unable to apply strains greater than 27%. The measurement was repeated using another strain-sensing stage used in a previous study by our group [9]. By applying a point load in the middle of the graphene sample via a screw, we mechanically deformed the sensor. As a result, the same trend in the frequency response of graphene flake under strain was observed. This is a confirmation of our observa-tion with regard to the GNEMS behavior under applied strain. Also, considering the SEM images of the flakes before and after mechanical testing and also the reproducibility of the data during strain measurements (figure 7(b)), we are satis-fied that the devices are stable and no peeling or tearing issues occur after mechanical testing.
Piezoelectrical graphene-based strain sensors have reported recently with high capabilities to be used instead of silicon-based strain sensors [11]. Our present study focuses on developing a GNEMS strain sensor with high sensitivity, lin-earity, and stability in its frequency responses. In addition, the
electromechanical coupling, transparency, and high stability of the graphene-based strain sensor make it a good candidate to be used in touch screens, artificial skins, and other electrical devices [17, 18]. The strain sensing based on GNEMS of flex-ible substrates, as demonstrated here for the first time, holds great promise for these applications, which is the future work of our team.
4. Conclusion
In this study, we present an electromechanical resonator for strain sensing based on suspending and electrostatically exciting a graphene flake. As a proof-of-concept demonstra-tion, the graphene flake was suspended at a 10 µm distance on a flexible (Kapton) substrate. Our results show that a good sensitivity can be obtained by using graphene-flake sensors due to their relatively high compliance. It is discussed that the greater mechanical deformation experienced by the flexible substrate provides higher sensitivity. The good sensitivity and reversibility of graphene-based strain sensors obtained in the current study demonstrate their efficacy for use in biocompat-ible real-life applications.
References
[1] Chen Ch and Hone J 2013 Graphene nanoelectromechanical systems Proc. IEEE 1011766–79
[2] Chen Ch, Rosenblatt S, Bolotin K I, Kalb W, Kim Ph, Kymissis I, Stormer H L, Heinz T F and Hone J 2009 Performance of monolayer graphene nanomechanical resonators with electrical readout Nat. Nanotechnology 4861–7
[3] Xu Y, Chen Ch, Deshpande V V, DiRenno F A,
Gondarenko A, Heinz D B, Liu Sh, Kim P and Hone J 2010 Radio frequency electrical transduction of graphene mechanical resonators Appl. Phys. Lett. 97243111
[4] Qiang L, Zeng-Guang Ch, Zhong-Jun L, Zhi-Hua W and Ying F 2010 Fabrication of suspended graphene devices and their electronic properties Chin. Phys. B 19097307
[5] Garcia-Sanchez D, van der Zande A M, San Paulo A, Lassagne B, McEuen P L and Bachtold A 2008 Imaging mechanical vibrations in suspended graphene sheets
Nano Lett. 81399–403
[6] Kumar B et al 2013 The role of external defects in chemical sensing of graphene field-effect transistors Nano Lett. 131962 − 8
[7] Farrar C R 2001 Historical overview of structural health monitoring Lecture Notes on Structural Health Monitoring
using Statistical Pattern Recognition, Los Alamos
Dynamics, Los Alamos, NM
[8] Stoffel K, Klaue K and Perren S M 2000 Functional load of plates in fracture fixation in vivo and its correlate in bone healing Injury 3137–50
[9] Melik R, Kosku Perkgoz N, Unal E, Puttlitz Ch and Demir H V 2008 Bio-implantable passive on-chip RF-MEMS strain sensing resonators for orthopaedic applications
J. Micromech. Microeng. 18115017
[10] Yu T, Ni Z H, Du C H, You Y M, Wang Y Y and Shen Z X 2008 Raman mapping investigation of graphene on transparent flexible substrate: the strain effect J. Phys.
Chem. C 112 12602–5
[11] Jing Zh, Guang-Yu Zh and Dong-Xia Sh 2013 Review of graphene-based strain sensors Chin. Phys. B 22 057701–9
Figure 8. The strain dependence of the resonance frequency of the graphene flake sensor as a function of different elongation lengths on a holding stage (inset).