HTSC SUPERCONDUCTING EDGE-TRANSITION
INFRARED DETECTORS; PRINCIPLES,
FABRICATION, AND CHARACTERIZATION
A THESIS
SUBMITTED TO THE DEPARTMENT OF ELECTRICAL AND ELECTRONICS ENGINEERING
AND THE INSTITUTE OF ENGINEERING AND SCIENCES OF BILKENT UNIVERSITY
IN PARTIAL FULFILLMENT OF THE REQUIREMENTS FOR THE DEGREE OF
MASTER OF SCIENCE
By
Rizwan Akram
9c
b \ L ·
I certify that I ha.vo read this thesis and that in my opinion it is fully ade(iuate, in scope and in (luality, as a thesis for the degree of Master of Science.
Assist. Prof. Dr. Mehdi Fardmanesh(Supervisor)
I certify that 1 ha.v(i read this thesis and that in my opinion it is fully ade(iuate, in scope and in (piality, as a thesis for the degree of Master of Science.
Assoc. Prof. Dr. Orhan Ankan
I certify that f ha.ve read this thesis and that in my opinion it is fully ade(iuate, in scope and in (luality, as a thesis for the degree of Master of Sci(!uce.
Approv(!(l for the Institute of Engineering and Sciences:
Prof. Dr. Mehrnet Bm^y
Director of Institute of Engineering and Sciences
ABSTRACT
HTSC SUPERCONDUCTING EDGE-TRANSITION
INFRARED DETECTORS; PRINCIPLES,
FABRICATION. AND CHARACTERIZATION
Rizwan Akram
M.S. in Electrical and Electronics Engineering
Supervisor; Assist. Prof. Dr. Mehdi Fardmanesh
January 2000
Since the discovery of High temperature superconductors, superconductivity became one of the fast emerging technologies being used in numerous applica tions ranging from large-scale to small-scale applications such as IR,-detectors. High temperature superconductors such as Y Bü'zCu íOj due to their properties are the prime candidates for the fabrication of detectors. Their responsivity and detectivity can be improved by changing the design and SC characteristics. In this thesis, one-dimensional thermal model has been considered to improve the characteristic parameters of the SC. Based on the model, the annealing profile and manufacturing process is modified to further enhance the respon sivity and detectivity of the detectors. A characterization setup is established to perform dc & ac measurements at low temperatures. In order to improve the cryogenic setu]), a thermal equivalent model for the system is also proposed.
ÖZET
HTSC SÜPERİLETEN AYRIT GEÇİŞLİ KIZILÖTESİ
SEZİCİLER: İLKELER, ÜRETİM VE KARAKTERİZASYON
Rizwan Akram
Elektrik ve Elektronik Mühendisliği Bölümü Yüksek Lisans
Tez Yöneticisi: Yrd. Doç. Dr. Mehdi Fardmanesh
Ocak 2000
Yüksek sıcaklık süperiletkenlerinin keşfinden beri, süperiletkenlik, kızılötesi seziciler gibi küçük öleçk uygulamalardan, büyük ölçekli uygulamalara kadar birçok alanda kullanılan önemli bir teknoloji haline gelmiştir. Uygun özellikelri nedeniyle, Y B a2C u i07 gibi yüksek sıcaklık süperiletkenleri, sezici üretiminde kullanılan malzemeler arasında birinci sıradadır. Uygun tasrımlarla ve süperiletken özellikerinin ayarlanmasıyla sezicilerin tepkisi ve sezicilik seviyesi geliştirilebilir.
Bu tezde, süperiletken parametrelerinin iyileştirilmesi amacıyla, tek boyutlu ısıl model ele alınmıştır. Bu modelle, sezici tepkisinin ve seziciliğinin arttırılması için, ısıtma/soğutma profili ve üretim işlemi uygun şekilde değiştirilmiştir. Düşük sıcaklıklarda DC ve Ac ölçümerinin yapılabildiği bir karakterizasj'^on düzeneği kurulmuştur. Ayrıca kriyogenik düzeneğini iyileştirmek için, sistemin bir ısıl-eşlenik modeli önerilmiştir.
Anahtar Kelimeler. Süperiletken, bolometre, kriyojenik sistem, SQUID.
ACKNOWLEDGMENTS
I would like to use this opportunity to express my deepest gratitude to Dr. Mehdi Fardmanesh for his supervision, guidance, suggestions and encourage ment throughout the development of this thesis.
I would also like to thank Assoc. Prof. Dr. Orhan Ankan and Prof. Dr. İrşadi Aksun for reading and commenting on the thesis.
I am intended to Murat Güre and Güngör Sincer from Plwsics Department for their assistance and also want to express my appreciation to Salim Ersen Baijar, Ergün Hırlaküğlu and Ismail Kir for their continuous help in establishing the electrical and the mechanical setup for data collection. I am also thankful to all my friends, inside and out of the department for their continuous support throughout the development of this thesis.
Finally, I am grateful to my family, especially my parents for their prayers. And deeply indebted to Dr. Fakhre Mahmood and his family for their relentless encouragement and moral support during my endeavors.
Contents
1 INTRODUCTION 1 2 SUPERCONDUCTIVITY: AN OVERVIEW 6 2.1 Review of superconductivity... C 2.1.1 Superconductive properties... 8 2.1.2 Theory of Superconductivity... 12 2.1.3 Magnetic Properties 302.2 HTSC physical and electrical properties, and the YBCO super conducting m aterial... 33
2.2.1 Overview of H T S C ... 33
2.2.2 Basic S tru ctu re... 36
2.2.3 R,esistance 38
2.2.4 M ag n etism ... 42
2.3 A pplications... 44
2.3.1 Introduction 44 2.3.2 Large-scale a p p lic a tio n s ... 45
2.3.3 Small-scale ap p licatio n s... 48
3 DETECTORS AND DETECTORS PARAMETERS 55 3.1 Infrared R a d ia ti o n ... 3.2 Detector Parameters 58 3.2.1 Responsivity... ... 58
3.2.2 N oise... ... 58
3.2.3 Signal to Noise R a tio ... ... 63
3.2.4 Noise Equivalent P o w e r ... ... 63 3.2.5 Specific D etectivity... ... 64 3.2.6 Dvnamic R a n g e ... ... 66 3.2.7 Spatial C onsiderations... ... 66 3.2.8 Cross T a lk ... ... 67 3.3 Detectors tv p e ... ... 68 3.3.1 Photon Detector 68
3.3.2 Thermal D etecto r... 70
3.4 HTSC Bolometers and the Thermal m o d e l... 82
3.5 Conclusion... 92
4 CRYOGENICS AND INSTRUMENTATION 4.1 In tro d u ctio n ... 4.2 Thermal Properties Consideration 94 94 95 4.2.1 Thermal Expansion . . 4.2.2 Thermal Conductivity . 4.2.3 Specific Heat ... 4.2.4 Electrical Analogous . . 4.2.5 Liciuid N itro g en ... 4.2.6 Temperature Sensors . . ... 100 ...102 ...102 ...104
4.3 Mechanical Setui) and the C ryogenics... 108
4.3.1 Introduction...108
4.3.2 Thermal modeling ... 109
4.3.3 Dewar d e s i g n ... 113
4.4 Electrical s e tu p ... 120
4.4.1 Resistance Vs. Temperature m ea su re m e n t...121
4.4.2 Responsivity m easurem ent... 130
5 FABRICATION AND CHARACTERISATION 132 5.1 High Tc superconducting YBCO device fabrication and material developm ent...132
5.1.1 Overview of various thin-film deposition technologies . . 133
5.2 Fabrication ...139
5.2.1 Fcibrication of SC Disc, thick film and the Annealing profile 139 5.2.2 Device F a b ric a tio n ... 143
5.2.3 Substrate and Selection r u l e s ... 144
5.3 Characterisation... 153
5.3.1 Magnetic Levitation ... 153
5.3.2 Rc^sistance vs. T e m p e ra tu re ... 154
5.3.3 Mutual In d u ctio n ... 156
5.3.4 Comparison between R vs. T and mutual induction mea surement ... 159
5.3.5 Responsivity vs. frequency... 161
6.1 Resistance vs. temperature m easurem ent... 163
6.1.1 Superconducting T a p e ...164
6.1.2 Superconducting Disk ...166
6.1.3 Resistance vs. temperature for thin and thick films . . . 171
6.2 Mutual induction vs. bias te m p e ra tu re ... 177
6.3 Mutual induction vs. bias c u r r e n t ... 179
6.4 Responsivity vs. frequency...181
7 SUMMARY AND CONCLUSIONS 184
APPENDICES 187
A Computer program for Quasi-dc analysis of thick and thin film
superconductors 187
List of Figures
2.1 The critical surface for superconductivity shown as a surface of constant electric field, E(B,T,J). With an appropriate selection of the electric field criterion this surface can be used to define
r,(B ), B,.,(T) and 7
2.2 Resistance vs. temperature characteristics of Superconductors. . 8
2.3 Phase diagram for type-I and type-II superconductors. 10
2.4 Magii(!tic behavior of perfect conductor (left) and superconduc tor (right)... 12
2.5 The l)ohaviour of wave function. · · ... 16
2.6 Schematic representation of electron-electron interaction trans
2.7 (a) normal-state, free electron, quadratic density of states is filled with electrons up to Ei?. Then, the superconducting energy gap 2 A(0) is shown and the allowed states that were in the gap are pushed into regions just above and below the gap. (b) More detail of the density of states above the Fermi energy (taken as zero)... 23
2.8 (a) Conduction band in the normal state, (b) energy gap at the Fermi level in the superconducting state. Electrons in excited states above the gap behave as normal electrons in rf fields: they cause resistance; at dc they are shorted out by the superconduct ing electrons. The gap Eg is exaggerated in the figure: typically
E,j ~ 10-'‘eF· 25
2.9 R.educed values of the observed energy gap as a function of the reduced temperature T / Tc, after Townsend and Sutton. The solid curve is drawn for the BCS theory Type of superconductors with the structure for YBCO (e.g. low Tc metals, alloys, HTSC
o.xides, C60). 26
2.10 Energy bands of Y B a2Cuz07 along some high symmetry direc tions for kz =0 of the orthorhombic BZ, from Krakauer and
Pickett. 29
2.11 Dependence of penetration depth on the temperature... 31
2.12 Experimental set-up for laser ablation deposition. 37
2.13 (a) The a-, b-, c-direction resistivities. { For detail, see T.A.Friedmann, Physis. Rev.B42, 6217(1990)}. The dashed curve is a schematic result for pc· (b) and (c) Pab and Pc for 2-Bi (n = l) superconductor with Tc (7K. { For details, see S. Marten, Phys. Rev. B41,846(1990)}... 40
2.14 A unit cell of La^CuO^. The larger black arrows in the Cu atoms denote the spin directions below TN. The smaller arrows attached to the 0 atoms surrounding the central Cu atom in dicate the tilts that cause the tetragonal material to become orthorhombic at low temperatures. 43
2.15 First wav used to levitate the train... 47
2.16 Second possible technique for magnetic laveitation for train. 48
2.17 (a) Schematic diagram of a dc-SQUID, (b) I-V characteristic for (·/) = m/>o and (f) = (n + 1/2), (c) V — cj) characteristic for a constant bias current... 50
2.18 (a) Schematic representation of an rf-SQUID, (b) peak ampli tude of Vrf versus Irj for cp = n</»o and <f> = {n-\-l/2)4>Q (c) peak
amplitude of Vrf vs. flux for fixed A / ... 51
2.19 (a) Superconducting flux transformer for measuring a field Bz; (b) superconducting first order gradiometer for measuring a field g r a d i e n t^ ; Li is inductance of the input coil of the transformer and Mi is mutual inductance between the input coil and the
3.1 Infrared radiation spectrum... 56
3.2 Cross talk... 68
3.3 Thermal detector... 71
3.4 Golay cell... 76
3.5 Schematic circuit of pyroelectric detector... 77
3.6 Schematic circuit of bolometer. 79 3.7 Performance of cooled bolometer NEP of carbon, germanium, silicon and thallium selenide semiconducting bolometers and tin, aluminum and titanium superconducting bolometers... 82
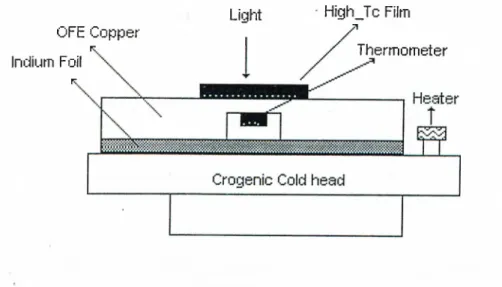
3.8 Configuration of superconducting sample, heater, sample holder and the cryogenic cold head... 85
3.9 Equivalent thermophysical diagram of the sample in contact to the cryogenics holder, q is the input radiation power, Cfs is a lumped heat capacitance of the film, Cg and Rg are the heat capacity and thermal conductivity of the substrate material, and R.fg and Rgc are the thermal boundary resistance values at the film-substrate and the substrate-holder respectively... 86
4.1 Definition of thermal conductivity. 97 4.2 Thermal conductivity for common cr3mgenic building materials.. 98
4.3 Cross section of the Dewar... 110
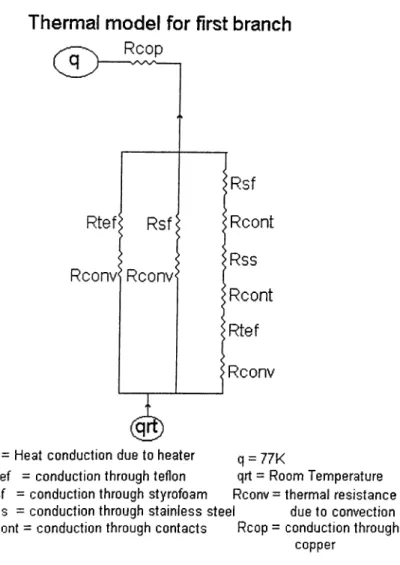
4.4 Thermal model for the conduction without including the inner environment... I l l
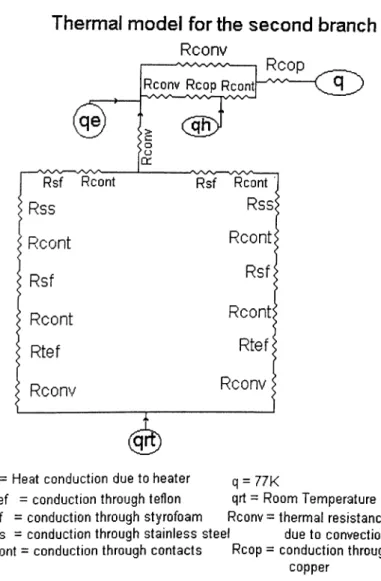
4.5 Thermal model for the dewar where the heat transfer involves
the inner environment...112
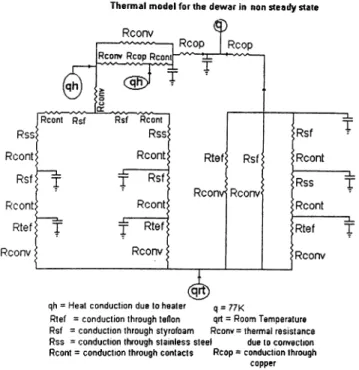
4.6 Non steady state model for the dewar...114
4.7 Cross section of the Dewar... 115
4.8 Cross section of the Dewar with modification...119
4.9 Basic setup for four probe measurement...121
4.10 Basic configuration for four probe measurement... 124
4.11 Van der Pauw and Kelvin resistor structures: (a) sample with an arbitrary shape; (b) an in-process tester design; (c) a Kelvin resistor design for measuring the effective window width...125
4.12 A relay configuration used to switch the current... 126
4.13 Computerized system for dc characterisation of superconducting thin and thick films... 127
4.14 Schematic diagram for mutual induction measurement... 128
4.15 A setup for the response measurement for thick and thin film. . 131
5.1 Experimental set-up for laser ablation deposition... 144
5.3 Temperature dependence of resistance for Y-Ba-Cu-0 SQUID on MgO substrate. Measuring current is 1mA and critical tem perature is about 90K... 155
5.4 Effect of the bias current on the resistance vs. temperature measurement... 156
5.5 Temperature dependence of coupling voltage for thin film at LaAlOS substrate... 157
5.6 coupling voltage vs. input current applied to the primary coil at 80K for superconducting thin film... 158
5.7 Response measurements by using the thermal model discusses in section 3.4, for different substrate materials... 162
6.1 Typical R.(;sistance vs. temperature curve for superconductors. . 164
6.2 Resistance vs. temperature of the Bi-based Superconducting tape by using non quasi dc measurement... 165
6.3 R^esistance vs. temperature measurement for Bi-Based Super conducting t a p e ...166
6.4 Resistance vs. temperature measurement effected due to unsta ble heating caused by the cooling process... 167
6.5 Effect of bias current under unstable heating of the disk due to non-equilibrium freezing process... 168
6.6 Resistance vs. temperature for SC. Disk (ds950ArO)...170
6.7 Effect of bias current on the resistance vs. temperature charac terization for bulk of superconducting materials...171
6.8 Effect of bia^ current on the resistance at fixed temperature (77K).172
6.9 Effect of thermal cycle on the room temperature resistance for superconducting bulk resistance... 173
6.10 R.esistance vs. Temperature measurement for SQUID at bias current of 1 rnA, with Tc of about 90 K...174
6.11 Effect of the bias current on the resistance vs. temperature measurement for SQUIDOl... 175
6.12 Effect of thermal cycle on the resistance vs. temperature mea surement... 176
6.13 Mutual induction vs. temperature for thin film Superconductors. 177
6.14 The effect on the mutual induction by reducing the temperature of the superconducting thin film on SrTi03 substrate...178
6.15 Effect of the bias current at the primary coil on the coupling vs. t(!inperature curve... 180
6.16 Measurement for the critical current density at 81K for the thin film SC on SrTiO'A substrate... 181
6.17 Effect of applied current to primary coil for thin film SC on
SvTiOw substrate... 182
List of Tables
2.1 Memorable steps in the history of Superconductor structures. . . 36
4.1 Electrical Analogous... 102
4.2 Correction factor C.F for the measurement of sheet resistances with the four-point probe... 122
5.1 The parameters of pules excimer laser... 143
5.2 Issues in substrate selection for epitaxial films... 148
5.3 Issues in substrate selection for applications... 151
B.l Thermal Conductivity and Integrated Thermal Conductivity for common Cryogenic Building Materials... 190
B.2 Properties of selected superconductors. He at OK is given for the elemental materials and Hc2 at oK for the compounds, which are all type II superconductors. While the units of He are mT, those
oi He2 are 10^Oe=lT. N(£7?) is the density of states at the Fermi energy and its units are states/(atom-eV); it is obtained fro the linear term in the normal-state specific heat... 191
B.3 Specific Heat Capacity and Integrated Values for common Cryo genic Building Materials...191
B.4 Common Cryogens and Their Characteristics...192
B.5 Thermocouple types, structure and application temperature rangess...193
B.6 Survey and Classification of Thin-filrn deposition Technologies. . 194
Chapter 1
INTRODUCTION
The superconductivity phenomena was discovered in 1908 according to which, a material loses its electrical resistance below some certain temperature called critical temperature, T^· Initially it was thought that superconductors could not be used widely because of the very low Tc of the known superconducting- materials at the time. After the discovery of a new class of superconductors in 1986, which have critical temperatures above 32K and usually called as high temperature superconductors, a new area was opened in the field. Since the discovery of superconductivity different theories have been established in order to understand the physical properties associated with phenomena of supercon ductivity. One of these theories is BCS theory which has predicted most of the properties very efficiently and until today it is considered to be the reliable frame work.
Now after about 100 years following the discovery of superconductivity we are at the point where we have high temperature superconductors with Tc up to about 140 K. The recent advancements in the fabrication technology of ma terials make it possible to use superconductors for verity of applications. Large scale applications of superconductors include manufacturing of Transformers, power transmission lines, cables, magnetically levitated trains, etc. Small scale applications includes detection systems, microwave circuits, amplifiers, and many more.
Recent advancements in solid state technology make it possible to have de tectors with high performance and efficiency. There are a variety of different detectors used for different purposes. Superconductors due to their physical properties is a prime candidate for the fabrication of thermal detectors specially as bolometers. Bolometers are one type of thermal detectors whose working principal is the change in the resistance due the change of the temperature. Applications of bolometers range from medical to the agriculture and from military to space technologies.
There are many ways to develop and approach the technology advancement of the detectors, which mainly depends on the application. One of the applica tions is detection in the infrared region where responsivity and detectivity are the most important parameters to be improved for the any used kind of the detectors.
In this thesis efforts have been done in order to improve the above men tioned properties. Thermal equivalent model has been considered to investigate which parameters of the detectors directly influence the responsivity and de tectivity. Once the related parameters has been found new method has been purposed to fabricate the detectors.
Once a detector has been fabricated we need to have a characterization setup which should be capable of providing a reliable data. Hence a cryo genic system has also been developed which can work at atmospheric pressure with almost constant temperature at the sample of about and over 77K. It has been found that this system reduces the noise specially the vibrational noise, which is usually found in other pump-based cryogenic systems. Sec ondly there is no need to have a vacuum for better operation, and it works with self-vacuum system. In order to improve the thermal properties of the system a one-dimensional thermal model for Dewar was also proposed.
The first chapter starts with the common superconductor’s properties and some very basic concepts. It also provides good references for those interested in the subject and prevents any extra research in order to understand the topics mentioned in the thesis on his/her part. It also works as a preliminary for the advanced topics used in the fabrication and resulting processes. Furthermore, the first chapter discusses our used Y B a2CuzOr-x material’s properties and
The second chapter discusses detectors and makes a connection between superconductors and detectors. It defines the detector parameters. Various topics such as noise, responsivity, specific detectivity, dynamic range, etc. are discussed in this chapter. Many recently developed types of detectors are also mentioned here termed in major categories like photon detectors, thermal de tectors and heterodyne detectors. A thermal equivalent model for detectors, has been discussed in detail.
Chapter 3 is about the experimental setup developed based on the model derived in the previous chapter. The two electrical and mechanical models are discussed here. For the mechanical model, we are to know various thermal properties, which are explained in a compact form. The mechanical model provides an account of the work done recently at Bilkent University during the course of this thesis, the Dewar design. Whereas the electrical setup has com puter controlled systems for performing the DC (R vs. T, mutual induction measurements) and AC analysis.
The original course of experimentation requires rigorous comparison of some known standards, which is discussed in Chapter 4. This is indeed the idealistic part of the thesis, which shall be compared with the experimental measure ments. This has been the reason for prior explanation of a few existing and successful techniques about fabrication processes which include the fabrication of thick and thin films and also the bulk superconducting discs. Afterwards the chapter defines some standards regarding the superconductivity and infrared
detectors such as, magnetic levitation, resistance vs. temperature, mutual in duction and inductances, responsivity vs. frequency, and the temperature and the noise measurements.
Chapter 2
SUPERCONDUCTIVITY: AN
OVERVIEW
2.1
R eview o f superconductivity
After the discovery of superconductivity many theories, like BCS, Ginzl)urg- Lanau, have Ix^en established in order to understand the behavior of sui)er- conductors. According to these theories the number of independent parame ters needed to describe homogeneous superconductors can be surprisingly few. From BCS theory, four parameter suffice (critical temperature, Tc, critical mag netic field, B,:2, order parameter, k, the normal resistivity, p„) to describe the
superconductor. On the other hand near to the Ginzburg - Landau theory uses only two independent parameters. For example Tc and Bc2 and others can be derived.
However from the practical point of view, inhomogeneity, anisotropy and granularity in the SC materials further much complicate the picture.
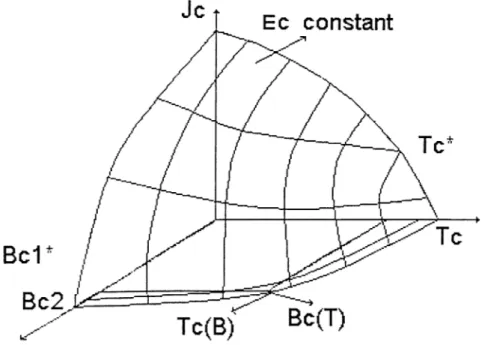
The typical relation between Tc, Bc2 and Jc for a superconducting material is shown in the following figure.
Tc critical temperature at Bc2
Tc’' critical temperature at Bc1^
Figure 2.1; The critical surface for superconductivity shown as a surface of constant electric fiodd, E(B,T,J). With an appropriate selection of the electric field criterion this .surface can be used to define Tc(B), 5c2(T) and Jc{B,T).
Near T„ and B,-'2, inhomogeneity in a material leads to the broadening of
the transition from the superconductivity to the normal state. Each of the above properties are discussed in the next sub-section.
2.1.1
Superconductive properties
Critical Temperature:Critical Temperature, Tf,, is defined as the temperature at which the supercon ductor loses its resistance. Hence critical temperature drives a specimen with a finite normal electrical resistivity to a superconducting state undergoing a phase transition as depicted in Fig. 2.2.
Tc being a characteristic property differs for metal and alloy superconduc tors. However, Tc is not aflFected much by the impurities, but magnetic impu rities tends to lower the transition temperature. Superconductivity is a rare phenomenon not shown by all elements of the periodic table. Though some al loys composed of two or more metals can exhibit superconductivity properties even though the same cannot be said when they are separated, e.g., Bi-Pb.
>u o c 1.T3 io ID Lc: 0 Ü C 0 •:o ¡D
The Tc transition for physically perfect elements is extremely sharp which can be broadened by adding impurity and disturbing the crystal as shown in Fig. 2.2.
Critical Magnetic Field:
When a superconductor is driven into normal state due to high applied mag netic field, the magnitude of the magnetic field is called the Critical Magnetic Field, He- The basic of above from the physical phenomena is that the net superelectron momentum must not exceed a certain value, which refers to a current density, if the material is to remain superconductor. This critical cur rent density is both represented by the current due to an external source and to the screening current which shield the specimen from an applied magnetic field.
W ith respect to the magnetization, a dia-magnetism arises in a supercon ductor when the surface super-currents circulate within the specimen to cancel the flux density inside. The current magnitude can be increased sufficiently by increasing the magnetic field until an upper limit for the current is reached. Then the shielding current will cease to increase with increasing magnetic field, allowing the magnetic field to penetrate.
As shown in the Fig. 2.3, the critical magnetic field is found to be de pendent on the temperature. The phase diagram as shown in the Figure 2.3a shows the magnetic field falling from some value Ho to zero below Tc and the
T
HHe
Normal
\\
Superconductor
\
Tc
Figure 2.3: Phase diagram for type-I and type-II superconductors.
material will l)e superconductor for a point lying in the area under this curve. The relationship between Tc and He, in specific for low Tc materials can be formulated as follows:
Hc =
T < T c
0 T > T c
(
2.
1)
By virtue of critical magnetic field, we can categorize the superconductors into two types:
T y p e I: superconductors, which are forced into normal state by one critical magnetic field.
T y p e II: superconductors, which are forced into normal state by two critical magnetic fields, as shown in Fig. 2.3b
Below Hci curve the material is in superconducting state, between H d and
Hc2 , the material is in a mixed state, and above Hc2 the material is driven into normal state.
M eissn er Effect:
Till the year of 1933, it was believed that the superconductors behave like a perfect conductor as shown in Fig. 2.4 (left). But in the same year experi ments led by Meissner and Ochsenfeld on the flux distribution outside tin and lead in superconducting stage showed that the specimen becomes perfectly De magnetized cancelling all flux inside as in Fig. 2.4(right)c, unlike the expected situation Fig. 2.4 (left)f. The reason behind this phenomenon is the genera tion of persistcnit surface currents when a superconductor is cooled in a weak magnetic field at transition. This whole process is called M eissner Effect.
Hence it can be stated that the superconductor is independent of the state of magnetism and depends entirely on the actual values of the applied field and temperature while its counterpart perfect conductor takes the state into account as well.
Ba = 0 Cooled Room Temperature Ba Ba - ^ 0 Ba (e) (b) Low temperature Ct) Cooled Ba I Ba —>0 (g)'
Figure 2.4: Magnetic behavior of perfect conductor (left) and superconductor (right).
2.1.2 Theory of Superconductivity
Two Fluid Model (London Equation):Two fluid model is a good starting point in order to understand the super fluid properties of Helium. Helium is assumed to be composed of atoms in two states, one being in condensed Bose-Einstein ground state and the rest in the normal state. This idea was used in practice for superconductivity purposes by Gorter and Casimer (1934) for the first time. They proposed the follow ing system of equations: if N represents conduction electron then conduction electron density n = N/V and n = n„ -f- nj where and n, are the densities of normal and superconducting state electrons respectively. Though a drastic assumption of electron separation, the scientists suggested the following free energy equations for the conduction electron of atom:
fn = —'yT‘^/2 usual free electron energy in normal state fs = —p constant, condensed state energy.
Minimization of free energy, F(x,T), for conduction electron with respect to X yields;
T l 1 q
(2.2)
The equation above shows a sharp dependence of fractional electron states below Tc ■ This model gives a hard physical basis for understanding supercon ductivity.
L on d o n E q u atio n :
Using the above assumptions and knowing the fact from condensed matter physics that the superconducting electron current is given by J = —e*Vs*ns, plus the Newton’s law m {dY /dt) = —eE, by using the A x E = — we have;
dJ ,e^*ns. „
^
*E-dt m (2.3)
where E = ( It and A = - i ) - .
Combining the above results with Maxwell’s equations we get the following general equation for the metals:
d[cA X (yVJ) + B]
dt = 0
.
(2.4)In 1935, London brothers used the above idea of two fluids to understand the Meisner effect. London characterized the behavior of superconductors by restricting the full solution set to the following:
-c A X (AJ) = B, (2.5)
Which is named as ’London’s equation’. Taking the curl of both sides using Maxwell’s equation A x B = and using the identity A x A x B = A(A · B) — A'“B we obtain A^B = ^ and — A^J = ^
>H =
m:
47rn,e^ ’ (2 .6)
where A is the London penetration depth. The above equation shows that the magnetic field decays from surface to bulk exponentially. London equation sim plifies Meissner effect a great deal by declaring that a shielding current is setup that protects the sample interior from external magnetic field. Hence by using the results of tlie penetration depth concept of the two fluid model and the following consequent equation of it, we see that below Tg, decreases rapidly, leading to the exclusion of flux from the bulk of the sample, the Meisnner effect in other words.
m = Ai(0)
[ l- (r /T ,) 4 ]i/2 · (2.7)
Vector approach can also be an intuitive approach towards solving the Lon don equations, which is used in describing Gisburg-Landau theory in the fol lowing section.
The Ginzburg-Landau Theory:
Related with Landau’s theory of second order structural phase transition, Ginzburg and Landau proposed a phenomenological theory of superconductiv ity in 1950. According to the theory, electrons were described to be in order at low temperatures while the free energy in terms of an order parameter was zero at high temperature phase. This entailed certain assumptions, one of them be ing the superconducting behaviour defined as a complex pseudo wave function
'if as the order parameter, which has the significance that |'L(r)p = n, = N^/V.
The second assumption in this regard is that the free energy of the supercon ducting state differs from that of normal state by an amount, which can be written as a power series. However, it is sufficient to retain only first two of its terms in this expression. The nonlinear and spatial variation effects of ris were then treated by using the GL formalism in magnetic fields. Not only did the theory defined a temperature dependent penetration depth A, it also introduced a coherence length dependent on temperature. Coherence length C is the distance over which i'(r) can vary without a substantial energy increase. The important GL parameter is defined as;
The Fig. 2.5 shows how 'F increases in the superconductor to its values at infinity ^00 hi a distance {() and how the magnetic field penetrates the superconductor (to a depth A).
He
XHe
X ---- ^1C < 1
(a)
Figure 2.5: The behaviour of wave function.
ra
Considering the GL free energy, in the presence of magnetic field and spa tial gradients, the free energy density is taken as;
(2.9) where the free energy density in the normal state = 0) is /„(t) = /no(0) - equation 2.9, is the classic magnetic energy density and the middle terms leads to the linear-temperature specific heat for a metal, where h(r) is local microscopic field. It is sufficient to keep the leading term |^ rad (^ )| only if n., varies slowly in space. |^rad(^)| is combined with the
vector potential A(r) in a gauge invariant manner. The total magnetic contri bution to the free energy of the superconducting state is therefore given by;
2m /
PjA
(
2.
10)
the integral being taken over the whole volume V of the specimen. The func tions ^ (r) and A(r) which make the total free energy of the specimen a min imum subject to appropriate boundary conditions is the central problem of the Ginzburg-Landau approach. This problem is simplified for weak magnetic fields where London equation is applicable; nonetheless, strong magnetic field equations are only solvable through numerical methods. This is while, both the and A vary with film thickness as varies with x, which is due to the film thickness, while again depends on |^ p .
The critical magnetic field can be calculated by the usual method of equat ing the free energy of the film in the superconducting state with that in the normal state. The general expression for if ' is complicated, but simplifies in two special cases:
(i) a > > A , in this case
H· = if.(l + f i ) .
(
2.
11)
where 2a is the thickness of the film, A is the penetration depth in a weak magnetic field, and a is a coefficient very close to unity. This is essentially the same as the London result.
(ii) a < A , this case causes to be approximately constant throughout the film resulting in,
K = 1 ^ 1 ^ .
a (2.12)
This differs from the London result by factor of \/2. As H approaches if', ’L gradually falls, to zero which brought out a surprising consequence of the Ginzburg theory showing the transition as a second-order one.
The major advantage of the Ginzburg-Landau theory is that it allows the study of spatially inhomogeneous systems, such as proximity systems, thin films, and others. If small amount of static (and nonmagnetic) impurities is introduced into a superconductor, this well have practically no effect on its thermodynamic properties and will not change its critical temperature. The electromagnetic i)roperties are another matter to be considered separately. The processes of electron impurity scattering which will change the electronic mo menta are important and will affect the coherence length, C· The latter will become ecpial to (Co0^> where I is the mean free path defined by the impurity density. Thus doping will lead to a decrease in ( and a corresponding rise in
K. In this way, a pure Type I superconductors can, by doping, be turned into
a Type II superconductors, resulting in a radical change of its behaviour in an external magnetic field.
Even though the experimental accuracy of Ginzburg-Landau theory has not exceeded London theory if values of A obtained from measurements on large
specimens are used. The greatest success of the Ginzburg-Landau theory still remains to be the correct predictor of the first to second order transition change with decreasing thickness, which London Theory fails to achieve.
BCS theory:
Any successfvd microscopic theory of superconductivity must be able to explain the following basic characteristics of superconductor;
(i) Superconductor is essentially bound up with some profound change in the behaviour of the conduction electrons which marked by the appearance of long- range order and a gap in their energy spectrum of the order of 10~'‘eV.
(ii) The crystal lattice does not show any change of properties, but must nev ertheless play a very important part in establishing superconductivity because the critical temperature depends on the atomic mass.
(iii) The superconducting to normal transition is a phase change of the second order.
Almost half a century after the discovery of superconductivity, a compre hensive, microscopic theory was proposed by Bardeen, Cooper, and Schrieft’er (1957), which is called the BCS theory. This theory gives an excellent account of the equilibrium properties of superconductors and, to quote from their con clusion section, ’’this quantitative agreement, as well as the fact that we can account for the main features of superconductivity, is convincing evidence that our model is essentially correct.”
The BCS results involve complicated, many-body, quantum-mechanical equations and a study would take us far a field.
C o o p e r P a irs an d P rin c ip le of BCS th eo ry : In 1956 Cooper consid ered a non-interacting Fermi gas at ~ OK, so all the states are filled for k
< kp ■ To this Fermi gas, two electrons are added, which occupy states with
k > kp because of the Pauli-exclusion principle. Then it is assumed that a
net attractive electron-electron interaction exists between these two electrons when their energies are within /iwc of the Fermi energy E/r. This attraction occurs because as the first electron moves through the crystal, it distorts (by means of a phonon) the structure in such a manner that a second electron reduces its energy by moving through the distorted structure. For electrons in this energy range, it is suggested that the interaction is attractive and larger than the repulsive, screened-Coulomb interaction and this is called phonon- mediated pairing.
The electron-electron interaction, U, scatters a pair of electrons with crystal momenta (k,-k) to {k',—k'). The scattering matrix element is Ufc,*,·'. Cooper assumed that Ua,,a:' = -Uq (independent of k, called weak coupling ) for states within a cutoff energy Hwc of E^?. The matrix element was taken as zero for energies outside the range Ep . Cooper showed that though electrons are re stricted to having momenta outside the Fermi sphere, they will have a bound state lying below 2Ef’. This bound state is called a Cooper pair. Thus, clearly there may be an instability in the electron system if this interaction is operative.
k \
y
/
/ - Wk
\ . k
Figure 2.6: Schematic representation of electron-electron interaction transmit ted by a phonon.
B C S R esults: If we consider; the density of states at energy E of one-spin orientation as N(E) , that is, the number of states between energy E and E-(-clE for electrons of one-spin orientation, by writing a many-body wave function BCS were able to show that there is a second order phase transition to a new electron state with the transition temperature expressed as
kuTc = (2.13)
where N(Ef) is the density of normal state electrons at the Fermi energy. The cutoff phonon energy hwc is related to the Debye energy Hujd in which ct>£) a where M is the atomic mass. Thus, the isotope effect comes out of the theory in a natural manner, namely, Tg a which had been suggested by Fröhlich in 1950 and was found to be in excellent agreement with experiments on mercury isotopes (1950).
According to the BCS theory the calculated energy gap at OK is:
2A(0) =
-sinh[l/iV(EF)C/o] (2.14)
The idea of a gap in the density of state is shown in Fig. 2.7, in a greatly exaggerated manner the normal state, quadratic, free-electron-like density of state is shown, which at OK is filled up to E^, for a superconductor. The OK gap is centered at Ep and it ’pushes’ allowed states into energy regions just below and above the gap, as indicated. The modified superconducting density of states, Ns(E), for E > A and E < —A , is;
E
Ns{E) = N{0) (E2 - A2)-i/2> \E\ > A. (2.15)
For energies within the gap, the density of allowed states is zero. This ex pression is singular at the edges of the gap (E= ±A ), and for positive energies the result is shown in details in Fig. 2.7. Here it should be noted that the total number of state is unaltered by the interaction and those formally in the gap are ’pushed out’ by the interaction. Thus, the number of superconducting state is much larger at T = OK than just below Tc.
Since the expressions for k^Tc and 2A(0) have the same form, their ratio is independent of the electron density of state and electron phonon matrix element, yielding the parameter-free result.
2A(0)/A:bTc = 3.52. (2.16)
UJ, I \ Superconducting
Normal
E/^
(b)
Figure 2.7: (a) normal-state, free electron, quadratic density of states is filled with electrons up to Ef-. Then, the superconducting energy gap 2 A(0) is shown and the allowed states that were in the gap are pushed into regions just above and below the gap. (b) More detail of the density of states above the Fermi energy (taken as zero).
Table B.2(see appendix) shows that experimental results for many elemental superconductors are close to 3.5, as are results for many compound supercon ductors.
By solving the gap equation at elevated temperatures, the temperature dependence of gap, 2A(T), can be calculated. The gap vanishes at Tg, and just below this value, A(T) can be approximated by;
A ( T ) ^ A T ,{1 - T/TcY^^ T <Tc
where A = 3.06.
Band Theory:
The invention of high Tq superconductors has led the solid state physicists to take interest in complicated superconducting alloys. This has resulted in even energy band calculations yielding results that may be called spaghetti diagrams because of the large number of dispersionless electron energy levels vs. crystal
momentum involved. Special attention will be given to Fermi levels Ep· since they have a direct consequence on the conduction process and superconductiv ity.
We begin with band diagrams. Band diagrams are essentially always for one-electron bands. In these calculations electron-electron repulsion is treated in an averaged manner as the electron orbital are largely extended compared to the nearest neighbor atoms which makes Coulomb’s repulsion forces approx imation quite feasible. Hence on average electron-electron correlation can be considered as mere perturbations. For a high Tg material, the electron-electron interaction is much larger than in ordinary metals, hence electrons are found to be strongly correlated and one electron band has little or no significance. A Hubbard type or resonating valance band model probably is a more sensible starting point to describe the electronic energies. This point of view is sup ported by the fact that one electron band calculation prefect metallic behaviour for all the high Tc type materials even the insulator ones. Cuprate materials on the other hand has a reasonable agreement between the one-electron band structure and experimental results. We shall focus on one-electron bands of these high Tc systems and their metallic properties. A particular approach is required for behaviors of the carriers within these materials. We will present the simplest viewpoint that reasonably agrees with the experimental values.
Energy Gap:
Superconductors being different from other materials have different energy band origin and nature as well. In a superconductor the electron-electron inter action is significant and plays a yital role in ordering the electrons in K space with respect to the Fermi gas of electrons. Insulators, have an electron-lattice interaction, which is responsible for electron-lattice ties as well. The argument of the exponential factor in the electronic heat capacity of a superconductor is found to be —Eg/2KBT instead of —E g /K sT . Comparing the optical and electron tunneling determinations of the band gap. Eg have been calculated.
Normal
b)
Superconductor
(b)
Figure 2.8: (a) Conduction band in the normal state, (b) energy gap at the Fermi level in the superconducting state. Electrons in excited states above the gap behave as normal electrons in rf fields: they cause resistance; at dc they are shorted out by the superconducting electrons. The gap Eg is exaggerated in the figure: typically Eg ~
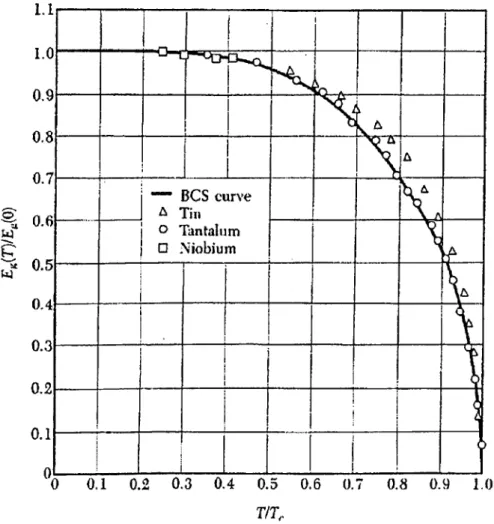
The transition in zero magnetic field from the superconducting state to the normal state is observed to be second-order phase transition. At a second order transition there is no latent heat, but there is a discontinuity in the heat capac ity, evident in Fig. 2.7a. Furthermore, the energy gap decreases continuously to zero as the temperature is increased to the transition temperature Tc , as in
Fig. 2.9. A first-order transition would be characterized by a latent heat and by a discontinuity in the energy gap.
id* g 1|---i 1 i J ri __ r> N ^ 5 7 1 ____ ^____ A 1 i BCS curve J A Till Nl A [) 1j 1 □ Niobiumo Tiintahim ! 5 j i 1 ± ■ \ j j > t j L 1 i i 1 r/T,,
Figure 2.9: Reduced values of the observed energy gap as a function of the reduced temperature T / after Townsend and Sutton. The solid curve is drawn for the BCS theory Type of superconductors with the structure for YBCO (e.g. low T; metals, alloys, HTSC oxides, C60).
Electronic and Band Structure:
The cause of superconductivity in the copper-oxide systems occurs mainly due to metal insulator controlled by doping or oxygen stoichiometry as well as
due to structural instability (orthorhombic tetragonal). At low tempera tures, the metallic phase becomes superconducting, while the insulating phase show long-range anti-ferromagnetic order. The structure of most of the high-
Tc superconductors are layered perovskite with large anisotropy [1] and most
unique feature is the presence of CU-O2 layers which seem to be crucial for the high temperature superconductivity. The exception is the cubic perovskite
Bai-xKxBiO'i-y, which has an onset temperature of 30K with the CU-O2 lay
ers missing. In this section we will see some of the basic electronic proper ties and band structure of most famous high-temperature superconductors, y
Bo,2Cu‘iO j—x .
E le c tro n ic p ro p e rtie s o i Y B a2CuzOj-x: The unique feature of the struc
ture of Y B a2C u3 0r-x is the absence of the 2-1-y oxygen atoms for the
perfect triple perovskite YCuOz{BaCuOz)2 [2]· In the limit x = 0, the vacancies are due to the absences of the oxygen atoms from the Y plane which separates the adjoining Cu-02 layers, and half of the oxygen sites in the Cu-0 plane between the Ba-0 layers which leads to the formation of the Cu-0 chain. There are three weakly coupled Cu-0 layers in the unit cell, consisting of two quasi-two-dimensional Cu-C>2 planes and a one-dimensional Cu-0 chain. Along the c-axis, the oxygen atom in the Ba-0 plane (Osa) is significantly close to the fourfold coordinated Cu atoms in the chains (1.85A) than the fivefold coordinated Cu atom in the planes (2.30A). As x is increased from 0 to 1, the oxygen atoms, in the chain layers, are removed and some of the oxygen atoms are moved to the empty sites, which eventually leads the orthorhombic to tetragonal transformation. One notable change in the structure as the oxygen atoms
are removed is that Osa atom moves away from the Cu-C>2 plane towards the Cu-0 chain along the c-axis, so that the Cu atoms in the chain layer are more isolated and the interlayer coupling between Cu-C>2 planes are further reduced. There is a remarkable correlation between % and the oxygen vacancy concentration [3] Tc is around 90 K for 0 < a: < 0.2 before decreasing sharply to 60 K, where it remains up to x = 0.5. Beyond x = 0.5, Tc drops sharply and anti-ferromagnetic order has been observed near X = 0.7, 0.85 and 1.
B a n d S tru c tu re of YBaoCu^Oj: Band structure of Y B a2CuzOj was first
presented by Mattheiss and Hamann and by Massidda et al. [4]. Mattheiss and Hamann chose the Cu-0 chain along the a-axis rather that the experimentally determined b-axis in their calculation. Since detailed neutron analysis was not available at the time. Hence the resulting band structure and subsequent calculations especially near Ep differ somewhat from that of Massidda et al due to slightly different Cu-0 distance in the chain. They found that the electronic structure o i Y B a2C u^()7 consists of occupied O2S bands, away from Ep, centered at -15 eV, Ba^p bands
centered at -10 eV, as well as unoccupied B a ^ and Y^a bands above 3.4 eV. More than 60 % of their charge on the Cu-0 chains are emphasized with the large symbols in Fig. 2.10a, while states with more than 80 % charge on the two Cu-0 layers are shown in Fig. 2.10b. Among the four bands that cross Ep, two of them have the majority of their charge on the CU-O2 plane corresponding to one band for each layer. The Cu-0 chains are responsible for the two other bands; a steep; band crossing Ep, which
n
is strongly dispersive only in the chain Direction, that is, along the X- S and F —F directions, and a flat band just at Ep along the Y-S direction.
Y B a 2 0 i J 3 O - 7
Figure 2.10: Energy bands of YBa^Cu-iOj along some high symmetry direc tions for kz =0 of the orthorhombic BZ, from Krakauer and Pickett.
The one-dimensional nature of Cu-0 chain as well as the two-dimensional nature of the C11-O2 planes was confirmed by the detailed analysis of the charge density distribution. The ionic Y and Ba atoms were found to act as electron donors and are not active participants otherwise, even if the
fully substituted material is ordered magnetically at very low tempera ture. The lack of conduction electron density near the Y site explains the stability of the high superconducting critical temperature when the isolated Y atoms are replaced by strongly magnetic rare-earth such as Gd or Er.
2.1.3 Magnetic Properties
T y p e I I M aterials: As we have seen in section 2.2.2 that on the basis of critical Held we can divide the superconductor two types. In type I su perconductor the external magnetic field is excluded for H < He, for H above He , the field penetrates the entire sample and superconduc tivity is completely destroyed as shown in the Fig. 2.3a. On the other hand for a type II superconductor, the magnetic field is excluded only for
H < Hci (lower critical field). Above H ^ the field penetrates in vortices,
and fluxoid associated with each vortex is one flux quantum [5]. If we increase the external magnetic field the density of vortices increases until the upper critical field Hc2 is reached, where upon the field penetrates uniformly and the material becomes normal. All High- Tc materials are type II superconductors.
P e n e tr a tio n D ep th : Below He or Hei, the external magnetic field is ex cluded from the bulk of the material by a persistent supercurrent in the surface region which induces a field that exactly cancels the applied field. The depth of this surface layer is called the penetration depth and is given by the London theory (section 2.2.2). The temperature dependence of the
penetration depth was first calculated with the two-fluid model, which yields;
A(T) = A(0)[1 - { T /T ,Y ] -^ '\ (2.17) where A(0) is the value at absolute zero. Figure 2.11 is a schematic dia gram of the behaviour of A(T), where it can be seen that (and also the coherence length) become very large near Tc ■ A(T) can be directly mea sured for H < He ox Hci by using H z = Hz{0) exp(—x/AL).
The relation between the susceptibility x = M / H and Ais given by;
= 1 - ^ ta n h (d /2 A ).
Xo d (2.18)
Temeprature
Figure 2.11: Dependence of penetration depth on the temperature. Where Xo is the zero-temperature susceptibility and the hyperbolic tan gent factor is a correction term close to unity for 2/d < < 1 (d = thickness of the ab plane in the direction of c-axis for Y123). This equation shows how the susceptibility is reduced by the volume fraction of the sample penetrated by the field; the factor 2 arising from penetration on both
sides of the sample.
BCS predicts a temperature dependent penetration depth similar to the Eq. 2.17, with small changes in the strong-coupled limit, and small changes in the dirty limit.
Hci - Both Hc\ and A are closely related theoretically and in the way that
they can be measured. For an isotropic superconductor, the lower critical field ( H,,i ) is related to the penetration depth b}'·.
Hci ~ ç!>o/47rA^.
where (po is the fiuxoid quantum (GL free energy expression).
(2.19)
C o h eren ce L en g th an d Hc2 · The coherence length is essentially the spa
tial range, or the decay distance, of the superconducting wavefunction. One may also think of it as the average diameter, or range, of a Cooper pair which for conventional superconductors, typically varies from (~ 5ÜÜ to 10'*.4). As we have discussed in Ginzburg-Landau theory an important parameter is «; = A/C, which relates the penetration depth to the coher ence length. According to Abrikosov if /c > l /\/2 , the superconductor is type II. For most elemental superconductors, the GL parameter k, < < 1
and therefore they are type I. The compound conventional superconduc tors and certainly all high- Tc materials are type II superconductors with
K ~ 100 (extreme type II limit), and they are in the clean limit.
The measurement of coherence length (C) is difficult. It can be extracted from fluctuation contribution to the specific heat, susceptibility, or con ductivity. However for the HTSC reliable values can be calculated by using the simple expression.
Hc2 ~ <?!'o/47rC^,
where (^o is file fluxoid quantum.
(2.20)
2.2
HTSC physical and electrical properties,
and the YBCO superconducting m aterial
2.2.1 Overview of HTSC
Since the discovery of superconductivity in 1911 the search for superconduc tivity with a high transition temperature, namely above the liquid nitrogen temperature of 77K, has been one of the most challenging tasks. However, before 1986, the highest transition temperature achieved was only 23.2K for NbsGe (1973). In 1975 superconductivity was observed in BaPbi_xBiiO;5 with critical temperature above 13K. This compound is the predecessor of the cur rent high-Tc superconductors.
In 1986 Bednorz and Muller, made a remarkable discovery. According to their point of views Tc can be raised by increasing the electron-phonon inter action by using Jahn-Teller effect. In 1986, they achieved superconductivity at around 30K in the Ba-La-Cu-0 system the first materials in a class of cuprates (Cu oxides). The material they used was La2Cu04 in which Ba, Sr or Ca were introduced to replace some of the La.
The superconducting phase was found to crystallize in the K2NİF4 struc ture, which is a layered perovskite with a strongly anisotropic crystal structure. The Ba-doped materials is usually written as La2_iBaa;Cu04 and the super conducting properties depend strongly on the doping x. A record high T,, of nearly 40K was achieved in the material Lai.85Bao.i5Cu04.
Several months after the discovery of the Ba-La-Cu-0 system, Y-Ba-Cu-0 (YBCO) was discover with a Tg above 77K. Subsequent magnetic field effect measurements indicated a record-high upper critical field Hc2 ~ 1430T at OK for these compounds. The identification of the phase responsible for the su perconductivity led to the chemical formula YBa2Cu307_j and to the evidence for a layered structure. This crystal structure is an oxygen-defect perovskite and is very anisotropic. Cu-0 planes and linear Cu-0 chains along the b axis were found to exist.
With the exact stoichiometry and the general structure of the supercon ducting phase determined, attempts were made to replace Y by the rare-earth elements to examine their role in high-temperature superconductivity. Thus a new class of superconductors, ABa2Cu307_5 with A = Y, La, Nd, Sin, Eu.Gd,
Ho, Er or Lu, with Tc above 90K was discovered.
Since 1988, many more new compounds as well as new classes of com pounds are discovered. Notable among these are the Bi-Sr-Cu-0 and the Bi-Sr-Ca-Cu-0 (BSCCO) compounds with transition temperatures up to 115K, and the Tl-Ba-Ca-Cu-0 (TBCCO) compounds, with transition tem peratures up to 125K. The general formula for the thallium compounds is TlmBa2Ca„_iCu„02rH-7n+2where n denotes the numbers of Cu atoms and m is the number of T1 atoms. Tc increases with increasing number for C11O2 planes in the elementary unit cell which is the general rule for all cuprate compounds. W ith time, the discovery of other cuprates has resulted in a large number of superconducting compounds and a maximum Tc of about 140K.
There are many other widely known high-Tc superconductors. In the lead- substituted TBCCO or BSCCO compounds T1 or Bi are partially substituted by Pb, such that the chemical formula begins (TliPbi_i...). In mercury com pounds T1 is substituted by Hg (Putalin et al. 1993). The resulting compound HgBa2Cu04+i has Tc = 94K, which is exceptionally high for a single-Cu02- layer compound. In oxycarbonates a carbonate group (CO3) is introduced in the conventional copper oxide configuration which results in the general chemi cal formula (Y,Ca)„(Ba,Sr)2„Cu3„_i(C03)07„_3 (Raveau et al 1993) with typ ical Tc values below 77K.
BaP bo.75Bio.25 O3 Lai.85Bao.i5Cu04 YBa2Cu307 Tc = 12K Tc = 36A" Tc = 90A: BPBO LBCO YBCO T1.2Ba2Ca2Cu30io = 120/^ TBCO HgBaCaCuO = 133AT HBCO
Table 2.1: Memorable steps in the history of Superconductor structures.
The family of high-Tc superconductors is very large. Despite high-Tc com pounds having many different structures with a variety of chemical substitu tions the general property is the presence of the copper oxide layers.
2.2.2
Basic Structure
Y123
High Tc denotiis superconductivity in material, chiefly oxides, with high transi tion temperatures, accompanied by high critical currents and magnetic fields. Memorable stcips in the adaced include:
The crystal structures of these materials, except for BPBO, are oxygen- defect modifications of the perovskite structure, with about one-third of the oxygen positions vacant. The primitive cell is developed from that of a tetrag onal perovskite tripled along the c axis. Per formula unit of Y B a2CuzO~, the
positive ion valences based on Y'^'^, Cu'^^ are 3 x 1-1-2 x 2-1-2 x 3 = 13
and the negative (oxygen) valency is -2 times 7 = -14.
■ Oxygen Atoms
Ba Atoms
'<!T
Cu Atomi
Y Atom
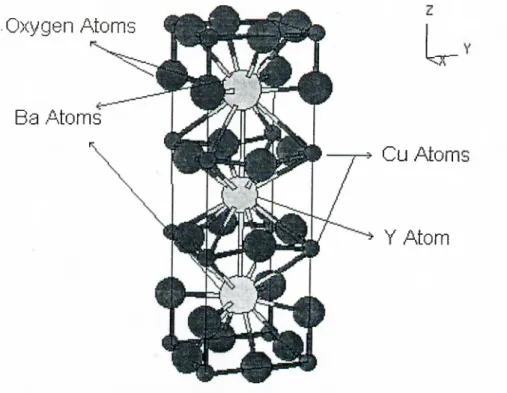
Figure 2.12; Experimental set-up for laser ablation deposition.
The quasitetragonal or orthorhombic cell dimensions of YBCO are, in nrn, a = 0.388, b = 0.384, c = 1.163, with cell volume 0.173 nm^\ if there is one excess charge carrier in this volume the carrier concentration in no = 5.77 x lO^^cm"·^. The excess carriers typically are holes embedded in doped antifer romagnetic insulators.
The Parallel sheets of CuO-i are a structural feature of all HTS. In YBCO crystal structure shown in Figure 2.12, the Cu02 planes are parallel to the plane of the ab axes in the orthorhombic primitive cell. Two of these planes, those through the interior of the cell, are the dominant conducting pathways. The oxygen content per cell can be changed reversibly from 7.0 to 6.0 atoms, simply by pumping oxygen in and out of the parallel chains of CuO that run
along the b-axis of the figure. At the composition yßa2Cu306 the crystal is an insulator, with antiferromagnetic order of the Cu spins. An increase in the oxy gen content above Oe.5 makes the crystal metallic and non-magnetic; the crystal is superconducting above 06.64· A charge-neutral formula for Y B a2Cuz07 can be written as Y B a2{Cu^'^)2{Cu^'^){OY~ or as YBa2{Cu^'^)3{0‘^~)e{0~). [5]
2.2.3
Resistance
C o n v en tio n al R e sistiv ity B ehaviour: The electric resistivity of most metals is dominated by collision of the conduction electrons with lat tice phonons at room temperature and by collisions with impurity atoms and mechanical imperfections in the lattice at liquid helium temperature. The net overall resistivity is given by:
p — pi + pj, (2.21)
where pi is the receptivity caused by the thermal phonons and pi is the resistivity caused by scattering of the electrons due to static defects that disturb the periodicity of the lattice.
The temperature dependency of the electrical resistivity is proportional to the rate at which an electron collides with thermal phonons and ther mal electrons. Concentration of phonons is proportional to the collision rate. One simple limit is at temperatures over the Debye temperature
9d- [6] here the phonon concentration is proportional to the temperature