Hierarchical Segmentation of Complex Structures
H. G¨okhan Akc¸ay, Selim Aksoy Department of Computer Engineering
Bilkent University Bilkent, 06800, Ankara, Turkey {akcay,saksoy}@cs.bilkent.edu.tr
Pierre Soille
Institute for the Protection and Security of the Citizen European Commission, Joint Research Centre
21020 Ispra (VA), Italy [email protected]
Abstract—We present an unsupervised hierarchical segmen-tation algorithm for detection of complex heterogeneous image structures that are comprised of simpler homogeneous primi-tive objects. An initial segmentation step produces regions cor-responding to primitive objects with uniform spectral content. Next, the transitions between neighboring regions are modeled and clustered. We assume that the clusters that are dense and large enough in this transition space can be considered as significant. Then, the neighboring regions belonging to the significant clusters are merged to obtain the next level in the hierarchy. The experiments show that the algorithm that iteratively clusters and merges region groups is able to segment high-level complex structures in a hierarchical manner.
I. INTRODUCTION
Segmentation has been a classical problem in computer vision and pattern recognition. Popular methods aim to find groups of pixels having spectral and/or micro-textural homogeneity, and are typically applied to images containing a small number of objects. However, it is almost impossible to find a good set of parameters that works well for many objects in a complex scene. On the other hand, hierarchical segmentation received significant attention because different objects appear in different scales. Given a hierarchical segmentation, meaningful and interesting objects can be extracted [1], [2], [3]. The problem is to determine how the hierarchy is constructed. The common approach underlying [1], [2], [3] is splitting and/or merging based on spectral homogeneity. However, this approach does not work well for complex structures that are intrinsically heterogeneous and consist of multiple parts with different spectral characteris-tics. Hence, many structures of interest do not appear in the hierarchy due to such limitations. As an alternative, Scarpa and Haindl [4] performed hierarchical texture segmentation assuming that frequent neighboring regions are strongly related. In order to find the strongly related regions, they clustered the image pixels to compute the frequencies of quantized region pairs. However, these frequencies are very sensitive to the number of clusters which is determined heuristically.
This paper focuses on an algorithm for constructing a hierarchy that includes complex structures which do not require a pre-clustering for determining the region types.
The algorithm does not solely depend on color information for merging. It encodes image segmentation into a transition space to find the interesting neighboring region pairs to be merged. The first step is the initial segmentation where the resulting regions correspond to primitive objects that have uniform spectral content (Section II). The next step is to model the transitions between neighboring regions and calculate the transition frequencies (Section III). Fi-nally, the significant transitions are automatically selected to determine the regions that should be merged (Section IV). The main difference between our previous work in [1] and the approach proposed in this paper is that the former aimed to select homogeneous regions automatically from a segmentation hierarchy, whereas the latter focuses on building a hierarchy of heterogeneous regions. Experiments using a multi-spectral satellite image and a color texture mosaic image illustrate the effectiveness of the proposed modeling of the transitions for hierarchical segmentation of complex structures (Section V).
II. INITIAL SEGMENTATION AND FEATURE EXTRACTION The first step is to obtain a segmentation of the image such that regions that have uniform color content correspond to primitive objects. For this initial segmentation step, water-shed transformation is applied on the generalized gradient [5] of the multi-spectral image.
The regions obtained from the segmentation are repre-sented with their spectral and size information. The spectral information for each region consists of the mean values of the pixels within the region for each spectral band. The size information corresponds to the number of pixels in each region. All features are normalized to the [0, 1] range using linear scaling. Given an image with k spectral bands together with its segmentation, each region Riis represented using the feature vector yi = (bi1, . . . , bin, si) where bik, k = 1, . . . , n, corresponds to the mean value for the k’th spectral band among the n bands, and si is the region size.
III. MODELING NEIGHBORING REGIONS
In order to obtain a segmentation of complex structures, neighboring regions with different characteristics should be merged. We present an unsupervised algorithm for automatic
2010 International Conference on Pattern Recognition
1051-4651/10 $26.00 © 2010 IEEE DOI 10.1109/ICPR.2010.280
1124
2010 International Conference on Pattern Recognition
1051-4651/10 $26.00 © 2010 IEEE DOI 10.1109/ICPR.2010.280
1124
2010 International Conference on Pattern Recognition
1051-4651/10 $26.00 © 2010 IEEE DOI 10.1109/ICPR.2010.280
1120
2010 International Conference on Pattern Recognition
1051-4651/10 $26.00 © 2010 IEEE DOI 10.1109/ICPR.2010.280
1120
2010 International Conference on Pattern Recognition
1051-4651/10 $26.00 © 2010 IEEE DOI 10.1109/ICPR.2010.280
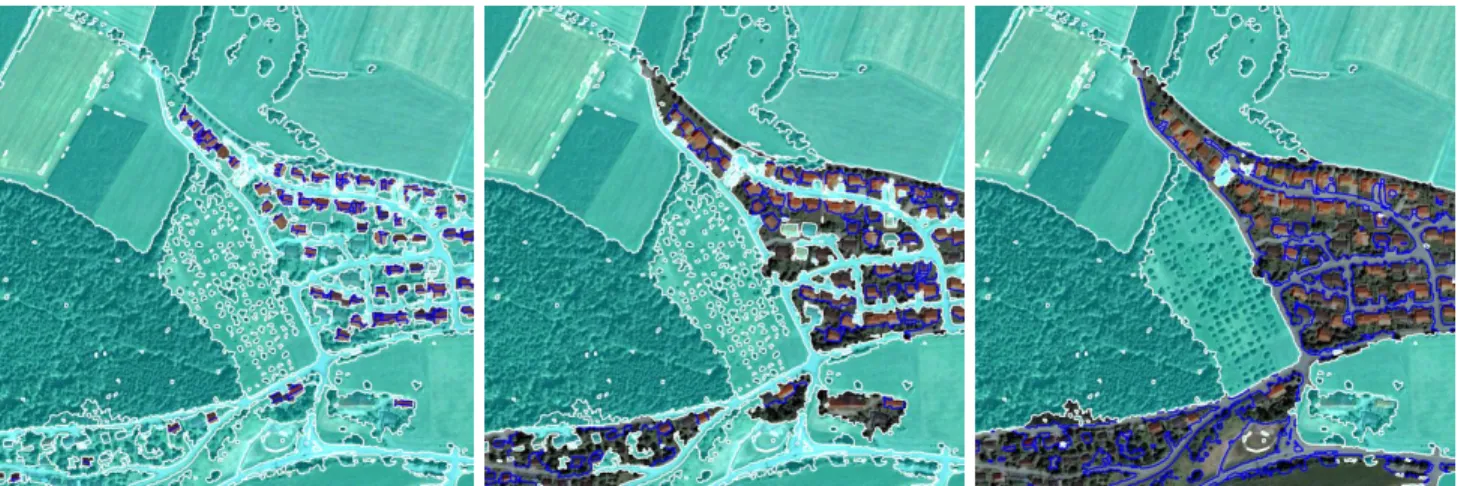
Figure 1. Clusters corresponding to the most significant transitions at levels 3, 4, and 6. The selected transitions are marked as blue, and the corresponding regions are highlighted.
selection of the regions that should be merged. The input to the algorithm is a segmentation together with its regions’ features. Our aim is to find the significant neighborhoods in this segmentation. In this paper, we find the signifi-cant neighborhoods using the transition frequencies between neighboring regions. We assume that complex structures consist of region objects that appear together frequently. For example, the residential areas in a satellite image, that can be denoted as complex structures, consists of many building-grass and building-street neighborhoods.
A. Modeling region transitions
With this motivation, in order to find the regions that should be merged, we model the transitions between neigh-boring regions. Two regions are denoted neighbors if the ratio of the length of the intersection of their boundaries and the perimeter of the largest region is greater than a length threshold. Let Ri and Rj be two neighboring regions. Then, the transition between these two regions is represented by two feature vectors in the transition space obtained by the concatenation of the feature vectors yi and yj as yij = (yi, yj) and yji = (yj, yi). This transition space encodes the region features along with their transition frequencies in the image.
B. Clustering transition space
The assumption here is that, transitions between two simi-lar region pairs (e.g., building-grass pairs) fall close to each other in the transition space. While similar transitions are pooled together to form dense clusters, seldom transitions are located sparsely. The goal is to find coherent clusters of transitions that correspond to significant neighborhoods. The resulting clusters correspond to different types of neighbor-hoods in the image.
In this work, we use a Gaussian Mixture Model (GMM) [6] to solve the clustering problem where the GMM com-ponents correspond to different clusters of transitions. The
cluster shapes are intuitively assumed to be Gaussian be-cause of the expectation that similar transitions accumulate around modes in the transition space. The GMM is estimated based on the expectation-maximization algorithm and the minimum description length (MDL) order estimation crite-ria. An important point here is the estimation of the number of clusters directly from the data because it is often impossi-ble to guess the number of similar transitions in a particular segmentation. After the number of clusters is selected using MDL and the clusters are formed, each transition is assigned to the cluster with the maximum probability. An important observation is that most of the resulting clusters are not sufficient (dense enough) to represent significant transitions in the space that can be sparse due to the complex image content.
IV. HIERARCHICAL SEGMENTATION
After clustering the transitions, the next major problem is to select the clusters corresponding to the significant transitions. We assume that the clusters that are dense and large enough correspond to the significant transitions. These clusters can be found by comparing the average log-likelihood values of the members of the clusters. We select the clusters whose average log-likelihood values are larger than the average of the average log-likelihoods of all clusters. Figure 1 shows some example clusters selected in different levels of the hierarchy. Then, starting from the cluster having the largest average log-likelihood value, we merge the regions belonging to the transitions within each selected cluster separately. If a region appears in more than one transition in different selected clusters, the merging of the region is performed only within the corresponding earliest selected cluster.
After merging the significant transitions, we obtain the next level in the hierarchy. Consequently, the resulting regions represent complex structures in the image. In order
1125 1125 1121 1121 1121
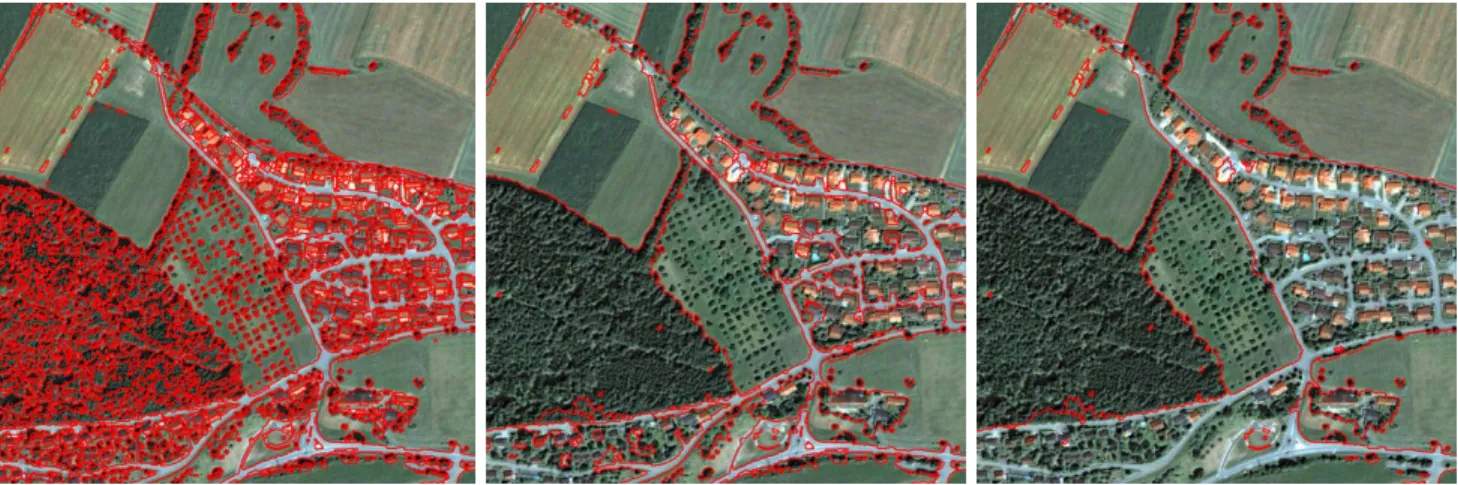
Figure 3. Hierarchy levels: 1, 5, 7.
Figure 2. An example hierarchy.
to obtain each level in the hierarchy, feature extraction, neighboring region modeling, cluster selection, and region merging steps are performed iteratively. Figure 2 shows a part of an example hierarchy constructed by regions appearing in five levels.
In the feature extraction step, the mean is often not longer sufficient to distinguish complex structures in higher hierarchy levels. An alternative feature representation is the topic distribution within each region. In this work, topic distribution is computed by using the Probabilistic Latent Semantic Analysis (PLSA) algorithm [7] that builds topic models by learning the object-conditional probability distributions. Due to space limitations, please refer to [1] for the details of how the topic distribution is found for each region. Other texture models can be used as a feature
representation for this step as well. V. EXPERIMENTS
We applied the proposed hierarchical segmentation al-gorithm to two different types of images. The first one is a multi-spectral QuickBird satellite image containing blue, green, red, and near-infrared bands. We ran the algorithm to obtain 7 hierarchy levels including the initial segmentation. Figure 3 shows example segmentations at different levels. Because of space limitations, we cannot show all the levels. Since no ground truth is available, only qualitative evaluation was done. Means and sizes were used as region features for the first 6 segmentation levels in which the regions stayed almost homogeneous spectrally. At the sixth hierarchy level, regions with different spectral content merged to form com-plex structures and the homogeneity wast lost. Thus, we used topic distributions as region features to obtain the last level. Figure 4 demonstrates the merging of regions in a zoomed area at different levels.
When individual hierarchy levels are analyzed in detail, we can see that neighboring green-shadow regions merged to form tree regions in the second hierarchy level. Then, neighboring grass-tree regions merged to form vegetation regions in the next hierarchy level. This is expected because the image contains mostly vegetation resulting in many green-shadow and then grass-tree groups. In the fourth hierarchy level, transitions between bright (i.e., affected by sun illumination) and dark building rooftops were selected as the most significant transitions to extract building re-gions. Then, the most significant transitions corresponded to vegetation-building groups whose merging revealed complex settlement regions that were separated by roads. In the last hierarchy level, the most significant transitions were found to occur between settlement and road regions whose merging produced residential regions as complex structures. Note that, we only discussed the most significant transitions at the corresponding levels such that other transitions might
1126 1126 1122 1122 1122
Figure 4. Zoomed hierarchy levels.
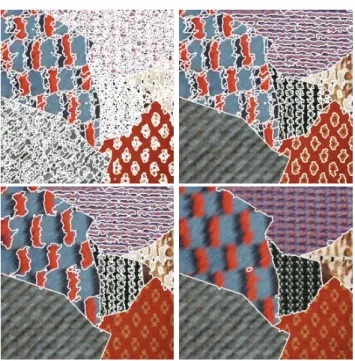
Figure 5. Hierarchy levels: 1, 6, 10, 16.
have been selected as significant in the hierarchy as well. Textures can also be considered as complex structures since they involve similar kinds of transitions. These transi-tions may be occurring in terms of different characteristics of regions (e.g., color, shape, orientation). Hence, we also evaluated the performance of the algorithm for hierarchical texture segmentation on a textured mosaic image [4]. Figure 5 shows 4 segmentation levels among 15 levels obtained. Means and sizes were used as region features in all levels.
The results show that our segmentation algorithm is able to segment both sub-textures and textures in the image.
VI. CONCLUSIONS
Unlike traditional hierarchical segmentation approaches that take into account only spectral or micro-textural ho-mogeneity, we presented an unsupervised method for hi-erarchical segmentation of complex image structures that involved complex groups of primitive objects. We modeled the transitions between neighboring regions to find which regions should be merged for obtaining the next level in the hierarchy. Experiments on satellite and textured mosaic images showed that the proposed algorithm is able to detect complex image structures in a hierarchical manner. Future work includes automating the selection of complex struc-tures from different levels of the segmentation hierarchy for different applications.
ACKNOWLEDGMENT
This work was supported in part by the TUBITAK CA-REER Grant 104E074.
REFERENCES
[1] H. Akcay and S. Aksoy, “Automatic detection of geospa-tial objects using multiple hierarchical segmentations,” IEEE Transactions on Geoscience and Remote Sensing, vol. 46, no. 7, pp. 2097–2111, July 2008.
[2] P. Soille, “Constrained connectivity for hierarchical image partitioning and simplification,” IEEE Transactions on Pattern Analysis and Machine Intelligence, vol. 30, no. 7, pp. 1132– 1145, July 2008.
[3] N. Ahuja and S. Todorovic, “Connected segmentation tree — A joint representation of region layout and hierarchy,” in CVPR, 2008.
[4] G. Scarpa and M. Haindl, “Unsupervised texture segmentation by spectral-spatial-independent clustering,” ICPR, vol. 2, pp. 151–154, 2006.
[5] S. Di Zenzo, “A note on the gradient of a multi-image,” Computer Vision, Graphics, and Image Processing, vol. 33, no. 1, pp. 116–125, 1986.
[6] C. A. Bouman, “Cluster: An unsupervised algorithm for modeling Gaussian mixtures,” April 1997, available from http://www.ece.purdue.edu/˜bouman.
[7] T. Hofmann, “Unsupervised learning by probabilistic latent semantic analysis,” Machine Learning, vol. 42, no. 1-2, pp. 177–196, 2001. 1127 1127 1123 1123 1123