ш & а ш а р ц ш ш νν'^-οί r-r··^
i ijsi üriM
.Ш М ^. т ш ш - ^ ■. :'^·-·:..
4 · 4 · 4M •і*«'· '-4#'.
'^'ije.VííTTí.D TC; THÊ DSP.'JCT’.iSfîT OF T'iOUCTT'.CvL
.t,«*ii *· * <4>. V,· Ь' Í.V-.■ "'; .
SYSTEM
A THESIS
SUBMITTED TO THE DEPARTMENT OF INDUSTRIAL ENGINEERING
AND THE INSTITUTE OF ENGINEERING AND SCIENCE OF BILKENT UNIVERSITY
IN PARTIAL FULFILLMENT OF THE REQUIREMENTS FOR THE DEGREE OF
MASTER OF SCIENCE
By
Erdem Gündüz September, 1997
I certify that I have read this thesis and that in my opinion it is fully adequate, in scope and in quality, as a thesis for the degree of Master of Science.
Prof. Наши Dogrusoz ^(Advisor)
I certify that I have read this thesis and that in my opinion it is fully adequate, in scope and in quality, as a thesis for the degree of Master of Science.
I certify that I have read this thesis and that in my opinion it is fully adequate, in scope and in quality, as a thesis for the degree of Master of Science.
Asst. Prof. Selim Aktiirk
Approved for the Institute of Engineering and Sciences;
Prof. Mehmet Ba<
ABSTRACT
M O D E L L IN G C A P A C IT Y E X P A N S IO N P L A N N IN G FO R A N O P T IC A L DISC M A N U F A C T U R IN G S Y S T E M
Erdem Gündüz
M.S. in Industrial Engineering Supervisor: Prof. Halim Doğrusöz
September, 1997
The capacity expansion problems involve determination of the optimum timing and sizing of the capacity for the facilities that have to meet a given demand function. There are various versions of the problem in the literature. In this thesis, a mathematical model for the expansion of a facility producing a single commodity is formulated. This formulation is then used for solving the capacity expansion problem for an optical disc manufacturing system, produc ing two types of products by the use of two different capacity types. The effects of the technological improvements and economies of scale are considered. The dynamic programming approach is used and a forward recursion algorithm is devised and coded on a personal computer.
K ey words: Capacity Expansion, Dynamic Programming, Technological
Improvements.
B İR O P T İK DİSK İM A L A T SİSTEM İ İÇİN K A P A S İT E G EN İŞLEM E P L A N IN IN M O D E L L E N M E S İ
Erdem Gündüz
Endüstri Mühendisliği Bölümü Yüksek Lisans Tez Yöneticisi: Prof. Halim Doğrusöz
Eylül, 1997
Kapasite genişleme problemleri, belirli bir talep fonksiyonunu karşılayacak tesislerin optimum büyüklük ve genişleme zamanlarının belirlenmesini içerir. Literatürde bu problemin bir çok çeşidi bulunmaktadır. Bu tezde, tek çeşit ürün üreten bir tesisin kapasite genişlemesinin matematiksel modeli formüle edilmiştir. Bu formülasyon, daha sonra iki çeşit kapasite tipi kullanarak, iki çeşit ürün imal eden bir optik disk üretim sisteminin kapasite genişleme probleminin çözümünde kullanılmıştır. Teknolojik gelişmelerin ve ölçek ekonomisinin etkisi de dikkate alınmıştır. Dinamik programlama yaklaşımıyla ileriye dönük ardışımlı algoritma tasarlanarak kişisel bilgisayarda kodlanmıştır.
Anahtar sözcükler: Kapasite Genişleme, Dinamik Programlama, Teknolojik
Gelişmeler.
ACKNOWLEDGEMENT
I am indebted to Prof. Halim Doğrusöz for his invaluable guidance, encouragement and understanding for bringing this thesis to an end.
I would like to express my gratitude to Assoc. Prof. Osman Oğuz and Asst. Prof. Selim Aktiirk for accepting to read and review this thesis.
I am also indebted to the Managers of RAKS Elektronik and RAKS Dış Ticaret for encouragement, helps and tolerances they showed me while preparing this thesis. I will like to express my special thanks to my Managers in RAKS Elektronik, Erşah Türkmen and Halil Tamay for their understandings. I have to thank specially to Bülent Mazacıoğlu, Nihat Alpan and Aziz Şahin for their supports and helps.
I would like to express my special thanks to my dearest friend Mustafa Karakul for his motivation and great helps in every part of the thesis.
And I would like to thank my collagues Dilek Uyar and Onur Özkol for their patience.
Finally, I would like to thank to my parents for their love and support throughout my life.
1 Introduction 1
1.1 Scope and Outline of the S t u d y ... 1
2 Compact Discs and Production Technology 5
2.1 Compact Disc Technology 5
2.1.1 Compact Disc Construction & L ayout... 7
2.1.2 Compact Disc Formats and Standards 8
2.2 Production T ech n olog y ... 9
3 Literature Review 12
3.1 A pplications... 13
3.2 Single Facility Problems 15
3.3 Capacity Expansion Via A Finite Set of Projects 19
3.4 Two and Multifacility P r o b le m s ... 21
4 Formulation of the Problem 24
CONTENTS vii
4.1 Formulation of the Capacity Expansion
P r o b le m ... 24
4.2 Construction of Parameters and Functions of the M o d e l... 28
4.2.1 Demand F u n c tio n s ... 28
4.2.2 Cost Parameters 32
5 Mathematical Model For Capacity Expansion Problem 40
5.1 Mathematical Model When There is a Single Capacity Type . . 41
5.1.1 Model for Constant Operating Costs 41
5.1.2 Mathematical Model for Time Dependent Operating Cost 49
5.2 Mathematical Model for Two Capacity
Types 55
6 Results and Sensitivity Analysis 58
6.1 Optimal Solutions of the P r o b le m ... 59
6.2 Sensitivity A n a ly sis... 60
6.2.1 The Effect of Discount R a t e ... 60
6.2.2 Sensitivity of the Model to the Technological Developments 67
6.2.3 Sensitivity of the Model to Cost Parameters 70
6.2.4 Change in Demand F u n c t io n ... 78
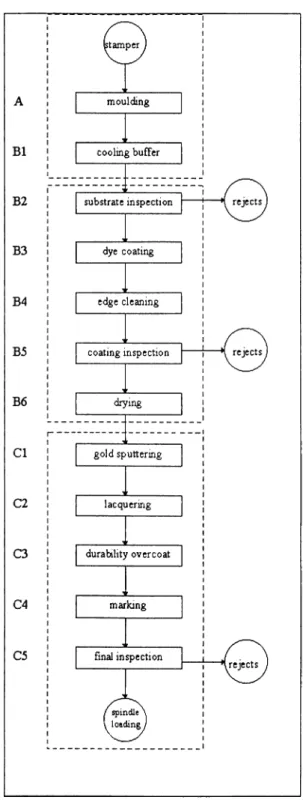
2.1 The Process Flow For CD-R Production Line. 11
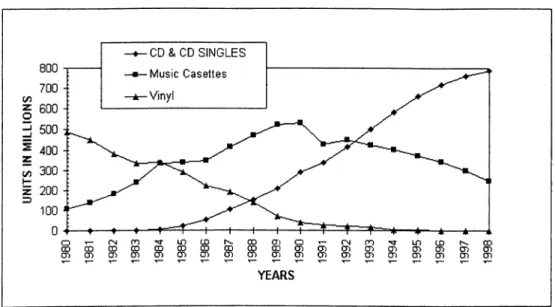
4.1 The Music Shipments in U S A ... 29
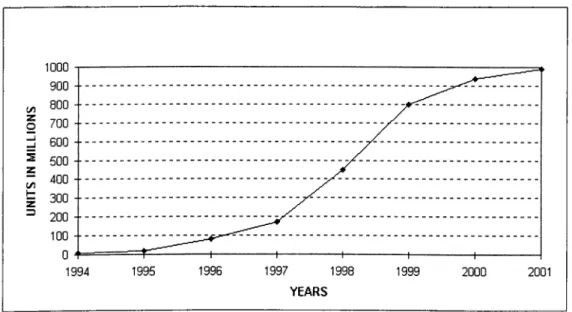
4.2 The worldwide CD-R Sales (After 1997 the data is forecasted) 31
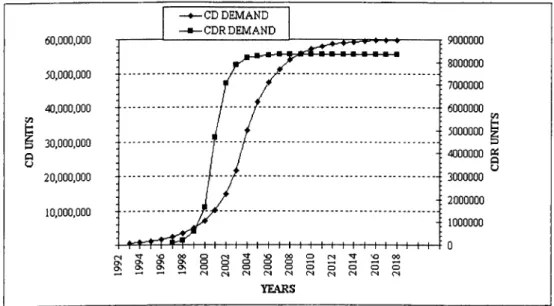
4.3 Demand Functions for CD and C D - R ... 32
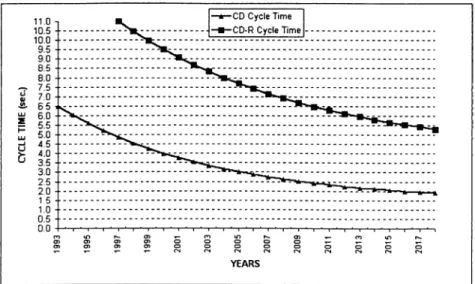
4.4 Cycle Time Versus Years for CD and CD-R 36
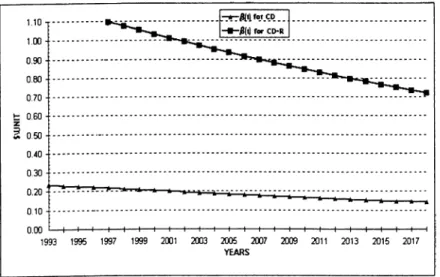
4.5 B(t) versus Years for CD and CD-R 36
4.6 The Variable Part of Operating Cost Versus Time For CD and
CD-R 38
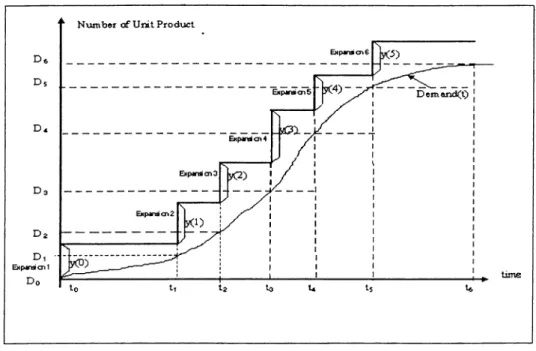
5.1 The time and sizes of Capacity Expansions. 42
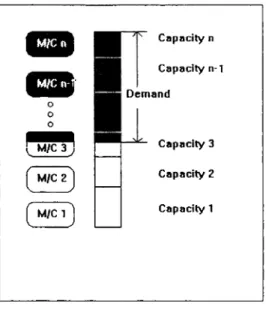
5.2 The Assignment of Demand to n Machines in the System . . . . 51
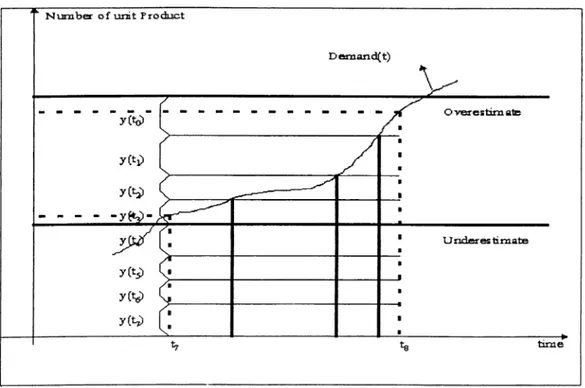
5.3 A Sample Capacity Expansion Figure showing the Underesti mate and Overestimate Calculation... 52
6.1 n* and F (n *) versus Interest Rate r. (CD-R Problem) 66
6.2 n* and F (n*) versus Interest rate r. (CD Problem) 66
List of Tables
4.1 Uptime and Yields for Production Lines
4.2 Parameters for CD-R Capacity Expansion Problem
4.3 Parameters for CD Capacity Expansion Problem
38
39 33
6.1 The Numerical Values of Cost Function for CD Problem - Part
1 (Overestimated Operating Costs) 61
6.2 The Numerical Vahies of Cost Function for CD Problem - Part 2 (Overestimated Operating C o s t s ) ... 62
6.3 The Numerical Values of Cost Function for CD-R Problem (Over
estimated Operating Costs) 63
6.4 The Optimal Solution for CD-R Capacity Expansions (Overes
timated Operating Costs) 63
6.5 The Optimal Solution for CD Capacity Expansions (Overesti mated Operating Costs)... 64
6.6 The Optimal Solution for CD-R Capacity Expansions (Under
estimated Operating Costs) 64
6.7 The Optimal Solution for CD Capacity Expansions (Underesti
mated Operating Costs) 64
6.8 Effect of interest rate on the Optimal Policy for CDR Problem . 65
6.9 Effect of interest rate on the Optimal Policy for CD Problem . . 67
6.10 The effect of to the Optimal Expansion Policy of CDR. 68
6.11 The effect of to the Optimal Expansion Policy of CD. 68
6.12 The Values of ks Corresponding to the Same Percentage Changes
for both CD-R and CD. 71
6.13 The Effect of Change in ks to the Optimal Policy of CD-R Capacity Expansions... 71
6.14 The Effect of Change in ks to the Optimal Policy of CD Capac
ity Expansions. 72
6.15 The Values of A{t) and B (t) Corresponding to the Same Per centage Changes for C D -R ... 73
6.16 The Values of A{t) and B {t) Corresponding to the Same Per centage Changes for CD ... 73
6.17 The Effect of Change in A to the Optimal Policy of CD-R Ca
pacity Expansions. 73
6.18 The Effect of Change in A to the Optimal Policy of CD Capacity Expansions... 74
6.19 The Effect of Change in B (t) Policy of CD-R Capacity Expansions. 74
6.20 The Effect of Change in B (t) Policy of CD Capacity Expansions. 74
6.21 The Values of a and P (t) Corresponding to the Same Percentage Changes for CD-R... 75
6.22 The Values of a and P (t) Corresponding to the Same Percentage
6.23 The Effect of Change in a to the Optimal Policy of CD-R Ca
pacity Expansions. 76
6.24 The Effect of Change in a to the Optimal Policy of CD Capacity Expansions... 76
6.25 The Effect of Change in ¡5 (i) to the Optimal Policy of CD-R Capacity Expansions... 77
6.26 The Effect of Change in (3 {t) to the Optimal Policy of CD Ca
pacity Expansions. 77
6.27 The Values of Dg Corresponding to the Same Percentage Changes for CD ... 79
6.28 The Effect of Change in Dg to the Optimal Policy of CD-R Capacity Expansions... 79
6.29 The Effect of Change in Dg to the Optimal Policy of CD Ca
pacity Expansions. 80
Introduction
1.1
Scope and Outline of the Study
Capacity is the maximum amount of supply that can be made available by
a production facility for the demand of a product or service. The difference between the demand and the supply arises the needs for the actions to com pensate this difference. The capacity expansion is the action which increases the existing supply capacity for demand satisfaction.
There are many situations in life where the capacity expansion decisions have to be made. Some of these decisions are daily and small decisions, like to buy a new T V set for home though there exist one already; however some of them are so serious that effects the society for many years, like building new electrical power generating stations for the expansion of the electric generation capability of a country. The former example includes the expenditure of a big investment and the decision will have impact on the country for many years. The effectiveness of this type of a decision is critical for the use of the sc:arce capital resources of the society.
The addition or installation of the new facilities generally have to be discrete in time, but the reaction of the demand for a product or service is a continuous
CHAPTER. 1. INTRODUCTION
process. This is because there is a big fixed cost for a reaction to change the supply capability and also there has to be a time period for this change to come into effect. The construction of a new electric plant may take years even after the expansion decision. Demand is on the other hand continuously changing with the conditions derived by the market and the surrounding environment. Therefore, the building of new capacities should take into account the change of demand during these time periods
The change of the demand pattern can best be understood with the lifetime of a new product, The demand for this new product during the introduction period has an increasing nature. This is because of the penetration process of the product into the market. After the end of the penetration process, the growth of demand for the product reaches a steady state. The product lives as long as technically and economically more attractive substitutes replaces it, from that time on the demand starts declining.
There are two main considerations to be taken into account in capacity expansion decisions; operational aspects and behavioral aspects (Freidenfelds [10]). The operational decisions are mainly the time and size of the expansion, in other words what size of expansion and when to be made questions are to be answered. In some situations the location of the new capacities are also important. The main behavioral aspect is the decision criteria that is value measurement to compare alternatives. Generally this measurement in the lit erature is the present worth. For most of the problems the time range for the solution is big such as years or months, so the time value of money have to be taken into account which justifies the usage of such a measure. There are also situations that rather than economical superiority other measurements may be more attractive for the decision maker. The management of the com pany can choose to install bigger capacities although it is more economical to build smaller ones, to show great management performance in the shortrun to shareholders. The literature review of the approaches to capacity expansion problems are extensively examined in Chapi;er 3.
studied in this thesis. The facility produces CD ( compact disc) including dif ferent types of formats, like Musical-CDs, CD-ROMs, CD-i, etc. Also another similar product CD-R, that is writable CD has a very fast growing demand structure. The demand of the product increases with time until it reaches a steady state amount. The production process of CD-R discs need extra pro cessing stations added to classical CD production facilities. It is possible to manufacture CD-R and CDs with a CD-R production line, but the reverse is not true. The details of the optical disc production technology and optical disc technology are explained in Chapter 2.
The operational aspect of the problem studied is time and size of the ex pansions. The time and capacity of CD production line or CD-R production line that will be added to the system are the decisions to be made. For the be havioral aspect, we used a different approach rather then the classical present worth method. Time average unit cost is used which is a measure taking into account the time value of money and was first introduced by Dogrusoz and Karabakal. [14] The precise explanation of the concept is given in Chapter 4.
Another important feature of the problem studied is the technological im provements. The products and the production process emerged from high technology, resulting in continuous developments in production technics. With the help of these improvements both the capital cost of installing the facili ties and the operating costs do decrease with time. This means the available production lines at a given time are more economical compared to the first invented ones and the machines in future will be better. This effect has to be taken into account in such a long-run problem in order to get reliable deci sions. The construction of the model and related assumptions are explained in Chapter 4 in detail.
The dynamic programming method is used for solving the problem numeri cally. It is seen as the most suitable method for the studied problem. A forward recursion algorithm is developed and coded for computer. The details of the dynamic programming model are given in Chapter 5.
CHAPTER 1. INTRODUCTION
Sohitions of problem and the sensitivity to parameters are studied in Chap ters 6. Conclusion and further research topics are discussed in Chapter 7.
Compact Discs and Production
Technology
2.1
Compact Disc Technology
CD (Compact Disc) is an optical media that is being used for the storage of data. The compact disc technology emerged with the invention of LASER. The word LASER stands for ‘Light Amplification by the Stimulated Emission of Radiation’ . Lasers generate coherent light, i.e. light comprising photons with the same wavelength and in-phase. This allows the light beam to be focused to a very small spot size similar to the actual wavelength of the light itself. The advent of lasers and in particular low cost laser emitting diodes has allowed the compact disc technology to become one of the most successful consumer electronic technologies of all time.
In the late 60s, Philips developed the laser video disc. This was a 30 cm. disc capable of storing 60 mins of analogue video. A low power laser was used to read the video information stored in pits in the disc surface. The pits are simply small indentations over the surface of the plastic disc. These pits measured about 0.5 microns in width. They were arranged in a spiral pattern, like vinyl records, the radial spacing between ‘tracks’ being only 1.6
CHAPTER 2. COMPACT DISCS AND PRODUCTION TECHNOLOGY
microns. The pit lengths and spacing are related to the video signal which they represent.
The compact disc uses exactly the same method with identical pit sizes and spacing. However, the pits are used to indicate whether a data bit is ’0’ or T ’ . The read head is a small laser diode emitting infra red ’light’ of wavelength about 780 nm. This ’light’ is focused to a beam small enough to read the sub-micron pits.
The laser diode is mounted on a swivel arm which can be moved radially and has sufficiently sensitive controls to ensure that the laser follows the pits accurately, even if the CD is slightly eccentric, due perhaps to the centre hole being slightly off centre. The beam focus can be moved up and down to compensate for the disc being slightly warped. A semi-reflective mirror allows the reflected light to pass back to a photo detector. When the laser beam falls on a pit the light is scattered and very little is reflected. The changing light pattern detected is then converted into a series of zeros and ones.
The recordable CDs ( CD-Rs) have a slightly different technology. CD- Recordable discs can contain the same data in the same formats as mass- produced compact discs, and they are readable on the same drives and players that read and play other compact discs. CD-R discs are created one at a tim e- typically in a desktop environment-by CD-R drives which use a laser to record data on special CD-R media. The laser forms microscopic ’’ optical marks” in the light-sensitive dye layer of CD-R discs, which can be read like the micro scopic pits on CD-ROMs. It is important to remember that CD-Recordable is compact disc, and as such, is identical to mass-produced compact discs in its content, capabilities, hardware required to read it, and, most importantly, its logical standard, ISO 9660.
2.1.1
Compact Disc Construction L· Layout
The compact disc comprises a sandwich of a transparent polycarbonate layer, containing the pits in its upper surface, an aluminium layer forming a mirror surface to reflect the laser beam, a lacquer layer to protect the aluminium and. Anally, the layer of print.
The audio data stored on a compact disc is recorded from the centre, start ing at a radius of 23 mm., and extends outwards to a radius of 58 mm., the space occupied depending on the playing time. All audio CDs are CLV (con stant linear velocity) discs, which means that they are played at a constant speed of between 1.2 and 1.4 m/sec. The rotation speed (rpm) will reduce from the start of the data (23 mm radius) to the outside (58 mm) of the disc by a factor of 58/23 = 2.52. This means that the pits retain the same geome try wherever they are on the disc and there will be no change in performance
(including error rate) between the centre and the outside of the disc.
The annular space containing the audio data is divided into three main areas: Lead-in which contains no audio data but does contain other information relating to the audio content. It is used to allow the laser pickup head to follow the pits and synchronize to the audio data before the audio begins. Program which contains up to 74 minutes of audio data divided again into up to 99 tracks. Lead which contains data silence. All compact discs are divided up in this way. In all three areas the data is divided again into frames each of which represents 1/75 of a second of playing time. A full 74 minute disc will therefore contain 74 X 60 X 75 = 333,000 frames. The frame has little meaning for audio but is important when storing computer data on the disc.
CD-R Discs, however has an extra layer of a coated special dye. Also the reflector used in CD-R Discs are not aluminium, but gold. The dye layer is a light sensitive coating and the application of laser over it causes the pits to appear on the surface of CD-R.
2.1.2
Compact Disc Formats and Standards
The Compact Disc Products can be viewed as a group of product family, which have common technological basics but differ in some details for different ap plications. The discs can be used for the storage of data on computers, music, photographs, multimedia and so on. Also some of them are read-only, while the other are recordable or erasable.
There are standards for the Industry that explains the physical properties as well as software specifications for eac;h of the product in the family. The first published standards was from Sony and Philips for Compact Disc Digital Audio (CD-A), and in 1984 they introduced the standards for CD-ROM, storage device for computer data. The related standards for the products are:
CHAPTER, 2. COMPACT DISCS AND PRODUCTION TECHNOLOGY 8
• RED BOOK : Red Book describes the physical properties of the compact disc and the encoding of digital audio data.
• YELLOW BOOK : The specifications for CD-ROM, and an extension of the standard for CD-ROM XA.
• GREEN BOOK : Written in 1987, describes the CD-interactive (CD-i ) disc, player, and operating system.
• ORANGE BOOK ; The Orange Book defines GD-Recordable disc in three parts: CD-MO ( Magneto Optical), CD-WO (Write Once), and CD-E (Erasable) Discs.
• W HITE BOOK : The White Book defines the Video CD Specifications and published in 1993.
2.2
Production Technology
The stages of the production for CD and CD-R begin with pre-mastering and mastering stages. The Production Facilities examined here consist of the pro cesses that is successive to the stage where the stamper is ready for moulding. Stamper is the mould which contains all of the negative copies of the pits for CDs over its surface. During moulding these projections over the stamper build the indentations on the plastic discs. The mastering and pre-mastering units require different technologies and a very big investment that can be justified when production in big quantities is required. The feasibility of when to build mastering facilities is yet another problem and is not examined in this study.
Premastering is where the information received from the customer begins its
first stage in production. This stage is the preparation of the data in a format that makes the data ready to be processed to the master. The data is recorded generally on a CD-R Disc, but may be one of many alternative transporters like DAT (Digital Audio Tape), External Hard Disk etc. Mastering is the stage of the process where the data are converted into pits on a glass master. After this the master is plated over to form a negative copy that can then be used to make many plastic disc copies. The master is all of the pit and non-pit areas of the media on top of the glass disc.
The production system considered in this study begins after this point. The glass master is the mould that contain the data. This is different for all musical titles and CD-ROM. Also for CD-R there is a need to a standard master. This is placed in the injection moulding machine. Moulding is the beginning operation. Plasticized polycarbonate resin is then injected into the mold cavity under great pressure. The injected resin is then allowed to cool and solidify. The mould opens and the clear plastic disc is removed automatically and placed over the spindles. The plastic after this stage has all of the pits that define the data.
The other stage is metallization stage. In this stage a thin layer of metal is overcoated on the disc surface. For CDs aluminium is used as the metallizer.
CHAPTER 2. COMPACT DISCS AND PRODUCTION TECHNOLOGY 10
The process for CD-R, however uses gold in the sputtering station. The ma terial used for CD-R sputtering is very expensive, so the strict control of the metallization layer thickness and recycling of the scraps is important. More complex equipment is designed for CD-R lines for metallization process. This same station is naturally capable of aluminium coating.
After metallizing discs are covered with a protective layer of UV curable lacquer to prevent it from oxidizing. This is the lacquering station. If oxidation were to occur, the discs would become unreadable because the oxidized layer is transparent to light and the laser light from the player would not get reflected back.
These units defined so far are parts of both CD and CD-R Lines. However in CD-R production, after the moulding stage there is a process consisting of the application of dye. This is the dye coating stage. The cyanine dye is coated over the surface of the polycarbonate discs, cleaned and then this chemical coating is dried. After that discs go to metallization process for sputtering the gold layer.
Figure 2.1 shows the process flow schematically for a typical CD-R produc tion line. The difference between a CD production line is just that the station with the codes B3 to B6 are removed for CD production, and at station C l aluminium coating instead of gold is used. To produce CD on a CD-R line the products after stage B2 is directly transferred to stage C l.
Chapter 3
Literature Review
The problem of capacity expansion has long been the interest of the managers, and engineers; since it is a natural decision process encountered in many real life situations. However, the quantitative approaches to the problem began to be seen in the literature since the end of 1950. It is not surprising that the quantitative models and solution methods are generated from applications.
According to observations of Luss [23] the most popular parameters and decision variables in the literature for capacity expansion problem can be stated as:
The major decision variables in general for capacity expansion problems are the size, time and location of the expansion. The discount rate is critical for most of the cases and has an impact on the optimal policies, as the time considered for the problems is large. The cost of expansion have generally the form of
C (x) = A:x“ ( 0 < a < l ) , a ; > 0 (3.1)
or for fixed charge cost functions which reflect economy of scale.:
C { x ) = 0 i f X = 0 A + B x i f X > 0
12
X : Size of the capacity expansion.
K ; Base cost per capacity
a : Constant.
A : Fixed Charge (Cost per expansion).
B : Cost per unit capacity.
Three most popular demand functions in literature are the following
D (t) = 11 + 6t
D (t) = (3.3)
D ( t ) = /3 1 — e'-6t
It is interesting to give the application found in the Literature separately in order to view the areas research is concentrated for capacity expansion problem. This shows the moti\^ation behind the thesis.
The references in the Literature can be examined in three groups in theo retical aspects, these are mainly single facility problems, two-facility problems, multi facility problems, and expansion via a finite set of projects as Luss clas sified in his Review Paper [23].
3.1
Applications
The effects of the capacity expansion decision is critical for big projects, like the heavy industries, telecommunications and electrical power plants. The first applications of operations research techniques emerged from the situations faced in those industries.
The first recognition is from the book of Manne [24]. He studied the ex pansions for various heavy industries in India. In the Aluminium Industry, for
CHAPTER 3. LITERATURE REVIEW 14
a growing demand pattern the trade-off between building large facilities so as to get benefit from economies of scale versus the cost of the installation before needed is optimized. The decision variables are the time and size of the ex pansion, and the objective function was the present worth of all costs incurred. For the Cement and Fertilizer Industries location of the facility is added to the problem as a decision variable. Related to this the costs of supplying from various production points to demand points are added to the cost pattern.
This approach is used for huge investment projects like water resource, electric power generators and communication networks that affect a big society. The decision of the size and time of the electric plants in France from 1965 to 1985 was described by Bessiere[4]. For electric power generation problem, besides the sizing and timing, the selection of the type of the plant also has an impact on the problem. There are hydro (water driven), thermal, and nuclear plants. The optimal mix of these different types are examined by Peterson [26]. 0 ‘loghaire and Himmeblau [25] studied the expansion of the water resources. The study consists of selection from a set of possible projects, and the time of the implementation of the projects in order or meet the demand for water at every time period. Many applications exist also for communication networks. The capacity expansion for networks is more complex compared to other problems. This is because there are many nodes over the network and from each node to the other ones there is an associated demand for each period. The objective is similar like the other application examples, to find the optimum expansion policy minimizing the total discounted costs and satisfying the demand for all periods. In addition, optimal routing according to the given link capacities are to be determined. As both the optimum link capacities and routing depend each other the problem becomes complex. Yaged [30] has solved the problem for a large communication network spanning United States by using a heuristic algorithm. Doulliez and Rao [5] have a capacity expansion model in which there are standard capacity elements with a known cost for any link in the network. They found the optimal policy using a shortest path algorithm. Luss [22] examined a situation in which there are two types of cables for the links of the network : one is the standard cable and the other
is a special type cable. The special cable costs higher compared to the other type, but have the ability to satisfy two type of demand, where as the standard cable cannot. The decision process, consequently involves not just the size and time of the expansion, but the type of the cable to be installed also. There are other applications concerning the cable sizing and network multiplexing problems. The references for these subjects are : [11] and [20].
Although there are some application related papers in the literature, they generally lag behind the theory, models, and algorithms studied in the literature according to Luss [23]. The most attractive and complex studies seem the Classical works of Manne for Heavy Process Industries in India [24]. Also Luss indicates there is a need for more applications and research in this problem area.
3.2
Single Facility Problems
The problems can again be divided as Infinite-Horizon and Finite Horizon Problems. For Infinite Horizon Problems the Long-Run Optimality should be defined. Let P I and P2 be the capacity expansion policies at times and tk- Then the definition for Long run optimality is :
D efin ition 1 Policy P I with scheduled expansions at tk is long-run optimal if
there exists some time t such that there is no better policy from 0 to any tk ,
tk P
t-So the two policy P I and P2 can both be long-run optimal.
The Single Facility problems deal with the expansion of a single type of supply. The simplest type of this problem is the deterministic linear demand case. There is a linear deterministic demand with the rate of 6. The capacity is assumed to have an infinite economic, life and all of the demand should be met. The cost of adding a capacity with size x is f { x ) . The total costs of expansions
CHAPTER 3. LITERATURE REVIEW 16
are summed up to the Present Worth and this cost figure is minimized. The expansion sizes, x are always same at each expansion because the costs and the additional projections of additional demand are identical at every shortage time. C{ x) , the present value of all the costs can be stated as :
C'(a;) = Y ^ e x p { - r k x / 6 ) f { x ) = f { x ) /[ l - exp{ - rx/6) ] (3.4) fe=0
The function f { x ) in Equation 3.4 is generally concave and reflects the economies of scale. It is in the form of K x °‘ (Where K and a are constants, 0 < a; < 1) and/or A + B x (Where A and B are constants) form. The value that equates the derivative of Equation 3.4 to 0 is then simply the optimizing x value. Manne showed using the first form of the cost function; that x increases when a decreases and decreases when discount rate, r increases. These are all expected as the decrease of a means that there are more economies of scale so it is more advantageous to build larger capacities, and as r increases the time value of money increase so to tie up money for unused capacity becomes costly [24).
Sinden [28] showed that the identical time intervals between expansions exist for the cases where Demand function D{t) is arbitrary with f { x ) = K x°‘^ and f { x ) = A B x and D{t) is a linear function.
The extensions of the problem releases the assumption of the Linear De mand and the identical expansion sizes. Freidenfelds solves the problem with the Linear Demand but an initial jump Do and shows that the optimal expan sion sizes are just x + Dq. Again he solves the problem using arbitrary demand
curves and uses Backward and Forward Dynamic Programming Algorithms. [10] Related works can also be found in papers by Giglio [13] and Kalotay [19].
The models so far do not include the case of shortages, they assume that the demand should always be satisfied, and there cannot be imports. The paper of Erlenkotter [8] assumes unlimited imports and inventories where the demand is a linear increasing function. For the imports there is a penalty
cost, of p > 0, and for the inventories there is a holding cost h > 0 per unit of inventory per unit time. As consequence of the assumptions expansions would have been optimized when inventory is zero, and obviously the capacity after the expansion, will exceed demand. Hence, these properties of optimal solution simplify the calculations in using dynamic programming approach. The problem is solved in Manne's Aluminium Industry Example.
Freidenfelds [10] models the situation of the linear increasing demand with imports allowed. He solves the problem using Dynamic Programming ap proach. He also defines the congestion cost and solves the problem using this cost. He shows that it effects both the timing and sizing decision. This cost can be defined as;
D efin ition 2 Congestion cost is the associated costs due to the existence of
spare capacity in the system defined as s. It is called v (s) and is a function of
s.
Hopkins [16] has examined the infinite horizon optimality in a problem which combines both capacity expansion and equipment replacement situa tions.
The finite horizon problems deal with generally discrete time periods t = 1,2,3, ..,T where T is the finite horizon. Generally the finite horizon prob lems are solved using forward dynamic programming. Smith [29] examined the impact of a finite horizon T on the expansion policy imder certain assump tions. His results apply to the infinite horizon problems where time intervals of successive expansions are identical. He provided upper and lower bounds for the first expansion size as a function of T. When T increases the two bounds converge to the same value.
Rao [27] models a finite time horizon problem, with a known nondecreas ing demand to be satisfied by the production in that period and/or inventory from the previous period. The total time discounted costs to be minimized in clude the capacity expansion, production, inventory carrying, and idle capacity
CHAPTER 3. LITERATURE REVIEW 18
costs, which are assumed to be concave. The problem is to determine an op timal capacity expansion and production schedule. Based on some interesting properties of an optimal solution, an efficient dynamic programming algorithm is constructed.
Love [21] examines n period model with known demand and separable piece- wise concave production and storage costs. It is shown using the network flow concepts that for arbitrary bounds on production and inventory in each period there is an optimal schedule such that if, for any two periods, production does not equal to zero or its lower or upper bound, then the inventory level in some intermediate period equals zero or its upper or lower bound. He constructed an algorithm for searching such schedules where the bounds are —oo, 0,and oo.
Hinomoto [15] has incorporated the Technological Improvement concept to his model which have N- step expansions. He modelled the technological im provements as an effect in the decrease of both operating cost and capital cost. The improvement is assumed to be continuous and the decrease is related with an exponential function. The change of the capital cots is stated as:
W (t) = K { z ) e—kt (3.5)
K (z) is the cost of a facility at time 0 with size z. k is the rate of the
technological improvement and t is time in Equation 3.5. The operating cost is similarly defined. He solved the problem first in one stage and extend it to N stages. The solution procedure is simply finding the values of decision variables when the derivatives of the present worth of the total costs equal to zero. The weak point of the model is the assumption that the number of expansion N is known. The solution procedure gives optimal values of expansion sizes, times and production by changing the number of expansions. However in real situations the number of expansions is a decision variable. This makes the model illogical for applications.
Another paper where the technological improvement are taken into account is by Gabszewicz et al. [17] They relaxed some simplifying assumptions of
Manne's classical model with linear growing demand. The first one is instead of infinite horizon finite time period is assumed, and the technological improve
ments considered. The model instead of viewing the technological process as a
continuous one, formulates it as sudden discrete changes occurring randomly in time. According to the model technology is a given production and investment cost structure. They made the definition of an obsolescence date as :
D e fin itio n 3 Let T be a point o f time such that before T there exist only
one technology, say T\, to face the capacity expansion requirements, and after T there exist a new technology, say T2, competing with T\. A technological progress is said to have occurred at T if, fo r the capacity expansion problem from T to
00,
T2 is preferred to T\ in terms of cost minimization objective. Tis called the obsolescence date.
In the model they assumed that the cost structure of the new technology T2
is known with certainty at i = 0, but the obsolescence date may be a random variable. They solve the problem using A + B x cost structure for capital cost and a constant production cost of m. They found that when the obsolescence date T is known with certainty, depending on its position within the interval
[nx\ (n + 1) a:‘], {n is the sequence of the expansion) the first decision is to build
a plant of size large or smaller than the investment size x\ which is optimal for the problem without technologic improvements. When T is a memoriless random variable, the optimal first decision is to build a plant size of smaller than a;‘ .
3.3
Capacity Expansion Via A Finite Set of
Projects
For this type of capacity expansion problems there are a finite number of projects available with capacities Xi, X2, ...,Xn that cost Ci, C2, ..., Cn to install and maintain forever. As a general assumption there is a demand D{t) function
CHAPTER 3. LITERATURE REVIEW 20
that is nondecreasing with time. The problem is optimally sequencing the finite number of projects so as to minimize the discounted cost as well as satisfying
n
the demand. Surely for should be smaller than D{t) for any t. 1=1
This type of modelling is very suitable for water reservoirs, as there are at predetermined places reservoirs with known capacities. The demand for water is to be satisfied using these finite number of reservoirs. The optimal cost policy will be the optimal sequencing of the construction of water generating facilities at these reservoirs.
For the case of D{t) a linear increasing demand function { D (i) = gt) the solution is obvious. It turns out to be optimal to order the projects according to their annual cost defined by
A C (z) = rCi
1 _ Q-TXilg (3.6)
The present worth over all projects will be minimized if the projects are arranged in order of decreasing annual charge. [10]
For a more general demand pattern, Erlenkotter [7] devised a dynamic programming method for solution. He constructed a set of established projects
X. The set X is described by a vector with S binary elements representing the
list of implemented projects; for example for s = 4, X = (1110) indicates that projects 1,2, and 3 have been implemented. Let t
{X)
be the earliest time at which demand exceeds the available capacityX — 2 is the set that contains all of the projects X except project i. For all sets containing j projects, let Wj ( X) be the cost of optimally sequencing these projects. That cost can be found from
W, ( X) = min IVj., ( X - i ) + (3.7)
Starting with Wq = 0, W j can successively be generated until optimal
Hopkins [16] models a situation where for each planning period i, a number of finite possible investing alternatives, associated with a unit cost for each alternative at the time the action is taken. The problem is formulated as a linear programming problem, and the infinite horizon problem is solved , first by finding the optimal solution for a finite horizon problem that includes a validation of capital stocks. Then it is used to construct a solution to the infinite-horizon problem that is identical to the finite horizon problem in early periods.
3.4
Two and Multifacility Problems
The references so far dealt with the problems consisting of only one type of product and one type of supply to satisfy the demand for that product. How ever the extensions of this situations include different types of demand and also different types of supply. Two different type of facility can be added, for example and they have different characteristics.
Freidenfelds [10] solves a capacity expansion model in which there are two types of demand. A standard, generally less expensive, type of capacity can serve only the standard demand, while a deluxe capacity can serve both the standard and deluxe demand. Demand for both type is assumed to grow linearly with time, there is no difference in the cost of using the two types and the cost of rearranging demand from one facility type to another is negligible. A dynamic programming algorithm is devised for the solution of the problem.
Fong and Rao [9] have modeled capacity expansion with two producing regions. There is a single commodity that can be produced in two regions. Demand in each region is nondecreasing over a finite time horizon. Demand in each region must be satisfied, either by the current production capacity there or by a shipment from the other region. Capacity expansion and shipment costs are assumed to be concave and no inventory stock is allowed. The problem is to find a schedule of capacity expansion in each region and a schedule of shipment
CHAPTER 3. LITERATURE REVIEW 22
between the two region, such that the total cost over the time horizon is to be minimized. The model is the extension of the model found in [24] differing from that, it includes two producing regions and concave transportation costs A dynamic programming algorithm is devised to solve the problem.
Kalotay [18] considers a model in which there are two types of equipments available: a general purpose equipment and a cheaper specialized equipment which could provide only one of the services. It is assumed that the ratio of the demands is independent of time and that identical economies of scale are offered in the cost of the equipments. A lower bound for the present worth of the optimal policy in the case of linearly and exponentially growing demands, and determine the conditions under which the use of specialized equipment is justified.
It is shown that in the case of linearly growing demands the specialized equipment should eventually be used, while if the demands are growing expo nentially this may not be the case.
For the multifacility problems the usage of dynamic programming cannot be so useful as in the cases of the two type of facility problems. Because in the two type case the dynamic programming approach reduces the problem dimensionality to one. In various applications capacity expansions can take place in different producing locations i = 1,2, ..,m . Furthermore, often the products have to be shipped to different geographical regions j = 1, 2, ..,n at substantial transportation costs.
If the problem is formulated as a mathematical programming model so as to minimize the total transportation cost that is not discounted becomes a
transportation problem. The capacity expansion problem is stated as finding
the sequence of expansion sizes, times and locations so tat the total discounted expansion and transportation cost is minimized. There are heuristic algorithms for solving the problem and its extensions [23].
Freidenfelds and McLaughlin [11] examined a multitype problem. Specifi cally, they studied a cable sizing problem with several facility types in which the
conversion and rearrangement costs are negligible. They developed a branch and bound algorithm assuming that there is a finite number of possible ex pansion sizes for each facility type. Since the decision tree is very large, they developed simple heuristic bounds that are used to eliminate branches.
In the thesis we used time average unit cost per unit product measure for ob jective function, which is a quite different approach compared to the generally used present worth of all cash flows concept in literature. Also, technological improvements are modeled as continous reductions in cost parameters which is similar to the study of Hinomoto. [15]. The major difference in construction is that Hinomoto takes number of expansion as a predetermined value, however it is a decision variable in our model.
Chapter 4
Formulation of the Problem
4.1
Formulation of the Capacity Expansion
Problem
The investment analysis problem consists of determining the optimal times and sizes of the expansions for a production facility that has two main group of products. Two main product groups are CD family and CD-R family. The differences between these two groups and other related technical informations about products are described in Chapter 3.
There is a deterministically known future demand for both types of prod ucts. The demand is assumed to be a non-decreasing function saturating at a predetermined demand level in the long-run. The demand should be met for each time period by using only the capacities installed. The amount of produc tion should be equal to the demand for each time period. The inventory is not allowed. No inventories is, in fact not a simplifying assumption for CD family of products, it is the natural result of the production technique. The produced CDs transport the software (If it is a musical CD, then the music title or if it is CD-ROM, then the computer software) so each produced CD corresponds to a specific product. It is not reasonable to hold inventories because of this
reason for CD family. CD-R is on the other hand is blank media, it is sold as a product to be used for storing information. Therefore it is feasible for CD-R family products to be manufactured to inventory. However it is also assumed that the inventories are not allowable for CD-R Products to simplify the model.
The expansions are planned at discrete time units, in other words the ex pansions are executed at the beginning of year 1997, 1998 and so on, not in between these discerete units. The years are modeled as integer time units as 0, 1, 2,..,n. where time = 0 is the beginning year of the expansion analysis.
It is also assumed that the capacities once installed can work infinitely without any deterioration. The operating costs of the facilities remain same for all time periods.
There are two types of capacities, one is the CD production line, and the other one is the CD-R production line. The CD production line can only manufacture the products included in CD products family, whereas CD-R pro duction line has the ability two produce both CD and CD-R product families. There is a cost function associated for the two capacity types. The capac ities are discrete units, it means there is a fixed known capacity of a single production line that can change with time. The capacity installed can be the integer multiples of that single machines’ capacity. The cost of the installation of a production line has a fixed amount and a variable amount that changes with the capacities installed. It is assumed that the time needed to install a production line is zero, in other words as soon as the installation is made, the machine can begin the operation.
There is an operating cost for both CD and CD-R products. The operating cost has also a fixed and variable components.
Technological developments in the sector result in the reduction of both capital and operating costs. The effect of the technological developments is assumed to be continuous with time. The major result of technological im provements is the decrease of the cycle time of the machines with increasing time. Here, cycle time is defined to be the time needed to produce a unit of the
CHAPTER 4. FORMULATION OF THE CAPACITY EXPANSION PROBLEM 26
product. As the cost of a single machine is assumed to be constant, than the result of cycle time reduction is a decrease in the capital cost per unit capacity.
The criteria for choosing the best investment plan from the alternatives defines the objective function of the problem. As the time horizon of the problem is defined as time period of several years, the time value of money has to be taken into account. The time value is calculated with the help of discounting which makes the cash flows at different times equivalent to each other. If the cash inflows and outflows are continuous and continuously compounded with the discount rate r, $ per $ per time unit (time unit is year for the problem considered), the relations between the present worth P; future worth F; and, uniform series A becomes:
F = and P = Fe~^^ A = P { P - 1) (e’"‘ — 1) and P = A r,rt - 1 oTt[ e r - l ] A = F oTt- 1
)
- 1 and F = e’·' - 1 (e’· - 1)These and similar other traditional formula related to discounting can be found in any Engineering Economy book [6]. However these formula may not work for some conditions and the need for new measures arises. These alternative measures were developed by Dogrusoz and Karabakal [14]. They modeled the investments as growth processes composed of two separate parts; one is productive growth and the other is reproductive growth. Production can be positive or negative, i.e., production is either the cash inflow or cash outflow. Reproduction can also be negative or positive representing the excess cash or borrowed cash reproducing itself. This production rate is called as a function
a (d, i); d is the decision variables and t is time.
In most of the practical situations, a (d, t) is the difference between cash inflow rate, r (d ,i) , and cash outflow rate, m{ d, t ) , i-e. a{ d, t ) = ^ (d ,t) —
m (d, t ) . The determination of r {d, t) is generally not possible. If this function
is assumed to be independent of the decision variables than minimization of annual worth or present worth of cost can be used.
They developed an alternative measure called time average unit cost per
unit product or service. This is useful, for the capacity expansion problem,
as for this problem the production rate of the system can be well defined but the price is unknown for the future periods. As the r (d, t) function cannot be explicitly defined because of this, net present worth or annual worth concept carmot be used.
There is another problem with the usage of present or annual worth concept. The time horizon is not a predetermined constant, the costs of different time horizons should be compared. To overcome these difficulties time average unit cost per unit product, c is defined to be the price where pay all cash outlays which is defined in formula 4.1 :
1 1 rp j q{d, t) e~'^^dt — j m { d , t) e~'^^dt + ' ^ C {d, t) (4.1) f m {d, t) e ^^dt + C {d, t) e c = / q {d, t) e~‘^^dt (4.2)
q {d, t) : Production rate as a function of decision variable d and time t.
In these formulations C (d, t) is the amount of investment executed at dis crete time units t. Then the aim of the model is to minimize c. By minimizing c the optimal time average cost per unit product can be found. This measure also gives more insight to the decision maker than a present worth concept for this problem, as the cost per unit product can be known. The market price ex pectations and calculated cost can readily be compared to determine whether the investment is worthed.
CHAPTER 4. FORMULATION OF THE CAPACITY EXPANSION PROBLEM 28
4.2
Construction of Parameters and Functions
of the Model
4.2.1 Demand Functions
One of the most critical points of the problem is the correct prediction of the future demand, as it is the main data in giving the investment decision. The demand functions are assumed to be non-decreasing and saturating at a steady state demand level in the long-run. The function is mathematically formulated as a two step exponential function. Let Dq be the demand rate at time i = 0, 6 be the exponential rate of change in demand rate, Dg be the saturating level
of demand rate and $ be the inflection point. The function is then defined as Equation 4.3
D { t ) = Doe^^ , if i < $
D i + {Dg - D^) ( l - , if i > $ where is demand at time t — ^
(4.3)
For the determination of the parameters of demand functions, the past data structure of CD-R and CD demands in the world are examined. The demand functions of CD and CD-R do not behave in the same way because of the core differences in the usage areas of these products.
CD Product Family group consist of two main products, CD-Audio and C D -RO M ’s. Audio CDs are used mainly for recording of musical titles. They replaced the classical prerecorded audio cassettes in Europe and North America Market almost completely. These regions are the places where CD-Recorders have penetrated into the market. Turkey has a time phase in the introduction of this new technology which is approximately a 10 years time period. The sales data from 1993 to 1997 for Turkey shows an exponential increase which is very similar to the introduction period of Audio-CD’s in North America. The Figure 4.1 shows how the music market in USA moved from compact
Figure 4.1: The Music Shipments in USA
cassettes and vinyl records to CD [2]. Dq value is determined for CD as 530,000 CDs/year, from the real data in hand. There is a strong expectation and trend that all pre-recorded compact audio cassettes will be replaced with CDs. There will be still a room for audio cassettes in the future, it will be used for archieving and related amateur recording purposes. It seems that a new technology MD(Mini-Disc) can be a good substitute audio cassettes for home recording purposes. But because of the increasing penetration of CD-Players, the pre-recorded music market will eventually be dominated by this product. This is what happened in Europe and America. It seems logical that demand pattern will behave in a similar manner in our case.
There is a dramatic increase in CD-ROM demand because of the increasing usage of P C ’s (personal computers) and the appearance of CD-ROM Drives as a standard part of the configuration with the decreasing price. Although the increase is dramatic, the relative amount of demand for this product is low in CD Product Group. It is also logical to assume that this minority will remain. The networking and the Internet, if continues to grow (there seems no obstacle for this growth) in the same manner, the software and related computer-based information will be transferred by using the downloading facilities provided
CHAPTER 4. FORMULATION OF THE CAPACITY EXPANSION PROBLEM 30
through this global network. The effect of the network will be hea\'ier on com puter based transporters like CD-ROM. According to MMIS (Magnetic Media Information Services) Report in 1996 approximately 1/6 of the whole World wide CD-type discs sales consist of CD-ROMs. [1] Taking into account the current capacity of the music market dominated by compact audio cassettes, and adding to it the increasing CD-ROM sales; though it at first glance seems a very optimistic forecast Dg is expected to be 60,000,000 CDs per year.
The write-once CD concept was introduced first in 1989 by Tadyo Y u d en , a medium-sized Japanese manufacturer, and made a big success story till that point by filling the gap in data storage field presenting a 650 MB storage capacity with a medium which can be readable in almost any CD-ROM drive. The forecasts of the people in the sector was always very conservative, generally being far away from the real sales data CD-R products realized. CD-R, in the first parts of its lifetime was accepted by the professional sound studios, as a recording medium for the masters. The booming of CD-R began after the big reduction in CD-R Recorders prices. (The prices are still going down) This allowed CD-R to be a cost effective media for backingup computer information. It even replaced CD-ROM in small lot applications, as for its alternative CD Production requires a fixed cost for the setup of production and larger lead time as it should be manufactured in a plant. For small lots of production CD-R is a less-expensive and fast solution. Although there is a big jump in the demand, most of the expertes of the Industry believe that this increase will not go on in that manner and in 5 or 6 years it will reach to a steady state. The worldwide CD-R Sales (till year 1997 actual data, others are forecasts) are presented in Figure 4.2 [1]. In year 2000 it is expected that the demand will be in 1 billion units and reach the steady state position.
There are many reasons behind those forecasts. One of the main reason is that there are many alternative products in removable data storage, these are different types of optical, magneto optical and solid state systems. There is a limit that an optical system can reach in capacity, however in the long run there will be new products with better performances than the optical devices for data storage. The need for bigger storage and retrieval speed seems technically not
Figure 4.2: The worldwide CD-R Sales (After 1997 the data is forecasted)
possible to be met by CD-R.
There is another product called DVD, now being entered to the consumer market recently. DVD is an improved version of CD product family which can be read and written by DVD equipments, although they are in same dimensions with CD, but uses different type of laser. The product will have more than one side, which also increases the capacity. The storage capacity of 4 GB (gigabyte) per side can be achieved. This allows the recording of even a complete motion picture. Though CD-Audio will not be much effected, because CD gives enough capacity for audio, CD-ROMs and CD-Rs are expected to be replaced by DVD. The recording of motion pictures will enlarge the optical disc market as a new business replacing the classical VHS players in home usage.
According to the data and forecasts given by MMIS, a similar behaving pattern for CD-R Demand is constructed. The major difference with CD-R and CD demand is that, CD-R will have a very speed increase in its early periods and will eventually reach the saturation point.
In reality after the saturation point, demand rate should begin to decrease. From this point on demand rate will be lower than the peak level reached.
CHAPTER 4. FORMULATION OF THE CAPACITY EXPANSION PROBLEM 32
Q O
YEARS
Figure 4.3; Demand Functions for CD and CD-R
After that period, expansion decisions will not be considered as there will never be need for new capacities. The demand function considered in our model simply ignores those decreasing periods of demand rate function and assumes a nondecreasing demand. If the planning horizon T is close to the time periods where decrease in demand begins, then this nondecreasing demand rate function will be very similar to the real demand rate for the time horizon considered.
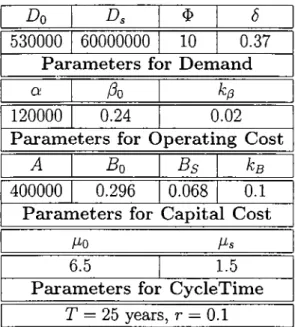
The demand functions are demonstrated in Figure 4.3. The parameters of demand are summarised in Tables 4.2 and 4.3.
4.2.2
Cost Parameters
Capital Cost Parameters
The capital cost is the amount of money spent for the installation of the facili ties. The capacity of a single production line is a known value and is a function of the cycle time. The calculation of the capacity for a single line depend on