Procedia - Social and Behavioral Sciences 176 ( 2015 ) 621 – 626
ScienceDirect
1877-0428 © 2015 The Authors. Published by Elsevier Ltd. This is an open access article under the CC BY-NC-ND license (http://creativecommons.org/licenses/by-nc-nd/4.0/).
Peer-review under responsibility of the Sakarya University. doi: 10.1016/j.sbspro.2015.01.519
IETC 2014
Tendencies of engineering students on applying technological
innovations
Hasan Tinmaz
a*, Ilker Yakin
ba
Assistant Prof. Dr., Istanbul Gelişim University, Department of Computer Engineering, Istanbul 34315, Turkey
b
Assistant Prof. Dr., Mersin University, Department of Computer Education and Instructional Technology, Mersin 33000, Turkey
Abstract
As Information and Communication Technologies (ICTs) infuse more into our daily lives, their effects and significance become more visible for everyone. On the other hand, not all ICTs are welcomed by everyone. Some technologies or tools are more preferable whereas some people totally ignore some ICTs. In that sense, diffusion of any innovation is significant to implement research studies. Therefore, this study aimed to reveal current situation on diffusion of innovation tendencies for Faculty of Engineering (92 students from Computer, Industry and Mechatronic engineering, and departments) who will be the prospective adapters of ICTs into different sectors in their jobs. Tendency on adapting and implementing current ICTs could be listed within the most important competencies of any engineering department. The study instrument which was adapted by researchers starts with 10 demographic questions (gender, department, what social media tools they use, and etc…) one question asks for possible barriers, 20 questions on 5-point-Likert scale focusing on unfolding their tendencies on diffusion of innovations. The concept of time and administration gained prominence made a statistically significant difference among participants in revealing current situation on diffusion of innovation tendencies for students from faculty of engineering.
© 2015 The Authors. Published by Elsevier Ltd.
Peer-review under responsibility of the Sakarya University.
Keywords: Diffusion of Innovation; Adoption of Innovation; Technology Acceptance; Technological Innovations; Innovation Tendencies
* Hasan Tinmaz. Tel.:+90 212 422 70 20 / 236; fax:+90 212 422 74 01.
E-mail address: [email protected]
© 2015 The Authors. Published by Elsevier Ltd. This is an open access article under the CC BY-NC-ND license (http://creativecommons.org/licenses/by-nc-nd/4.0/).
1.Introduction
Since technological innovation is important for an economic boost, conception of diffusion of innovation has been one of the central construct to be researched. As Pantano and Di Pietro (2012) noted people’s psychological traits are one of the main factor in their decision of new technology acceptance. That is why many attitude-behavior models have been developed and used to reveal these determinants in the literature. To illustrate, Rogers (2003) tried to explain differences in diffusion of innovations via user characteristics by defining diffusion innovation as a process occurring among the members of a social system over time with certain channels. More specifically, innovation attributes such as relative advantage, compatibility, complexity, trialability, and observability play an instrumental role in potential adopters’ evaluation regarding innovations (Rogers, 2003). Other related factors have been asserted in the literature such as adoption costs, network effects, and usage behavior (Ryan & Tucker, 2012). Zarmpou, Saprikis, Markos and Vlachopoulou (2012) explained this phenomenon in a general manner via using the theory of reasoned action that personal in nature (attitude) and social influence (social or subjective norm) are major elements for users’ intention to adopt a technology.
In general, personal attitude towards applying technological innovations becomes a prominent factor. Zarmpou et al. (2012) suggested that personal innovativeness covering motivational elements has the strongest effect among other factors to adopt new technologies. Beside personal factors, social influence and contextual influences drive individuals’ intention to adopt or continue the innovation, most notably in the later stage of the new technologies (Sun & Jeyaraj, 2013). When time as one of the components of the process is taken into consideration, the actual adoption period becomes even more important. In general, adoption of a new technology has been considered as a slow actualization process (Smith & Ulu, 2012). Khanagha, Volberda, Sidhu and Oshri (2013) stated that adoption is a process occurring step by step and gradually. Similarly, adopting and applying contemporary technologies in education have happened relatively at slow pace (Harrison, Tomas, & Crook, 2014).
Although the impact of individuals’ intention on applying and adoption of technological innovations have been extensively tested and validated through empirical researches in the literature, there has been little research in this area highlighting present situation of students enrolled in university level in terms of their innovation dispositions. Therefore, this study aimed to reveal current situation on diffusion of innovation tendencies for Faculty of Engineering who will be the prospective adapters of ICTs into different sectors in their jobs. The following research questions guided this study:
x What are the possible barriers for students to accepting new technologies?
x Do male and female engineering students differ in terms of their perceptions regarding technological innovations?
x Do second and third grade students enrolled in engineering departments differ in terms of their perceptions regarding technological innovations?
x Is there any significant difference in students’ perceptions regarding technological innovations across three engineering departments?
2.Methodology
2.1. Participants
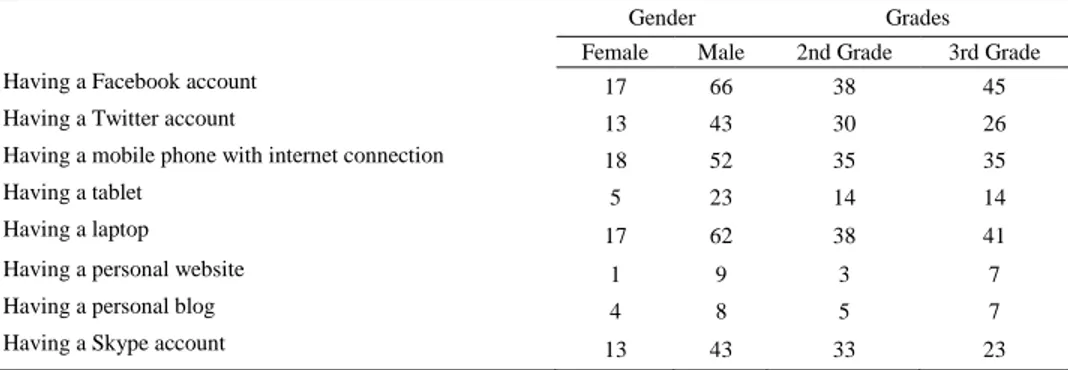
This study included 92 students (72 male and 20 female) from Department of Computer Engineering (N=25), Department of Industrial Engineering (N=28), and Department of Mechatronics (N=39) of one private university from Turkey. 44 second grade and 48 third grade students participated voluntarily in the study. The demographics of the participants are represented in Table 1. From the table, it seems that 90% students use Facebook whereas only 61% use Twitter. Students mostly have a laptop and only very few have their blogs or personal websites.
Table 1. Demographics of participants
Gender Grades Female Male 2nd Grade 3rd Grade Having a Facebook account 17 66 38 45 Having a Twitter account 13 43 30 26 Having a mobile phone with internet connection 18 52 35 35
Having a tablet 5 23 14 14
Having a laptop 17 62 38 41
Having a personal website 1 9 3 7
Having a personal blog 4 8 5 7
Having a Skype account 13 43 33 23
2.2. Design of the study & instrumentation
In general, the main purpose of the survey research is to delineate the characteristics of a population (Fraenkel & Wallen, 2009). Since the study aimed to disclose current situation on diffusion of innovation tendencies for Faculty of Engineering students, non-experimental survey research method was employed. Administration of the survey instrument to the participants was chosen as the mode of data collection. Therefore, a questionnaire which was adapted from the study of Savery (2005) was firstly scrutinized to suite Turkish language, and after administration a reliability analysis was conducted. According to the Cronbach’s Alpha value with .85, the questionnaire had high internal consistency reliability.
Aside from demographic questions, the questionnaire was composed of three main sections addressing students’ social media and technological tool usage, the factors preventing them from accepting new technologies, and their perceptions regarding technological innovations. The last section of the questionnaire was consisted of twenty one items on a 5-Likert scale (from strongly disagree to strongly agree).
The data obtained was analyzed with PASW Statistic 18 package. As for data analysis, non-parametric techniques were used throughout the study due to the violation of normal distribution assumption. While the differences between genders, grade levels and perceptions regarding technological innovations were statistically checked by Mann-Whitney U Test for each item, The Kruskal-Wallis Test was used to determine whether there was a difference between departments in which students enrolled and students’ perceptions in terms of technological innovations for each item.
3.Results
The descriptive statistics were used to find out the possible barriers to accepting new technologies. Table 2 demonstrates these main factors.
Table 2. Possible barriers of accepting new technologies
Barriers n %
Cost 62 67.4
Security problems 31 33.7 Privacy problems 26 28.3 Necessity of follow new versions 23 25 Need for technical support 20 21.7 Being under stress 12 13 Necessity of training to learn 8 8.7
According to the results, 67.4% of the students state that cost of the new technologies is main barrier to accepting these technological innovations. Security problems (33.7%) and privacy problems (28.3%) are considered as other factors which have an effect for the acceptance. Lastly, 25% of the students believe that following new versions of the technologies can be considered as another barrier.
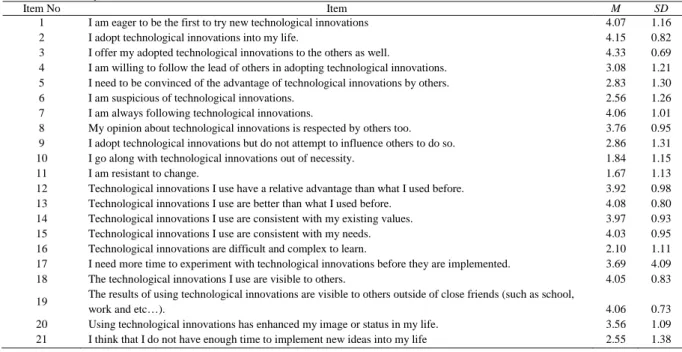
As for main instrument which was administered to determine students’ perceptions of the technological innovations, Table 3 presents the item descriptions, item means and standard deviations for each item.
Table 3. Survey Items
Item No Item M SD
1 I am eager to be the first to try new technological innovations 4.07 1.16 2 I adopt technological innovations into my life. 4.15 0.82 3 I offer my adopted technological innovations to the others as well. 4.33 0.69 4 I am willing to follow the lead of others in adopting technological innovations. 3.08 1.21 5 I need to be convinced of the advantage of technological innovations by others. 2.83 1.30 6 I am suspicious of technological innovations. 2.56 1.26 7 I am always following technological innovations. 4.06 1.01 8 My opinion about technological innovations is respected by others too. 3.76 0.95 9 I adopt technological innovations but do not attempt to influence others to do so. 2.86 1.31 10 I go along with technological innovations out of necessity. 1.84 1.15
11 I am resistant to change. 1.67 1.13
12 Technological innovations I use have a relative advantage than what I used before. 3.92 0.98 13 Technological innovations I use are better than what I used before. 4.08 0.80 14 Technological innovations I use are consistent with my existing values. 3.97 0.93 15 Technological innovations I use are consistent with my needs. 4.03 0.95 16 Technological innovations are difficult and complex to learn. 2.10 1.11 17 I need more time to experiment with technological innovations before they are implemented. 3.69 4.09 18 The technological innovations I use are visible to others. 4.05 0.83 19 The results of using technological innovations are visible to others outside of close friends (such as school,
work and etc…). 4.06 0.73
20 Using technological innovations has enhanced my image or status in my life. 3.56 1.09 21 I think that I do not have enough time to implement new ideas into my life 2.55 1.38
It is good to reveal that students are recommending others to use technological innovations like innovation agents (item 3, M=4.33) while adapting these innovations into their lives initially (item 2, M=4.15) and following innovations all the time (item 7, M=4.06). Moreover, the students perceive that technological innovations are bringing goodness to their lives (item 13, M=4.08) and are in harmony with their current needs (item 15, M=4.03). On the other hand, there seems to be a moderate level of suspiciousness regarding technological innovations (item 6, M=2.56) and having time for putting them into practice (item 21, M=2.55).
The differences in perspectives to perceptions regarding technological innovations between gender variable were statistically checked by Mann-Whitney U Test for each item. Table 4 depicts only the significant items.
Table4. The differences between items in relation to gender
Item No N U Mean Rank Z p
Female Male
4 92 505.5 57.23 43.52 -2.086 .037 21 92 362.0 28.60 51.47 -3.48 .000
A Mann-Whitney U Test revealed significant differences in the item 4 and item 21 for males (Md = 3.00, n = 92) and females (Md = 4.00, n = 92), U = 505.5 (item 4) and U = 362.00 (item 21), z = -2.086 (item 4) and z = -3.48 (item 21), p = .037 (item 4) and p = .000 (item 21). It seems that male students are more enthusiastic about tracking the steps of a leader for newer technologies.
Nonetheless, mean rank of the female (Mean Rank=57.23) was higher than male (Mean Rank==43.52) for item 4, mean rank of the male (Mean Rank==51.47) was higher than female (Mean Rank==28.60) for item 21. Thus, the female students look more reluctant to adapting technological innovations due to the time constraints.
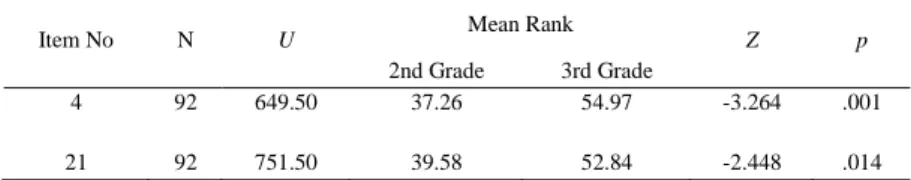
Similarly, A Mann-Whitney U Test was used for each item to determine whether there is a significant difference in students’ perceptions regarding technological innovations for second and third grades students. Table 5 demonstrates only the significant items.
Table 5. The differences between items in relation to grade level
Item No N U Mean Rank Z p
2nd Grade 3rd Grade
4 92 649.50 37.26 54.97 -3.264 .001
21 92 751.50 39.58 52.84 -2.448 .014
A Mann-Whitney U Test revealed significant differences in the item 4 and item 21 for second grades (Md = 2.00,
n = 92) and third grades (Md = 3.50, n = 92), U = 649.50 (item 4) and U = 751.50 (item 21), z = -3.264 (item 4) and z = -2.448 (item 21), p = .001 (item 4) and p = .014 (item 21). Moreover, mean ranks of the 3rd grade (Mean
Rank=54.97 for item 4 and Mean Rank=52.84 for item 21) were higher than mean ranks of the 2nd grade (Mean Rank=37.26 for item 4 and Mean Rank=39.58 for item 21) for both significant items. It might be concluded that due to the more loaded curriculum in third grade, they have less time to realize and adapt technological innovations. The differences in perspectives to perceptions regarding technological innovations between departments variable were statistically checked by Kruskal-Wallis Test for each item. According to the test result, there is no statistically significant difference in students’ perceptions regarding technological innovations across three different departments that students enrolled.
4.Conclusion
In revealing current situation on diffusion of innovation tendencies for students from faculty of engineering, two important items from the questionnaire made a statistically significant difference among participants. The concept of time and administration gained prominence in this research to answer research questions.
In the literature, three prototypical models (simple NPV model, single-purchase model, and repeat-purchase model) have been asserted to ascertain the impact of ambiguity regarding technological improvements on adoption decisions (Smith & Ulu, 2012). Regardless of model considered or followed, time as a factor has played an instrumental role for the decisions. Under the lights of the findings obtained thorough this study are consistent with this theoretical models. Therefore, it can be concluded that creating enough time to adopt new technologies into daily life has been one of the main factors of individuals’ adoption processes.
Diffusion of innovation through a population has been dominated by two types of effects – mass media communications and interpersonal relationships (Sun & Jeyaraj, 2013). Taking innovation attributes (relative advantage, complexity, and compatibility) proposed by Rogers (2013) into account, these attributes have an impact on the person’s intention to adopt and use an innovation. More specifically, personal innovativeness covering individuals’ willingness to use new technologies might be considered as one of the key factors for applying innovation (Sun & Jeyaraj, 2013). That is why some indirect components having an effect on personal adoption of new technologies play an important role. Social influence; to illustrate, can be given as a characteristic or disposition for this understanding. In general, technological administration has an effect on triggering the adoption of technological innovations (Khanagha et al., 2013). Therefore, obtaining try to follow the lead of others which is one of the statistically significant items for this research is consistent with both theoretical and practical research evidences highlighted in the literature.
Although the results of this research are limited to a small number of students from specific engineering departments, these findings confirms the theoretical arguments. On the basis of these findings, this study contributes
to growing empirical diffusion of innovation research. More scientific investigations regarding adoption of technological innovations could be useful for field research for the field.
References
Fraenkel, J. R., & Wallen, N. E. (2009). How to design and evaluate research in education. New York, NY: McGraw-Hill.
Harrison, C., Tomas, C., & Crook, C. (2014). An e-maturity analysis explains intention–behavior disjunctions in technology adoption in UK schools. Computers in Human Behavior, 34, 345-351.
Khanagha, S., Volberda, H., Sidhu, J., & Oshri, I. (2013). Management innovation and adoption of emerging technologies: The case of cloud computing. European Management Review, 10, 51-67.
Pantano, E., & Di Pietro, L. (2012). Understanding consumer’s acceptance of technology based innovations in retailing. Journal of Technology Management & Innovation, 7(4), 1-19.
Ryan, S. P., & Tucker, C. (2012). Heterogeneity and the dynamics of technology adoption. Quantitative Marketing and Economics, 10(1), 63-109. Smith, J. E., & Ulu, C. (2012). Technology adoption with uncertain future costs and quality. Operations Research, 60(2), 262-274.
Sun, Y., & Jeyaraj, A. (2013). Information technology adoption and continuance: A longitudinal study of individuals’ behavioral intentions. Information & Management, 50(7), 457-465.
Savery, C. A. (2005). Innovators or laggards: Surveying diffusion of innovations by public relations practitioners (Doctoral dissertation). Retrieved from http://rave.ohiolink.edu/etdc/view?acc_num=akron1123879994
Zarmpou, T., Saprikis, V., Markos, A., & Vlachopoulou, M. (2012). Modeling users’ acceptance of mobile services. Electronic Commerce Research, 12(2), 225-248.