UNEMPLOYMENT CONTINUES TO DECREASE DUE
TO EMPLOYMENT INCREASES IN CONSTRUCTION AND SERVICES
Seyfettin Gürsel*Gökçe Uysaland Ayşenur AcarAbstract
Seasonally adjusted labor market data shows that non-agricultural unemployment rate decreased from 11.6 percent to 11.3 percent (0.3 percentage point decline) in the period of January 2014. Seasonally adjusted labor market series show that employment increased in all sectors. Employment increases in services had slowed down in the third quarter of 2013, but they have accelerated since the last quarter of 2013. Also, we observe that
employment increase in construction sector has accelerated since the period of August 2013. It increased from 1 million 672 thousand in the period of July 2013 to 2 million in the period of January 2014. An increase of
approximately 20 percent that is observed in a 6-month period, indicates that the labor market needs to be carefully analyzed.
Strong increases in non-agricultural labor force and employment
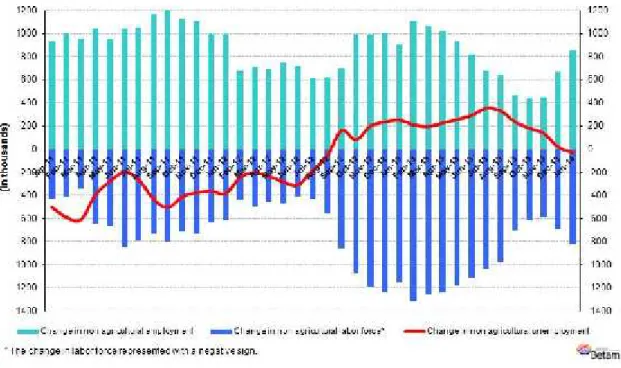
According to the data released by TurkSTAT, non-agricultural labor force increased by 823 thousand (3.8 percent) and non-agricultural employment increased by 852 thousand (4.5 percent) in the period of January 2014 (Figure 1). Consequently, the number of persons unemployed in non-agricultural sectors decreased by 29 thousand. Annual increases in non-agricultural labor force and employment increased over 800 thousand.
Figure 1 Year-on-year changes in non-agricultural labor force, employment and unemployment
Source: TurkSTAT,Betam
A 0.3 percentage point decline in non-agricultural unemployment
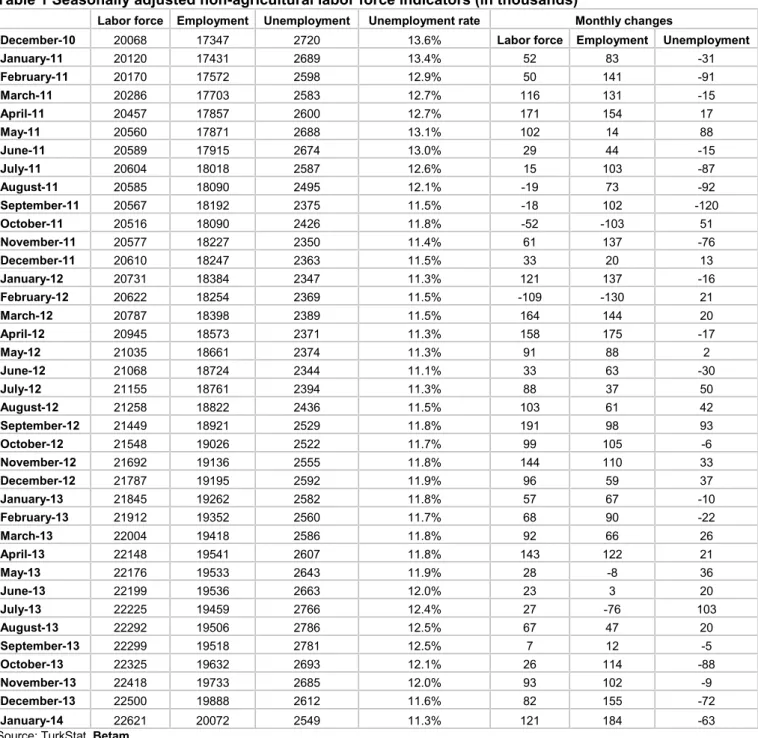
According to seasonally adjusted data, non-agricultural labor force increased by 121 thousand in the period of January 2014 compared to the period of December 2013, and reached 22 million 621 thousand (Figure 2, Table 1).
*Prof. Dr. Seyfettin Gürsel, Betam, Director, [email protected]
Yrd. Doç. Dr. Gökçe Uysal, Betam, Vice Director, [email protected] Ayşenur Acar, Betam, Research Assistant, [email protected]
Labor Market Outlook:
April 2014
www.betam.bahcesehir.edu.tr
2
Non-agricultural employment increased by 184 thousand and reached 20 million 72 thousand. Hence, the number of persons unemployed in non-agricultural sectors decreased by 63 thousand and non-agricultural unemployment rate decreased from 11.6 percent in the period of December 2013 to 11.3 percent in the period of January 2014. Monthly increases in non-agricultural employment have been over 100 thousand since the last quarter of 2013. In the same period, non-agricultural unemployment has been regularly decreasing parallel to the slowdown in the annual increase in the non-agricultural labor force.
Figure 2 Seasonally adjusted non-agricultural labor force, employment and unemployment
Source: TurkStat,Betam
According to Kariyer.net data, non-agricultural unemployment will continue to decrease in the
next period
Our calculations based on the seasonally adjusted application per vacancy statistics calculated using Kariyer.net1
series indicate that we accurately predicted the direction of unemployment for the last two periods. The Kariyer.net series also indicates that non-agricultural unemployment will continue to decrease in the period of January 2014.
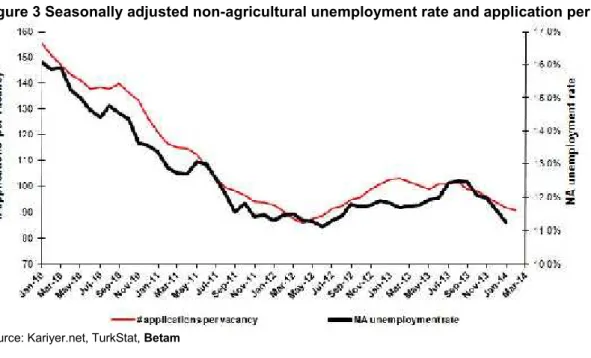
Figure 3 Seasonally adjusted non-agricultural unemployment rate and application per vacancy
Source: Kariyer.net, TurkStat,Betam
1 Betam has been calculating application per vacancy using series released by Kariyer.net for a while. Seasonal and calendar adjustment
procedure is applied to application per vacancy series. A decrease in applications per vacancy may be caused by an increase in vacancies or by a decrease in the number of applications. An increase in vacancies signals economic growth while decreasing number of applications indicates a decrease in number of people looking for a job. Monthly labor market series released by TurkStat is the average of three months. Therefore, application per vacancy statistics calculated using Kariyer.net series is the average of three months as well.
Strong employment increases in construction and service sectors
Seasonally adjusted labor market series show that employment increased in all sectors in the period of January 2014 (Table 2, Figure 4).2 Employment increases in services has slowed down during the period of
June-September 2013 (a monthly average increase of 20 thousand). However, we observe that increase in service employment has accelerated since the last quarter of 2013 (a monthly average increase of 60 thousand).
There have been interesting developments in the construction sector. Construction employment increased by 103 thousand in the period of January 2013 compared to that of December 2013. Construction employment increased from 1 million 672 in the period of July 2013 thousand to 2 million in the period of January 2014. This increase that has been observed in a 6-month period corresponds to a 20 percent increase. We think that this rapid increase needs to be analyzed further. In addition, agricultural employment has been increasing in the last two periods.
2Employment in each sector is seasonally adjusted separately. Hence the sum of these series may differ from the seasonally adjusted series of
www.betam.bahcesehir.edu.tr
4
Figure 4 Employment by sectors (in thousands)3Source: TurkStat,Betam
Table 1 Seasonally adjusted non-agricultural labor force indicators (in thousands)
Labor force Employment Unemployment Unemployment rate Monthly changes
December-10 20068 17347 2720 13.6% Labor force Employment Unemployment
January-11 20120 17431 2689 13.4% 52 83 -31 February-11 20170 17572 2598 12.9% 50 141 -91 March-11 20286 17703 2583 12.7% 116 131 -15 April-11 20457 17857 2600 12.7% 171 154 17 May-11 20560 17871 2688 13.1% 102 14 88 June-11 20589 17915 2674 13.0% 29 44 -15 July-11 20604 18018 2587 12.6% 15 103 -87 August-11 20585 18090 2495 12.1% -19 73 -92 September-11 20567 18192 2375 11.5% -18 102 -120 October-11 20516 18090 2426 11.8% -52 -103 51 November-11 20577 18227 2350 11.4% 61 137 -76 December-11 20610 18247 2363 11.5% 33 20 13 January-12 20731 18384 2347 11.3% 121 137 -16 February-12 20622 18254 2369 11.5% -109 -130 21 March-12 20787 18398 2389 11.5% 164 144 20 April-12 20945 18573 2371 11.3% 158 175 -17 May-12 21035 18661 2374 11.3% 91 88 2 June-12 21068 18724 2344 11.1% 33 63 -30 July-12 21155 18761 2394 11.3% 88 37 50 August-12 21258 18822 2436 11.5% 103 61 42 September-12 21449 18921 2529 11.8% 191 98 93 October-12 21548 19026 2522 11.7% 99 105 -6 November-12 21692 19136 2555 11.8% 144 110 33 December-12 21787 19195 2592 11.9% 96 59 37 January-13 21845 19262 2582 11.8% 57 67 -10 February-13 21912 19352 2560 11.7% 68 90 -22 March-13 22004 19418 2586 11.8% 92 66 26 April-13 22148 19541 2607 11.8% 143 122 21 May-13 22176 19533 2643 11.9% 28 -8 36 June-13 22199 19536 2663 12.0% 23 3 20 July-13 22225 19459 2766 12.4% 27 -76 103 August-13 22292 19506 2786 12.5% 67 47 20 September-13 22299 19518 2781 12.5% 7 12 -5 October-13 22325 19632 2693 12.1% 26 114 -88 November-13 22418 19733 2685 12.0% 93 102 -9 December-13 22500 19888 2612 11.6% 82 155 -72 January-14 22621 20072 2549 11.3% 121 184 -63
6
Table 2 Seasonally adjusted employment by sector (in thousands)Agriculture Manufacturing Construction Service Monthly changes
December-10 6033 4642 1562 11144 Agriculture Manufacturing Construction Service
January-11 6034 4656 1568 11207 2 14 6 63 February-11 6188 4652 1618 11302 153 -4 50 95 March-11 6198 4790 1624 11289 11 138 6 -13 April-11 6074 4828 1628 11401 -124 38 4 112 May-11 6016 4777 1652 11443 -58 -51 24 42 June-11 6090 4697 1666 11552 74 -80 15 109 July-11 6110 4710 1691 11616 19 13 25 65 August-11 6183 4682 1753 11656 73 -28 61 39 September-11 6122 4707 1758 11727 -61 25 6 71 October-11 6191 4657 1677 11756 68 -50 -81 29 November-11 6167 4700 1657 11870 -23 43 -20 114 December-11 6053 4701 1640 11907 -115 1 -18 37 January-12 6050 4685 1710 11989 -3 -16 71 82 February-12 6040 4684 1577 11993 -10 -1 -133 4 March-12 6025 4721 1580 12097 -16 37 3 104 April-12 6055 4792 1647 12134 30 71 67 37 May-12 6106 4760 1708 12193 52 -32 61 59 June-12 6048 4761 1720 12243 -58 1 11 50 July-12 6046 4778 1702 12282 -2 17 -18 38 August-12 6045 4745 1741 12336 -1 -33 40 54 September-12 6148 4735 1768 12418 103 -10 26 82 October-12 6219 4732 1781 12513 71 -3 13 95 November-12 6204 4814 1782 12541 -15 82 1 28 December-12 6140 4856 1785 12554 -64 42 3 14 January-13 6107 4870 1828 12564 -33 14 44 9 February-13 6142 4886 1841 12625 35 16 12 62 March-13 6118 4948 1805 12665 -24 62 -36 40 April-13 6100 5030 1807 12703 -18 82 2 38 May-13 6026 5044 1724 12765 -74 14 -84 62 June-13 5969 5015 1740 12780 -57 -29 17 15 July-13 5966 4991 1672 12796 -3 -24 -68 16 August-13 5992 4964 1715 12827 26 -27 43 31 September-13 6015 4914 1756 12848 23 -50 41 21 October-13 5927 4899 1846 12887 -89 -15 90 39 November-13 5907 4927 1859 12947 -20 28 14 60 December-13 5962 4956 1900 13032 55 29 41 85 January-14 6016 4967 2003 13102 54 11 103 70