Volume 2 (2012) | ISSN 2158-8708 (online) | DOI 10.5195/emaj.2012.28 | http://emaj.pitt.edu
THE CASE FOR GOLD REVISITED: A SAFE HAVEN OR A
HEDGE ?
Sudi Apak
Vedat Akman
Beykent University Beykent University
e-mail: [email protected]
Serkan Çankaya
Sıtkı Sönmezer
Beykent University Beykent University
e-mail: [email protected] e-mail: [email protected]
Abstract
This paper attempts to analyze the relation among gold prices and other macroeconomic and financial variables and addresses the question whether gold is a safe haven or a hedge for investors. The study investigates the relationship by using an econometric analysis for top gold exporter and importer countries, for a sample period of 11 years from 2000 to 2011. The results are twofold (i) return of silver, USD returns and change in the volatility index influences gold returns positively whereas, Swiss Franc and Canadian Dollar returns influence gold returns negatively regardless of presence of the 2008 crisis. (ii) In times of stress, our findings indicate that Swiss Franc, Norwegian Krone and Canadian Dollar function as haven whereas, on average, Swiss Franc, Canadian Dollar and 10 year US treasuries function as a hedge against gold but the results show no evidence for the US dollar.
Keywords: Exchange rates, Gold, Hedge, Safe Haven, GARCH
This work is licensed under a Creative Commons Attribution-Noncommercial-No Derivative
Works 3.0 United States License.
This journal is published by the University Library System of the University of Pittsburgh as part of its D-Scribe Digital Publishing Program, and is cosponsored by the University of Pittsburgh Press
Volume 2 (2012) | ISSN 2158-8708 (online) | DOI 10.5195/emaj.2012.28
|
http://emaj.pitt.edu
The Case for Gold Revisited: A
Safe Heaven or A Hedge ?
Sudi Apak
Vedat Akman
Serkan Çankaya
Sıtkı Sönmezer
I.
Introduction
Gold is used as a standard measure up until the termination of Bretton Woods system by President Nixon in 1971 and as a precious metal for centuries throughout the world. Not more than a decade ago, gold was undermined as an investment by the investors and funds due to its relative poor return performance; most of the funds have chosen not to allocate any funds to gold and the ones that invest in gold have considered the slight diversification benefit it has offered and thus, have allocated a tiny portion of their portfolios.
Turnaround for gold emerged with the global crisis of 2008 and it has gained value steadily at a period when precipitous falls in the stock markets were ubiquitous; interest rates were unattractive; the rumors about the European countries were rampant, increasing the eminent default risks. Inevitably, gold has almost tripled its value in US dollar terms and gold market train and its possible route became the center of attention for the majority of investors.
Despite the fact that gold prices are set internationally in foreign exchanges, countries like India and Turkey have significant cultural and psychological rationale in demanding gold. India, solely contributes almost one third of the world demand for gold as of jewellery, total bar and coin (World Gold Council, 2012). Therefore it may be necessary to incorporate financial data of both gold producer countries and gold consuming countries when gold prices are under study. This paper attempts to analyze the relation among gold prices and other macroeconomic and financial variables and
addresses the question whether gold is a safe haven or a hedge for investors.
II.
Literature Review
Koutsoyiannis (1983) finds a strong relation between gold prices and the state of the US economy. Similarly, US money supply and PPI announcements’ impacts on gold prices have been evidenced in the study of Tandon and Urich (1987). Especially, unanticipated growth in money supply increases the gold price volatility (Bailey, 1988). According to Christie-David et al. (2000), gold prices react strongly to CPI, unemployment rate, GDP and PPI announcements but not to federal deficit announcements. Cai et al. (2001) have investigated the factors that move the gold market and have found that employment reports, GDP, CPI and personal income have an important role in moving the prices of gold.
Baker and Van-Tassel (1985) show evidence that price of the gold is determined by the future inflation rate. Levin et al. (2004) demonstrated that price of gold rises over time at the rate of inflation and be an effective hedge against inflation. However, Lawrance (2003) have found no significant relationship between gold prices and inflation, GDP and interest rates.
Existence of psychological barriers in gold prices has been examined and it is also stated that traditions play an important role in determining the demand for gold and as a store of value especially during crisis (Aggarwal and Lucey, 2007). Xu and Fung (2005) have used a bivariate asymmetric GARCH model to examine the information flow across the US and Japanese markets for gold, platinum and silver future contracts and proved that volatility spillover among the markets is strong but US market was more dominant. Nakamura and Small (2007) showed that gold prices and crude oil prices exhibit a random walk. Tully and Lucey (2007) have examined the effect of macroeconomic shocks on
The Case for Gold Revisited: A Safe Heaven or A Hedge ?
Volume 2 (2012) | ISSN 2158-8708 (online) | DOI 10.5195/emaj.2012.28 | http://emaj.pitt.edugold prices with APGARCH models and show evidence that US dollar has significance on the gold price volatility.
Zhang and Wei (2010) have examined the co-integration, causality and price discovery between the gold market and crude oil market for the time period of 2000-2008. In this period, the correlation of them was significant, 0.9295, and crude oil price change linearly Granger causes the volatility of gold price but no evidence is found for the reverse. Their results also show that the influence of crude oil on global development is wider than gold and crude oil is a more interesting investment option for the investors for the period under study.
Joy (2011) defines an asset as haven when it is uncorrelated or negatively correlated to an underlying asset in times of stress. Whereas when it is uncorrelated or negatively correlated to an underlying asset on average, it is called a hedge. He has studied the period between 1986 and 2008 and has used the DCC-GARCH model to indicate that gold is a hedge against the US dollar especially in the recent times of the study but provide no evidence of gold being the safe haven for US dollar. Baur & Lucey (2010) investigated the existence of a hedge and a safe haven in US, UK and German stock and bond prices and returns and their relationship with gold prices. They found that gold is a hedge against stocks and gold is a safe haven in extreme stock market conditions and lastly gold is a safe haven for stocks only for 15 trading days after an extreme shock occurred. Capie, Mills and Wood (2005) analyzes the role of gold as a hedge against the dollar and found a negative relationship between gold and other foreign exchange rates.
III.
Data and Methodology
3.1 DataData consists of daily gold prices per ounce as a dependent variable and to explain the change in the dependent variable, a set of exchange rates of top
gold exporter and gold importer countries, a subset of alternative assets including bond returns, return of oil prices and silver prices, and credit default swaps of some emerging countries are used. Independent variables are refined after eliminating the insignificant ones. Two periods are used: one had 2768 observations, between 24.10.2000 – 07.10.2011; and the other period starts with the global crisis up until 07.10.2011 with 1074 observations.
This study employs currencies of countries that are the leading gold exporters and importers. Namely, India, China, Turkey, Russia, USA, Indonesia, Euro zone countries, Switzerland and UK are among the top gold demanding countries whereas, China, Australia, USA, South Africa, Russia, Canada and Indonesia are among the significant producers in World gold production according to the reports of World Gold Council (2011). Our data are sourced from Thompson Reuters. Closing prices are used for the independent variables and daily returns are analyzed in natural logarithms as follows:
Rj,t = ln (pj,t/pj,t-1) (1)
where Rj,t is the return of variable j at time t
and pt is the price of variable j at time t.
3.2 Methodology
GARCH (1,1) model has been applied for both of the periods as both the model assumes volatility arising from innovations in the market is symmetrical (Tully and Lucey, 2007) and a likelihood ratio test supports this model. Tables 3 and 4 are derived from the GARCH(1,1) model.
The GARCH model is a general autoregressive conditional heteroskedastic model. GARCH regresses on lagged terms. The conditional variance is dependent upon its own lags. The equation for GARCH(1,1) is:
where is the weighted long run variance and the updated forecast of variance is a function of the most recent variance forecast , and the most recent squared prediction error, . In this case, if there is an unexpectedly large increase or decrease in asset return at time t then this will generate an increase in the expected variability in the next period. In this study, STATA ®software is used to compute the summary statistics and the GARCH models.
IV.
Result
4.1 Summary Statistics
Summary statistics of the data are displayed in Table 1 for the entire period and for the crisis period. Augmented Dickey-fuller test has been conducted for the unit root test and stationary of the data are evidenced for both of the periods. Normality tests show that data is normal and kurtosis amounts are reasonable.
4.2 Results: 2000 – 2011
Tests have been applied to select the significant currencies either among major currencies or among the leading gold importing/exporting countries and credit default swaps (CDS) of emerging countries; Russian and South African credit default swaps’ returns are found to be significant and are incorporated into the model whereas, Swiss franc’s, US Dollar’s, Norwegian Krone’s, Canadian Dollar’s, Chinese Yuan’s and South African Rand’s returns are incorporated into the model with a similar fashion. The remaining significant independent variables were namely; return of 10 year US treasury bonds, return of oil prices, return of silver and a volatility index, VIX.
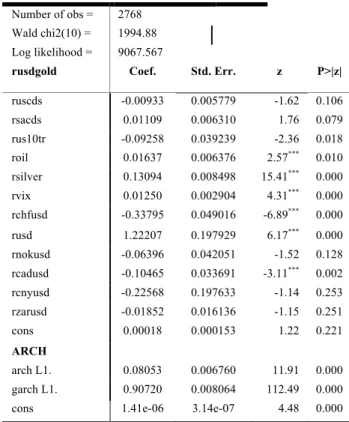
Table 2 GARCH model estimation results for the
2000-2011 period Number of obs = 2768 Wald chi2(10) = 1994.88 Log likelihood = 9067.567
rusdgold Coef. Std. Err. z P>|z|
ruscds -0.00933 0.005779 -1.62 0.106 rsacds 0.01109 0.006310 1.76 0.079 rus10tr -0.09258 0.039239 -2.36 0.018 roil 0.01637 0.006376 2.57*** 0.010 rsilver 0.13094 0.008498 15.41*** 0.000 rvix 0.01250 0.002904 4.31*** 0.000 rchfusd -0.33795 0.049016 -6.89*** 0.000 rusd 1.22207 0.197929 6.17*** 0.000 rnokusd -0.06396 0.042051 -1.52 0.128 rcadusd -0.10465 0.033691 -3.11*** 0.002 rcnyusd -0.22568 0.197633 -1.14 0.253 rzarusd -0.01852 0.016136 -1.15 0.251 cons 0.00018 0.000153 1.22 0.221 ARCH arch L1. 0.08053 0.006760 11.91 0.000 garch L1. 0.90720 0.008064 112.49 0.000
cons 1.41e-06 3.14e-07 4.48 0.000
* Indicates statistical significance at the 10% level ** Indicates statistical significance at the 5% level *** Indicates statistical significance at the 1% level
A GARCH (1,1) model shows us the estimated coefficients in Table 2. Silver, as a substitute, has the largest influence on the gold prices with a z-statistic of 15.41 (99 % significant). USD returns are conforming to the earlier studies and it is the most influencing currency on gold prices with a z-statistic of 6.17 (99 % significant). Volatility index is also significant with a z-statistic of 4.31 (99 % significant) which may indicate that at times of uncertainty, gold prices gain value. Return of oil prices with a z-statistic of 2.57 is hardly significant at 99 % but South African CDSs with a z- statistic of 1.76 is significant at 90 %. Swiss Franc has the most significant negative coefficient with a zstatistic of -6.89 (99 % significant), Canadian Dollar has a significant (99 %) negative coefficient of -3,11 and
The Case for Gold Revisited: A Safe Heaven or A Hedge ?
Volume 2 (2012) | ISSN 2158-8708 (online) | DOI 10.5195/emaj.2012.28 | http://emaj.pitt.edu10 year US treasuries has a significant negative coefficient of -2,36 (95 %).
4.3 Results: 2008 – 2011
Similarly, numerous tests have been applied to select the significant currencies either among major currencies or among the leading gold importing/exporting countries and credit default swaps (CDS) of emerging countries; Russian and South African credit default swaps’ returns are found to be significant and are incorporated into the model whereas, Swiss franc’s, US Dollar’s, Norwegian Krone’s, Canadian Dollar’s, Chinese Yuan’s and South African Rand’s returns are incorporated to the model with a similar fashion. The remaining significant independent variables were namely; return of 10 year US treasury bonds, return of oil prices, return of silver and a volatility index, VIX.
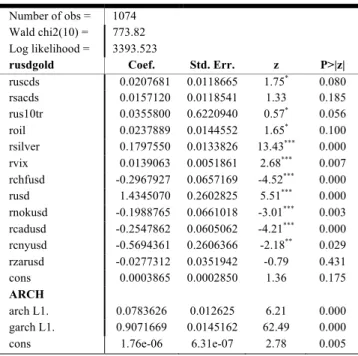
Table 3 GARCH model estimation results for the
2008-2011 period Number of obs = 1074 Wald chi2(10) = 773.82 Log likelihood = 3393.523
rusdgold Coef. Std. Err. z P>|z|
ruscds 0.0207681 0.0118665 1.75* 0.080 rsacds 0.0157120 0.0118541 1.33 0.185 rus10tr 0.0355800 0.6220940 0.57* 0.056 roil 0.0237889 0.0144552 1.65* 0.100 rsilver 0.1797550 0.0133826 13.43*** 0.000 rvix 0.0139063 0.0051861 2.68*** 0.007 rchfusd -0.2967927 0.0657169 -4.52*** 0.000 rusd 1.4345070 0.2602825 5.51*** 0.000 rnokusd -0.1988765 0.0661018 -3.01*** 0.003 rcadusd -0.2547862 0.0605062 -4.21*** 0.000 rcnyusd -0.5694361 0.2606366 -2.18** 0.029 rzarusd -0.0277312 0.0351942 -0.79 0.431 cons 0.0003865 0.0002850 1.36 0.175 ARCH arch L1. 0.0783626 0.012625 6.21 0.000 garch L1. 0.9071669 0.0145162 62.49 0.000
cons 1.76e-06 6.31e-07 2.78 0.005
* Indicates statistical significance at the 10% level ** Indicates statistical significance at the 5% level *** Indicates statistical significance at the 1% level
A GARCH (1,1) model shows us the estimated coefficients in Table 3. Silver, as a substitute, has the largest influence on the gold prices with a z-statistic of 13.43 (99 % significant). USD returns are conforming to the earlier studies and it is the most influencing currency on gold prices with a z-statistic of 5.51 (99 % significant). Volatility index is also significant with a z-statistic of 2.68 (99 % significant) which may indicate that at times of uncertainty, gold prices gain value. Oil prices with a z-statistic of 1.65 and Russian CDSs with a z-statistic of 1.75 are also significant yet, 90 %. It is worth to note that for hedging purposes, Swiss Franc, Norwegian Krone and Canadian Dollar have significant (99 %) negative coefficients -4,52, -3,01 and -4,21 respectively and Chinese Yuan has a significant negative coefficient of -2,18 (95 %).
V.
Conclusion
This paper has examined the fit of the GARCH model for gold returns and provides evidence that return of silver, USD returns and change in the volatility index influences gold returns positively whereas, Swiss Franc and Canadian Dollar returns influence gold returns negatively regardless of presence of the 2008 crisis.
In times of stress, our findings indicate that Swiss Franc, Norwegian Krone and Canadian Dollar function as haven whereas, on average, Swiss Franc, Canadian Dollar and 10 year US treasuries function as a hedge against gold but we provide no evidence for the US dollar therefore our findings support the study of Joy (2011).
VI.
References
1. Koutsoyiannis, A.: A short-run pricing model for a speculative asset, tested with data from the gold bullion market. Applied Economics. 15, 563-581(1983)
2. Tandon, K., and T., Urich.: International Market Response to Announcements of US
Macroeconomic Data. Journal of International Money and Finance. 6, (1987)
3. Levin, E.J., P. Macmillan, R.E. Wright and D. Ghosh.: Gold as an Inflation Hedge? Studies in Economics and Finance. 22(1),1-25 (2004)
4. Baker S.A. and Van-Tassel, R.C.: Forecasting the price of gold: A fundamentalist approach. 12(4), 43-51 (1985)
5. Baur, DG and Lucey, BM.: Is Gold a Hedge or a Safe Haven? An Analysis of Stocks, Bonds and Gold. Financial Review. 45, 217–229, (2010)
6. Capie, F., T. C. Mills and G. Wood.: Gold as a Hedge against the Dollar. Journal of International Financial Markets, Institutions and Money. 15(4), 343-352, (2005)
7. David, H., D. Paul and F. Robert.: Do Precious Metals Shine? An Investment Perspective. Financial Analysts Journal. 62(2), 98, (2006)
8. W. Bailey.: Moneysupply announcements and the ex ante volatility of asset pricesJ. Money, Credit Banking. 20, 611–620, (1988)
9. Rohan Christie–David, Mukesh Chaudhryb, Timothy W. Koch.: Do macroeconomics news
releases affect gold and silver prices? Journal of Economics and Business. 52(5), 405–421,
(September–October 2000)
10. Cai, J., Cheung, Y. -L., & Wong, M. C. S.: What moves the gold market? Journal of Futures
Markets. 21(3), 257–278, (2001)
11. Stephan A. Baker, Roger C. van Tassel,: Forecasting the price of gold: A fundamentalist approach. Atlantic Economic Journal. 13(4), 43-51, (1985)
12. Lawrence, C.: Why is Gold Different from Other Assets? An Empirical Investigation, World Gold Council, London (2003)
13. World Gold Council, Gold Demand Trends 2012 Q1 report, 2012,
http://www.gold.org/investment/research/regular_reports/gold_demand_trends/, Accessed
27 May 2012
14. Aggarwal, R. and B.M. Lucey,: Psychological barriers in gold prices? Review of Financial
Economics. 16 (2), 217–230, (2007)
15. Xu, X., and Fung, H.: Cross-market linkages between U.S and Japanese precious metals futures trading. International Financial Markets, 15(2), 107-124, (2005)
The Case for Gold Revisited: A Safe Heaven or A Hedge ?
Volume 2 (2012) | ISSN 2158-8708 (online) | DOI 10.5195/emaj.2012.28 | http://emaj.pitt.edu16. T. Nakamura and M. Small: Tests of the random walk hypothesis for financial data. Physica A, 377, 599-615, (2007)
17. Tully, E. and B.M. Lucey,: A power GARCH examination of the gold market, Research in International Business and Finance. 21(2), 316–325, (2007)
18. Zhang, Y.J. and Y.M. Wei: The Crude Oil Market and the Gold Market: Evidence for
Cointegration, Causality and Price Discovery, Resources Policy. 35(3), 168-77, (2010)
19. Mark, Joy,: Gold and the US dollar: Hedge or haven?, Finance Research Letters. Elsevier,
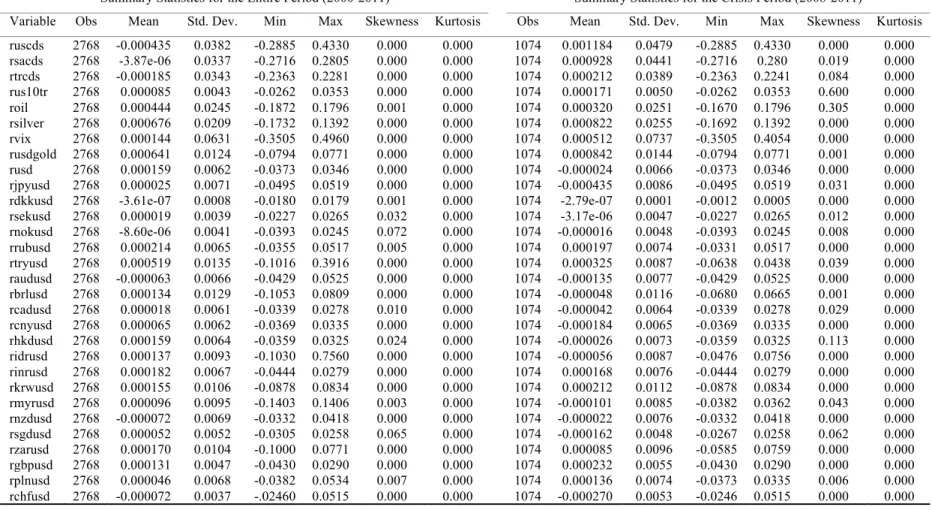
Table 1 Summary Statistics
Summary Statistics for the Entire Period (2000-2011) Summary Statistics for the Crisis Period (2008-2011)
Variable Obs Mean Std. Dev. Min Max Skewness Kurtosis Obs Mean Std. Dev. Min Max Skewness Kurtosis
ruscds 2768 -0.000435 0.0382 -0.2885 0.4330 0.000 0.000 1074 0.001184 0.0479 -0.2885 0.4330 0.000 0.000 rsacds 2768 -3.87e-06 0.0337 -0.2716 0.2805 0.000 0.000 1074 0.000928 0.0441 -0.2716 0.280 0.019 0.000 rtrcds 2768 -0.000185 0.0343 -0.2363 0.2281 0.000 0.000 1074 0.000212 0.0389 -0.2363 0.2241 0.084 0.000 rus10tr 2768 0.000085 0.0043 -0.0262 0.0353 0.000 0.000 1074 0.000171 0.0050 -0.0262 0.0353 0.600 0.000 roil 2768 0.000444 0.0245 -0.1872 0.1796 0.001 0.000 1074 0.000320 0.0251 -0.1670 0.1796 0.305 0.000 rsilver 2768 0.000676 0.0209 -0.1732 0.1392 0.000 0.000 1074 0.000822 0.0255 -0.1692 0.1392 0.000 0.000 rvix 2768 0.000144 0.0631 -0.3505 0.4960 0.000 0.000 1074 0.000512 0.0737 -0.3505 0.4054 0.000 0.000 rusdgold 2768 0.000641 0.0124 -0.0794 0.0771 0.000 0.000 1074 0.000842 0.0144 -0.0794 0.0771 0.001 0.000 rusd 2768 0.000159 0.0062 -0.0373 0.0346 0.000 0.000 1074 -0.000024 0.0066 -0.0373 0.0346 0.000 0.000 rjpyusd 2768 0.000025 0.0071 -0.0495 0.0519 0.000 0.000 1074 -0.000435 0.0086 -0.0495 0.0519 0.031 0.000 rdkkusd 2768 -3.61e-07 0.0008 -0.0180 0.0179 0.001 0.000 1074 -2.79e-07 0.0001 -0.0012 0.0005 0.000 0.000 rsekusd 2768 0.000019 0.0039 -0.0227 0.0265 0.032 0.000 1074 -3.17e-06 0.0047 -0.0227 0.0265 0.012 0.000 rnokusd 2768 -8.60e-06 0.0041 -0.0393 0.0245 0.072 0.000 1074 -0.000016 0.0048 -0.0393 0.0245 0.008 0.000 rrubusd 2768 0.000214 0.0065 -0.0355 0.0517 0.005 0.000 1074 0.000197 0.0074 -0.0331 0.0517 0.000 0.000 rtryusd 2768 0.000519 0.0135 -0.1016 0.3916 0.000 0.000 1074 0.000325 0.0087 -0.0638 0.0438 0.039 0.000 raudusd 2768 -0.000063 0.0066 -0.0429 0.0525 0.000 0.000 1074 -0.000135 0.0077 -0.0429 0.0525 0.000 0.000 rbrlusd 2768 0.000134 0.0129 -0.1053 0.0809 0.000 0.000 1074 -0.000048 0.0116 -0.0680 0.0665 0.001 0.000 rcadusd 2768 0.000018 0.0061 -0.0339 0.0278 0.010 0.000 1074 -0.000042 0.0064 -0.0339 0.0278 0.029 0.000 rcnyusd 2768 0.000065 0.0062 -0.0369 0.0335 0.000 0.000 1074 -0.000184 0.0065 -0.0369 0.0335 0.000 0.000 rhkdusd 2768 0.000159 0.0064 -0.0359 0.0325 0.024 0.000 1074 -0.000026 0.0073 -0.0359 0.0325 0.113 0.000 ridrusd 2768 0.000137 0.0093 -0.1030 0.7560 0.000 0.000 1074 -0.000056 0.0087 -0.0476 0.0756 0.000 0.000 rinrusd 2768 0.000182 0.0067 -0.0444 0.0279 0.000 0.000 1074 0.000168 0.0076 -0.0444 0.0279 0.000 0.000 rkrwusd 2768 0.000155 0.0106 -0.0878 0.0834 0.000 0.000 1074 0.000212 0.0112 -0.0878 0.0834 0.000 0.000 rmyrusd 2768 0.000096 0.0095 -0.1403 0.1406 0.003 0.000 1074 -0.000101 0.0085 -0.0382 0.0362 0.043 0.000 rnzdusd 2768 -0.000072 0.0069 -0.0332 0.0418 0.000 0.000 1074 -0.000022 0.0076 -0.0332 0.0418 0.000 0.000 rsgdusd 2768 0.000052 0.0052 -0.0305 0.0258 0.065 0.000 1074 -0.000162 0.0048 -0.0267 0.0258 0.062 0.000 rzarusd 2768 0.000170 0.0104 -0.1000 0.0771 0.000 0.000 1074 0.000085 0.0096 -0.0585 0.0759 0.000 0.000 rgbpusd 2768 0.000131 0.0047 -0.0430 0.0290 0.000 0.000 1074 0.000232 0.0055 -0.0430 0.0290 0.000 0.000 rplnusd 2768 0.000046 0.0068 -0.0382 0.0534 0.007 0.000 1074 0.000136 0.0074 -0.0373 0.0335 0.006 0.000 rchfusd 2768 -0.000072 0.0037 -.02460 0.0515 0.000 0.000 1074 -0.000270 0.0053 -0.0246 0.0515 0.000 0.000
The Case for Gold Revisited: A Safe Heaven or A Hedge ?
Volume 2 (2012) | ISSN 2158-8708 (online) | DOI 10.5195/emaj.2012.28 | http://emaj.pitt.eduNote: The letter “r” at the beginning of each variable stands for the term “return”. The abbreviations used for the variables are: ruscds: the US credit default swaps (CDS), rsacds: the South
African CDS, rtrcds: the Turkish CDS, rus10tr: US 10 year treasury, roil: oil, rsilver: silver, rvix: VIX Index, rusdgold: USD and gold, rusd: USD, rjpyusd: Japanese yen to USD, rdkkusd: Danish krone to USD, rsekusd: Swedish sek to USD, rnokusd: Norwegian kroner to USD, rrubusd: Russian ruble to USD, rtryusd:Turkish lira to USD, raudusd: Australian dolar to USD, rbrlusd: Brazilian real to USD, rcadusd: Canadian dollar to USD, rcnyusd: Chinese renminbi to USD, rhkdusd: Hong kong dollar to USD, ridrusd: Indonesian rupiah to USD, rinrusd: Indian rupee to USD, rkrwusd: South Korean won to USD, rmyrusd: Malaysian ringgit to USD, rnzdusd: New Zealand dollar to USD, rsgdusd: Singapore dollar to USD, rzarusd: South African rand to USD, rgbpusd: British Pound Sterling to USD, rplnusd: polish zloti to USD, rchfusd: Swiss francs to USD