INTRODUCTION
Water quantity and quality has remained critically important issue for all human population in terms of food resources, human health, and sustainability of natural ecosystems. Besides, transformation of forest and rangeland areas into the agricultural lands due to increasing human population leads to more runoff, nutrient leaching and erosion responsible for sediment yield and water pollution (IGBP, 1995).
Turkey is among the countries that highly exposed to soil erosion. The large proportions of the land are very steep (62%) and therefore susceptible to erosion. The major factors that cause erosion include degraded forest lands, unsuitable land use, unfavorable agricultural applications damaging the nature, and overgrazing in rangeland areas. One of the crucial consequences of these factors is increasing sediment delivery to surface water which led to decrease in water quality. Prediction of sediment yield is used to address water quality and pollution problems through a variety of engineering, natural resource conservation planning, and land management methods (Toy et al., 2002).
Many researchers have shown that agricultural applications, human development and changes in land use potentially cause significant adverse effects on water quality (Hoare and Rowe, 1992; Cuffney et al., 2000; Wang, 2001; Berka et al., 2001; Shakoor et al., 2015). Even though the most water quality problems are related to soil erosion, there are also non–point-source pollutions that refer to water pollutions from diffuse sources.
In this study, the factors effecting sediment yield and water quality such as slope, land use and soil type were evaluated in two neighbouring watersheds located in south of Kahramanmaras, Turkey. The reasons behind the effects of these factors on sediment yield and water quality problems were compared between neighbouring watersheds and some suggestions were provided in order to solve these problems. MATERIALS AND METHODS
Study area: The study area, located in the eastern Mediterranean region of Turkey, is southwest of the city of Kahramanmaras. The geographical coordinates of the study area is between the latitudes of 38°03’10” and 38°45’14’’ north, the longitudes of 36°32’11’’ and 36°54’09’’ east. In the study area, there are two watersheds including Goksun watershed and Hurman watersheds (Fig. 1). Sediment yield and water quality data were obtained from two Stream Observation Stations located in Goksun (numbered as 20-06) and Hurman (numbered as 20-15) watersheds. The land use/cover of the study area consists of agriculture, forest, rangeland, bare rock, water bodies, and residential places. The watersheds are considered as neighbouring watersheds since the climatic (precipitation, temperature) and some of the physiographic (elevation, area) characteristics were similar in both neighbouring watersheds.
Average annual precipitation was about 755 mm. Climate of the study area falls within Mediterranean and Continental climate regime and average temperature is about 18.1°C ISSN (Print) 0552-9034, ISSN (Online) 2076-0906
DOI: 10.21162/PAKJAS/16.2056
http://www.pakjas.com.pk
ASSESSMENT OF SEDIMENT YIELD AND WATER QUALITY FOR TWO
NEIGHBOURING WATERSHEDS IN KAHRAMANMARAS, TURKEY
Mahmut Reis
1,*, Turgay Dindaroglu
1and Abdullah Emin Akay
21Kahramanmaras Sutcu Imam University, Faculty of Forestry, Department of Forest Engineering, Kahramanmaras, Turkey; 2Bursa Technical University, Faculty of Forestry, Department of Forest Engineering, Bursa, Turkey.
*Corresponding author’s e-mail: [email protected]
Accurate estimation of sediment yield and water quality in a watershed may assist watershed managers to make correct and appropriate decisions. In this study, two neighbouring watersheds (Goksun and Hurman) located in south of Kahramanmaras, Turkey were evaluated in terms of their average annual sediment yield and water quality. The differences between these watersheds with respect to sediment yield and water quality were compared and then the reasons behind these differences were investigated. The climatic (precipitation, temperature) and some of the physiographic (elevation, area) characteristics were similar in both neighbouring watersheds. Therefore, three factors including ground slope, land use, and soil type were determined to evaluate sediment yield and water quality for both neighbouring watersheds. The results indicated that forests reduced sediment yield by tolerating negative consequences of other factors in the watershed areas. On the other hand, water quality was found to be low in a watershed area with relatively dense forest cover. The reason for this contradiction can be explained with effect of intense urbanization and consequent increase of population in the watershed.
(TMGS, 2011). The average elevations of Goksun and Hurman watersheds were 1589 m and 1454 m, respectively. The areas of the watersheds were 575 km2 and 610 km2,
respectively. Therefore, ground slope, land use, and soil type were considered to evaluate sediment yield and water quality for both neighbouring watersheds.
Figure 1. Location of a) Goksun and b) Hurman watersheds.
Methods: Topographic maps of the study area (1:25 000) were used as an input for producing Digital Elevation Model (DEM). Then, ArcGIS 10 tools were employed to extract ground slope maps. Soil type map (1:25000) and land use map (1:25000) were obtained from General Directorate of Combating Desertification and Erosion in Turkey (TGDCE, 2000). The current data of sedimentation and water quality for Goksun and Hurman watersheds were obtained from General Directorate of Renewable Energy (TGDRE) in Turkey (TGDRE, 2010). Sediment measurements were performed based on "Depth Integration Method" by using US.DH-48 and the US.D-49 suspended sediment sampling equipment according to the techniques of Water-Resources Investigations of the U.S. Geological Survey (Harold et al, 1970). Then, suspended sediment amounts (tons/day) were determined by using following formula (1):
Qs = Q x C x 0, 0864 (1)
Qs: Amount of sediment daily, (tons/day), Q: Measured flow
(m³/sn), C : Sediment concentration calculated in laboratory (ppm)
Where sediment concentration was computed based on collected sampling measurements (ppm) from stream monitoring station (Julien, 1995):
(2)
Water quality measurements were performed based on US Salinity Laboratory guide (Richards, 1954) and Sodium Absorption Rate (SAR) methods (Sahinci, 1991). In the
analyses were conducted by GDRE to compute discharge(m3/s) (TSE, 1979), water temperature (°C),
electrical conductivity (EC*106 at 25°C) by Conductance
Bridge, hydrogen-ion concentration (pH) by pH meter , sodium(Na+), potassium (K+) by Fleym Fotometric method,
calsium+magnessium (Ca++ + Mg++) titration by EDTA
(ethylene diamine tetra acetic acid) (Tuzuner, 1990).
Content of sodic in irrigation waters was measured by the most widely used classification method (SAR) as follows (Sahinci, 1991):
SAR= (3)
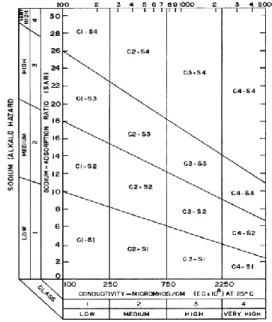
If the SAR value is less than 10, the water quality was in very good characteristics as irrigation water, while it was in Good and Average characteristics if SAR value is from 10 to 18 and from 18 to 26, respectively. Water quality was in bad characteristics as irrigation water if the SAR value is more than 26. Water quality was also evaluated by considering the US Salinity Laboratory guide (Richards, 1954). The Figure 2 indicates the evaluation chart for this guide.
Residual sodium carbonate index (RSC) indicated alkalinity in the water of soil. RSC formula as follows (Eaton, 1950).
RSC index = [HCO3 + CO3] − [Ca + Mg] (4)
If the RSC value is less than 1.25, the water quality was in good characteristic as irrigation water, while it was in Average and Poor characteristics 1.25 to 2.50 and more than 2.50 respectively.
Figure 2. US salinity laboratory water quality chart (Richards, 1954).
RESULTS AND DISCUSSION
Slope maps of the neighbouring watersheds were classified into six slope classes (Fig. 3 & 4). The areal distribution of the ground slope for both watersheds was given in Table 1.
a
approximately 27 and 19% for Goksun and Hurman watersheds, respectively. It was found that ground slope was classified as high to steep slopes in 72% and 48% of the neighbouring watersheds, respectively. Therefore, most of the study area is susceptible to soil erosion due to topographic conditions (Sensoy and Palta, 2009).
Table 1. Slope and surface coverage areas of Goksunand Hurman watersheds.
Slope classes Goksun
Watershed Hurman Watershed (km2) (%) (km2) (%) Flat (0-2%) 83.00 14.43 154.00 25.25 Low (2-6%) 27.30 4.75 111.00 18.20 Medium (6-12%) 49.70 8.64 51.00 8.36 High (12-20%) 57.20 9.95 66.90 10.97 Very High (20-30%) 99.30 17.27 150.10 24.61 Steep (>30%) 258.50 44.96 77.00 12.62
Figure 3. Slope maps of Goksun watershed.
Figure 4. Slope maps of Hurman watershed.
The land use map of the study area indicated that there were five different land use types in neighbouring watersheds (Fig. 5 & 6). According to the results, land use type that covers the largest area in Goksun watershed was forest (61.9%), followed by agriculture (24%) and rangeland (11.6%) (Table 2). On the other hand, land use type that covers the largest area in Hurman watershed was agriculture (45.2%), followed by rangeland (42.8%) and forest (11.4%). The existence of vegetation, especially forest cover, plays important role in preventing surface runoff and sediment yield as well.
Table 2. Land use type of Goksun and Hurman watersheds.
Land use type Goksun Watershed Hurman Watershed (km2) (%) (km2) (%) Forest 356.00 61.91 69.6 11.41 Agriculture 138.00 24.00 276.0 45.25 Rangeland 66.77 11.61 260.9 42.77 Water 2.73 0.47 1.2 0.20 Settlement 11.50 2.00 2.3 0.38
Figure 5. Map of land use type of Goksun Stream watersheds.
Figure 6. Map of land use type of Hurman Stream watersheds.
According to the soil maps, soil types and their spatial distribution in Goksun and Hurman watersheds were determined as “Limeless Brown Forest Soils" with a coverage ratio of 66% and "Brown Soils" with a coverage ratio of 68%, respectively. The results are presented in Table 3 and in Figures 7 and 8. Comparing with Brown Soils, Limeless Brown Forest Soils are less erodible due to relatively high amount of organic matter content (Erol et al., 2009).
Table 3. Soil characteristics and spatial distributions of Goksun and Hurman. watersheds.
Soil groups Goksun
Watershed area Hurman Watershed area km2 % km2 % Alluvial Soils 70.30 12.23 20.30 3.33 Brown Soils 7.60 1.32 415.40 68.10 Colluvial Soils 22.40 3.90 62.00 10.16 Brown Forest Soils 94.40 16.42 0.00 0.00 Limeless Brown
Forest Soils
380.30 66.14 7.50 1.23 Chestnut Soils 0.00 0.00 7.60 1.25 Reddish Brown Soils 0.00 0.00 97.20 15.93
Figure 8. Soil characteristics map for Hurman watershed.
Sediment rating curve and correlation of sediment yields: The long-term sediment rating curve that indicates relationship between flow and sediment discharge was generated for Goksun and Hurman watersheds based on long term records (Fig. 9 & 10). The results indicated that there was a very high correlation between flow and sediment yield in neighbouring watersheds (R2=0.9243 p<0.001 and
R2=0.9882 p<0.001), respectively. According to this
relationship, the sediment yield increases as flow rate increases due to high precipitation in the watersheds. There is a difference between the curves indicating the relationship between flow and sediment yield in neighbouring watersheds due to pyshographic factors such as slope, land use, and soil types.
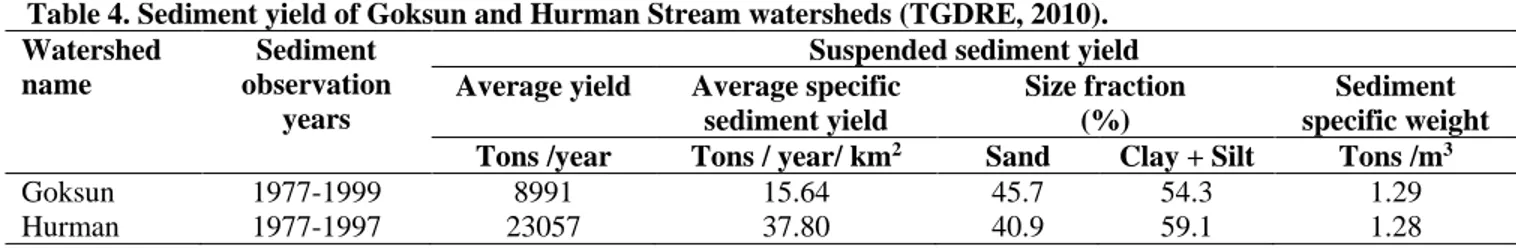
The results revealed that average annual sediment yield of Hurman watershed was about two times more than that of the Goksun watershed (Table 4). Ground slope is one of the major morphological elements influencing sediment yield. Previous studies indicated that the erosion rate may increase by 2.3 to 3.5 times when slope increases from 8% to 45% under the same percentage of vegetation cover (Dingzhong and Ying, 1996). Even though average ground slope was higher in Goksun watershed, sediment yield was found to be lower than that of Hurman watershed due to higher percentage of forest cover (62%). Therefore, vegetation cover has a crucial importance for the erosion resistance of surface soil. Besides, Goksun watershed mostly consisted of forest soil (brown and limeless brown) which has high water holding capacity and infiltration ratio (Erol et al., 2009).
Figure 9. Sediment rating curve of Hurman watershed.
Figure 10. Sediment rating curve of Goksun watershed.
Table 4. Sediment yield of Goksun and Hurman Stream watersheds (TGDRE, 2010). Watershed
name
Sediment observation
years
Suspended sediment yield Average yield Average specific
sediment yield
Size fraction (%)
Sediment specific weight Tons /year Tons / year/ km2 Sand Clay + Silt Tons /m3
Goksun 1977-1999 8991 15.64 45.7 54.3 1.29
Based on the water quality results for Goksun and Hurman watersheds, water quality classes were found as c2s1 and c1s1, respectively (Table 5). That means salinity hazard was classified as medium while sodium hazard was as low in Goksun watershed. On the other hand, salinity and sodium hazard was classified as low in Hurman watershed. It was also found that sodium absorption rate (SAR) was found as less than 10 in both neighbouring watersheds, which meant that quality of irrigation water was in very good characteristics. The residual sodium carbonate (RSC) index identify alkalinity of water of soil. RSC index values was found less than 1.25 which meant that quality of irrigation water was in very good characteristics.
In the Goksun watershed, the settlement areas were about five times greater than that of Hurman watershed. Having more settlement areas in Goksun watershed, larger amount of household waste material were able to reach water bodies due to lack of waste storage and processing systems in the region. Thus, anthropogenic pollution due to intense urbanization and consequent increase of population may be one of the most important causes of decline in water quality.
Conclusion: Two neighbouring watersheds were compared in terms of their average annual sediment yield and water quality values. Three factors including ground slope, land use, and soil type were determined to evaluate sediment yield and water quality since the climatic (precipitation, temperature) and some of the physiographic (elevation, area) characteristics were similar in both neighbouring watersheds. It was found that forest cover play important role in reducing sediment yield by tolerating negative consequences of other factors in the watershed areas. The results also indicated that water quality was low in a watershed area with dense forest cover due to effects of intense urbanization and high population rate.
In order to reduce sediment yield, especially in Hurman watershed, optimal land use classification should be implemented and erosion control measures (vegetative and mechanical) must be taken to reduce surface runoff. Storage areas should be established for household waste material and they should be properly processed by filtering to protect water
protection zones should be considered around water bodies to reduce pollutants in the region.
REFERENCES
Berka, C., H. Schreier and K. Hall. 2001. Linking water quality with agricultural intensification in a rural watershed. Water Air Soil Poll. 127:389-401.
Cuffney, T.F., M.R. Meador, S.D. Porter and M.E. Gurtz. 2000. Responses of physical, chemical, and biological indicators of water quality to a gradient of agricultural land use in the Yakima River Basin, Washington. Environ. Monit. Assess. 64:259-270.
Dingzhong, D. and T. Ying. 1996. Soil erosion and sediment yield in the upper Yangtze river basin, p. 191-203. In: D.E. Walling and B.W. Webb (ed.), Erosion and sediment yield: Global and regional respective. Wallingford, Oxfordshire.
Eaton, F.M. 1950. Significance of carbonates in irrigation waters. Soil. Sci. 69:123-133.
Erol, A., A.A. Babalık, K. Sonmez and N. Serin. 2009. Erodibility changes related to the land use types of Isparta-Darideresi watershed soils. SDU Facul. Fores. J. 2:21-36.
Harold, P.G. and W.N. Vernon. 1970. Field methods for measurement of fluvial sediment, 1st Ed. United States
Government Printing Office, Washington D.C.
Hoare, R.A and L.K. Rowe. 1992. Water quality in New Zealand, p.207-228. In: M.P. Mosley (ed.), Waters of New Zealand. New Zealand Hydrology Society, Wellington.
IGBP. 1995. International geosphere-biosphere programme: land-use and land cover change. Science Research Plan, Stockholm, pp.123-128.
Julien, P.J. 1995. Erosion and sedimentation. Cambridge University Press, Melbourne.
Richards, L.A. 1954. Diagnosis and improvement of saline and alkali soils. USDA Handbook No: 60. Washington. Sahinci, A. 1991. Geochemistry of natural waters, 1st Ed.
Reform Co., Izmir.
Sensoy, H. and S. Palta. 2009. Effects of slope shapes on soil Table 5. Water quality values of Goksun and Hurman watersheds (TGDRE, 2010).
Watershed n am e Dischar ge Water Te mpera tu re Hy dr ogen -ion Concent ra tio n El ectric al Conduc tivit y An io ns Cations So dium So dium Ad sorpti on Ratio Residu al So dium Ca rbona te Clas sific at ion of Irri gati on Water m3/sec °C pH 25°C EC 25°C dS m-1
meq / L % Na SAR RSC USA salinity
class
Goksun 8.43 10 8.14 287 3.08 3.09 0.08 -0.37 c2s1
Shakoor, A., M. Arshad, A. Bakhsh and R. Ahmed. 2015. GIS based assessment and delineation of groundwater quality zones and its impact on agricultural productivity. Pak. J. Agri. Sci. 52:837-843.
TGDCE. 2000. Ceyhan basin land use maps. General directorate of combating erosion in Turkey, Ankara. TGDRE. 2010, 2006 and 2015 stream observation station
data. General directorate of renewable energy, Ankara, Turkey.
TMGS. 2011. Kahramanmaras province meteorological data. Turkish state meteorological service, Ankara, Turkey.
Toy, T.J., G.R. Foster and K.G. Renard. 2002. Soil erosion: processes, prediction, measurement and control, 1st Ed.
John Wiley & Sons, New York.
TSE. 1979. Turkish standards institution, measuring flow of liquids. TSE Co., Ankara.
Tuzuner, A. 1990. Handbook for laboratories of soil and water analysis, 1st Ed. General directorate of rural
services, Ankara.
Wang, Q., P.Z. Zhang, J.T. Freymueller, R. Bilham, K.M. Larson, L. Xi'an and X. You. 2001. Present day crustal deformation in China constrained by global positional system measurements. Science 294:574-577.