ABSTRACT
Aeolianites are carbonate-cemented deposits of coastal dune sands, mostly of Quaternary age. Even though aeolianite exposures on the coasts of the Mediterranean Sea are frequent, very few records have been documented from the coasts of either the Aegean or the Black Sea. The present study deals with evaluating and comparing both compositions and thermo-luminescence (TL) ages of two recently reported samples of coastal aeolianites. Both were recovered at the Turkish coasts of Tenedos (Bozcaada) island, Aegean Sea and Şile, Western Black Sea. In the latter case, being the first record for the specific coastal area, the oldest age obtained was dated at 158±25 ka while the youngest age yielded was 108±14 ka. These values imply that both deposition and cementation occurred during the high sea stand of marine isotope stage 5 (MIS 5). In the case of Tenedos, the aeolianites were deposited between the early stage of the oxygen isotope stage 2 period (OIS 2) and the very late phase of the oxygen isotope stage 3 period (OIS 3). These latter TL results are in excellent agreement with a previous study of the same complex after applying OSL. Besides the ages, a number of luminescent features and properties in conjunction with compositional data suggest the dissimilarity for the quartz samples extracted from the aeolianites recovered at these two sampling sites, excluding thus any transport from one sampling site to the other, despite the short distance of the two sampling sites and the meteorological data regarding the preferable wind directions between them.
A COMPARATΙVE MORPHOLOGICAL,
COMPOSITIONAL AND TL STUDY OF TENEDOS
(BOZCAADA) AND ŞILE AEOLIANITES, TURKEY
George S. Polymeris
1, Ahmet Evren Erginal
2, Nafiye Guneç Kiyak
1,
1Işik University, Faculty of Science and Arts, Physics Department,
Laboratory of Luminescence
Research and Archaeometry, Şile – 34980, Istanbul, Turkey
2Department of Geography, Ardahan University, TR-75000, Ardahan, Turkey
Corresponding author G. Polymeris: ([email protected])
Received: 27/12/2011 Accepted: 10/3/2012
KEYWORDS: Aeolinites, TL, dating, Tenedos (Bozcaada).
1. INTRODUCTİON
Aeolianites are multiply stacked dune forms comprising skeletal carbonate sand with interbedded paleosols. These formations appear to had been formed either during intervals of sea level stability during interglacial sea-level highlands, or periods of relative sea level changes at the onset of inter-glaciations, or even under both sets of conditions (Brooke, 2001). In these settings, the paucity of terrigenous-clastic sediments reaching continental shelves has favored the prolific formation of bioclastic carbonate particles derived from a diverse range of marine invertebrates (Murray-Wallace et al., 2010). Furthermore, they exhibit peculiar characteristics to sub-aerial accumulated wind-blown dune sand deposits, such as existence of cross beds and/or landward-dipping foresets, abundant CaCO3cemented material, as well
as well sorted sand components. Globally, aeolianites appear to had been formed during intervals of sea level stability during interglacial sea-level highstands (Murray-Wallace et al., 2001; Roberts et al., 2008), periods of relative sea-level changes at the onset or terminations of inter-glaciations (Vacher and Rowe, 1997) or under both sets of conditions along some coastlines (Price et al., 2001; Bateman et al., 2004).
Regarding the worldwide distribution of aeolianites, Brooke (2001) reported the global distribution of aeolianites from a broad perspective and plotted 82% of aeolianite exposures on the world’s coasts within latitudes 20° and 40° of both hemispheres, pinpointing common exposures on the coasts of Australia, South Africa, the Bahamas and Bermuda as well as several parts of the Mediterranean Sea. Nevertheless, only few records have been documented from the Turkish coasts of the Aegean Sea and the Black Sea (Ertek et al., 2009). Recently, two aeolianite complexes were identified in the Turkish coasts and were located very close the one to the other.
These samples of coastal aeolianites, recovered at the Turkish coasts of Tenedos (Bozcaada) island, Aegean Sea and Şile, Western Black Sea. In both cases these are the new records for these specific coastal areas recovered in the North-East part of Mediterranean Sea. The nature of the aeolianite collected from Tenedos island was independently previously discussed by Kiyak and Erginal (2010), based on field observations, thin section interpretations, energy dispersive X-ray spectroscopy/ scanning electron microscopy (EDX/ SEM) and X-ray diffraction (XRD) data as well as depositional age based on optically stimulated luminescence (OSL) dating results.
In the framework of the present study, the multigrain, multi-aliquot, TL-based additive dose, total optical bleaching procedure suggested by Singhvi et al., (1982) was applied to the quartz extracted from polymineral, siliciclastic fractions of the aforementioned aeolianite complexes. It should be emphasized that this is the first report ever on the ages of the aeolianite samples recovered in Şile. Thermolumi-nescence was reported to be extremely effective towards aeolianite dating (Price et al., 2001, Murray-Wallace et al., 2010). Furthermore, in the case of the aeolianite from Tenedos, the results yielded will be compared to the respective results obtained after the application of multigrain, OSL, single aliquot regenerative-dose procedure (SAR, Murray and Wintle, 2000) to the samples of the same complex (Kiyak and Erginal, 2010). Moreover, since aeolianites consist of aeolian quartz types, another aim of the present study is to characterize these quartz samples. This characterization will be based mostly on the luminescence features of the quartz extracted from these formations. Nevertheless other features as well, such as mineralogical composition, carbonates, organic and water components, in conjunction with both TL dating results are presented in the first effort to study any
possible correlation between these two formations, due to aeolian transfer from one site to another.
2. DESCRIPTION OF THE COLLECTION SITES - GENERAL GEOLOGICAL AND GEOMORPHOLOGICAL SETTINGS
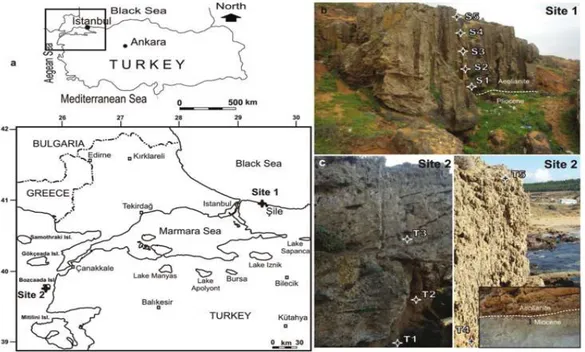
The first aeolianite sample was recovered about 11 km west of the Şile district of Istanbul, Kocaeli Peninsula, northwest Turkey (Fig. 1a). The outcrop lies at 41°11'53'' north latitude and 29°26'46'' east longitude, and is located behind a sandy beach, containing bioclastic debris. Pebbles are in inconsiderable amount and comprise
of andesite, arkose and limestone derived from the environs. Pliocene sediments of terrestrial origin, containing predominantly clay, gravel and lignite, dominate the geology of the area. The underlying clays are red-colored and non-fossiliferous, both forming basal unit of Pliocene deposits and the studied aeolianite with a visible thickness of 2 m (Fig. 1b). The carbonate-cemented aeolianite is 5 m thick and is made entirely of south (leeward)-inclined greatly indurate layers with a number of dissolution pipes showing tapering in depth. Its seaward-facing surface is rather rough due to those weathering holes, which
Figure 1. Location map of sampling sites (a) and the studied aeolianites in Site 1 (b) and Site 2 (c).
get through up to 4 m depth from the rock surface. The transition between Pliocene clays and aeolianite is explicit and is marked by a nearly horizontal plane. Based on climate data from Şile Meteorology Station north-easterly winds dominate throughout the year. Alongshore currents are from the east to the west.
The second aeolianite was collected from the N30E trending Cape Zunguma, in Tenedos (Bozcaada) island, which is located 6 km west of the Biga Peninsula, northwest Turkey and has an area of 36 km2. The
aeolianite in underlined by Miocene shallow marine sediments and is orange to brown colored, lying between the latitudes
39°38'51'' - 39°48'44'' north and longitudes 26°00'13'' - 26°00'25'' east. The island consists of different rocks ranging in age from Palaeozoic to Holocene (Saltık and Saka, 1972). Marble and schist having dips varying between 35° and 40° towards the southeast form the basement rocks cropping out at the southwest part of the island and extend in a NW-SE direction. These basement rocks are unconformably overlain by conglomerate, limestone and flysch of Eocene age. The upper Miocene formations that overlie Eocene units are composed of conglomerate, sandstone, clay stone, limestone and andesite. The western part of the island is entirely occupied by Holocene coastal dune sands.
Even though the average thickness of the aeolianite is about 3-5 m, beds up to 5 m thick are found on the west side where steep sea-cliffs, cliff debris and seaward toppled-blocks are common. However, the eastern coast is low, indented due to alternating coves and seaward rock protrusions and is characterized by wave-cut platforms ranging in elevation between 0 m and 1 m. The upper surface of the aeolianite, which has a gentle (<5°) seaward inclination, is morphologically quite irregular due to the presence of numerous dissolution pits and weathering cavities (Erginal and Ozturk, 2009). Underwater observations showed that submerged partings of aeolianite lie down to – 5 m at its most seaward extent of 20 m offshore. Based on data recorded at Tenedos meteorology station between 1975 and 2003, the climate in the area is typically Mediterranean while the predominant wind direction is from NE and SW.
3. METHODS
3.1. Sampling and microanalyses
Five samples of aeolianites from each sampling complex were taken from a 5-meter-thick coastal exposure at 1 meter intervals for thin section studies,
microanalyses and TL age determinations. Sampling locations are presented in Figs 1b and 1c. Thin sections were produced for petrographic definition using a Chebios microscope. The elemental composition of both aeolianites and rhizoliths was examined using an A Phillips XL-30 S FEG Scanning Electron Microscope equipped with EDX detector. X-ray Diffraction Analysis (Phillips X’Pert Pro) was applied to the same samples for mineral determinations. The analyses were performed in the Materials Research Centre of Izmir Institute of Technology.
3.2. Sample preparation and luminescence measurements
For the luminescence analyses the hard, almost 0.5 cm thick, outer surface of the aeolianite samples was removed to eliminate the light-subjected portions. Then the inner part was crushed in a mortar and cleaned with 10% HCl, 10% H2O2, and HF in the
laboratory. Grains with dimensions of 90–180 μm were separated and the purity of the quartz grains was tested by the absence of luminescence signal during infrared stimulation. All luminescence measurements were performed with an automated Risø TL/OSL reader, model TL/OSL-DA-15, equipped with an internal 90Sr/90Y beta
source (~0.1 Gy s-1), blue light emitting
diodes (LEDs) (470 nm, ~40 mW cm-2) and IR
LEDs (880 nm, ~135 mW cm-2).
Luminescence signals were detected using an EMI 9635QA photomultiplier tube fitted with 7.5 mm-thickness Hoya U-340 filters (Bøtter-Jensen, 1997). In all cases the heating rate applied was 1 oC/s in order to avoid
significant temperature lag.
4. AEOLIANITE COMPOSITION
Both samples are orange-red to brown colored. Petrographical studies, based mostly on XRD and SEM analysis, indicated the presence of various minerals, such as quartz, calcite, plagioclase and orthoclase,
with the former two being extremely abundant as well as dominant. Various lithoclasts, such as quartzite, schist, various magmatic rocks and microfossils were also observed in the present study under thin section images. The mineral grains and rock fragments range in size between 0.5 and 7 mm. Thin section images for both samples showed that the rocks are tightly cemented, with the connection cement, consisting of mainly CaCO3, especially the calcite that
amalgamates the grains with poor roundness. Based on EDX and XRD data, respectively, this cement comprises several elements (Wt%) in descending order of Ca>O>C>Si>Na>Fe>Mg=K>Al and minerals of calcite and aragonite, suggesting a marine depositional environment as the source area for cement supply.
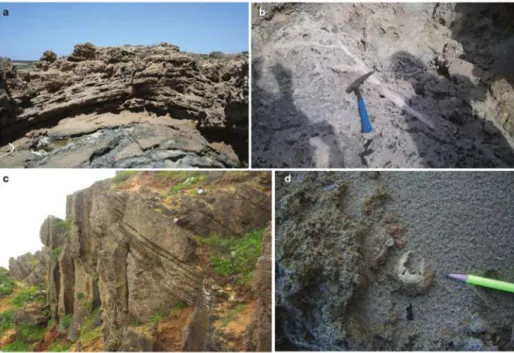
A well-developed structure of cross-stratification is the most diagnostic evidence of aeolian origin. This trend of bedding implies the bi-directional effects of winds, similar to that of the present day. This feature was noticed in the case of
samples from Tenedos at nine different locations indicating the existence of superimposed cross-beds with thickness of the ranges from over 1 m down to a few cm, as well as of foresets deposited at angles between 15° and 20° with two main dip directions towards the northeast and southwest (Fig. 2a). No clear evidence of paleosol in transition or truncation planes of overlying and underlying dune generations was identified. Nevertheless the content of rhizoliths is extremely abundant (Fig. 2b), especially in the cases of lower beds of aeolianite being exposed by marine erosion at low altitudes ranging between 1 m and 2 m above sea level. For further details regarding the morphology and composition of the samples, the reader could refer to Kiyak and Erginal (2010).
On the contrary, in the case of samples collected from Şile, even though the sequence does not show a cross-bedding structure (Fig. 2c) typical of carbonate cemented fossil dune deposits accumulated by bi-directional winds, it preserves some
Figure 2. (a) Cross-bedded structure of the Bozcaada aeolianite, (b) a rhizolith showing typical tapering, (c) south-dipping laminated aeolianite in Şile and (d) a piece
evidence of an aeolian origin, such as well-sorting in grain sizes and, particularly, the presence of rhizoliths as terrestrial-sourced organo-sedimentary components (Fig. 2d). The latter feature stands as another extremely useful diagnostic tool for organo-sedimentary structures of both studied aeolianite samples.
5. LUMINESCENCE DATING
A luminescence age estimate equals paleodose (DEor ‘equivalent dose’, derived
from luminescence measurements) divided by dose rate (DR, from elemental and/or
isotopic data). Accurate luminescence dating of sediments requires four main conditions: (1) the tractability of the radiation dose–rate calculation; (2) the long-term stability of the post-burial luminescence signal; (3) the absence of post-burial disturbance of the sediment; and (4) the effective zeroing of light-sensitive luminescence by daylight (Berger, 2006). Relevant principles and details have been discussed by Aitken (1985) and Aitken (1998) .
In the case of carbonate-cemented deposits such as aeolianites, the accumulation as well as dissolution of carbonate material occurs as a pore-filling substance over time. Unfortunately, Zimmerman’s method for organic and water component correction did not explicitly take account of the variability of the beta and gamma radiation’s energy spectra, as the composition of the interstitial material changes. Therefore, condition 1 has recently been shown to require correction for carbonates towards the application of luminescence dating (Kiyak and Erginal, 2010) and is discussed again below. Condition 2 is readily satisfied if quartz is used for luminescence measurement, because its signal is apparently stable enough (e.g., Aitken ,1998, Bøtter-Jensen et al., 2003) to permit accurate dating back to about 150–200 ka with normal-radioactivity sediments. Condition 3 is easily met due to
the fact that aeolianites are carbonate-cemented deposits, consequently, cementation in a CaCO3 medium
guarantees absence of post-burial disturbance. Condition 4 is the most critical for luminescence dating, in any depositional setting and has recently been shown to be a limiting variable in the application of luminescence dating to aeolianite sediments (Frechen et al., 2001; Porat et al., 2004; Murray-Walace et al., 2010; Kiyak and Erginal, 2010). In this context, development of an accurate luminescence geochronometer for aeolianite sediments requires using quartz as well as determining whether the latter has a zero luminescence age at the depositional stage. 6. TL RESULTS
6.1. Bleaching Levels of TL signals
TL signal is never totally zeroed due to bleaching. Instead, an un-bleachable residual component is always left. In order to check the validity of condition 4 of the previous chapter, i.e. the effective zeroing of the luminescence under the solar light, out of each layer, 14 fresh aliquots were kept aside in order to estimate the bleaching levels of TL. These aliquots were divided into groups consisting of two aliquots each.
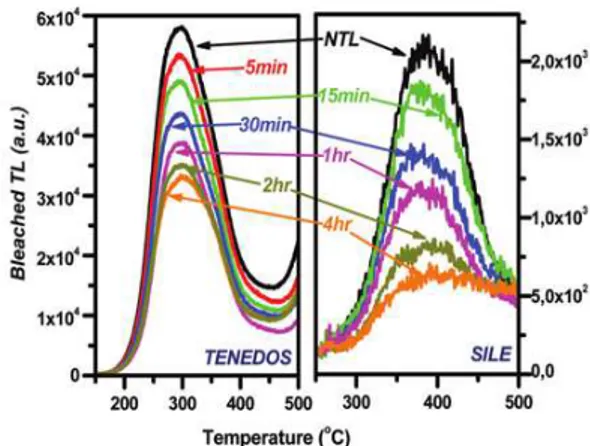
Figure 3. Residual TL glow curves after various bleaching times ranging between 0 (NTL) and 6 hours, received for samples T1 and S3. Residual TL glow curves after 4 and 6 hours of exposure
Samples from the first group were measured in order to get the NTL. The rest were exposed to sunlight bleaching in Istanbul over variable lengths of time, ranging from 5 min to 6 h. Fig. 3 shows typical glow curves after various bleaching
times for quartz grains resulting from both aeolianite samples. Bleaching seems to be taking place quite fast, especially in the first two hours of solar exposure. This feature is
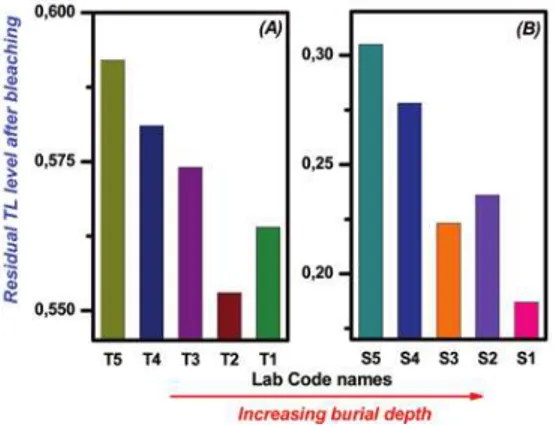
further supported by Fig. 4A, where the residual curve of solar bleaching, indicates that exposure to sunlight for 4-6 hours is adequate for the TL signal to reach its equilibrium level. Bleaching features are similar to other layers also; however, one notable difference stands for the case of the level of the un-bleachable residual TL signal that remains after bleaching. Fig. 5 presents the residual TL levels for all the samples studied from both sites. In the case of the samples collected from Tenedos island, the residual un-bleachable TL level ranges between 55 and 60% of the NTL signal. However in the case of the samples collected from Şile, bleaching seems to be extremely effective, resulting in loss of almost 70% of natural TL signal. Residual TL levels differ between 20 to 30% of the NTL signal. However, as it becomes obvious from Fig. 4B, the time required for both signals to reach their equilibrium states is similar as well as independent on the level of the un-bleachable residual TL. Different residual bleaching levels could be attributed to different properties of the quartz grains under study. Furthermore, in both complexes a correlation between the burial depth and the residual TL level after bleaching is proposed. TL beaching seems to be more effective as the burial depth increases, besides the one outlier sample which is yielded in each complex.
In the case of the aeolianite sample collected from Tenedos, the residual curve of bleaching was obtained after applying two alternative bleaching approaches; using solar bleaching in Istanbul, as well as using the blue LEDs housed in the RISØ commercial TL/OSL reader, stimulating at the 90% of their maximum stimulation intensity (40 mW/cm2, Bøtter-Jensen et al.,
2000). The aim of this exercise is to study and compare the bleaching achieved after using these two approaches as well as to find the time exposure to blue LEDs which could result in equivalent bleaching result as the case of exposure of 4-6 hours to the
Figure 4. (A) Residual curve by sunlight bleaching of TL for aliquots collected from
layers T1 and S3, for the temperature corresponding to the maximum NTL intensity, normalized over the NTL intensity. Each point represents the average from two glow curves obtained. Error bars indicate 1σ deviation. (B) Similar but after bleaching using blue LEDs for
the samples from Tenedos.
Figure 5. Normalised residual TL level after 4 hours of exposure is presented for each one of
autumn sun in Istanbul/Turkey. Residual curve of blue LEDs bleaching is presented in Fig. 4B. Stimulation at 36 mW/cm2 for 1 ks results in the same residual TL level as in the case of 4-6 hours of sun bleaching. The residual un-bleachable TL level was found to be similar as in the case of the sun exposure, i.e. almost 55-58% of the NTL signal. In that sense, using the blue LEDs housed at the RISØ commercial TL/OSL reader is strongly recommended, mostly due to short time duration required.
6.2. Additive Dose procedure
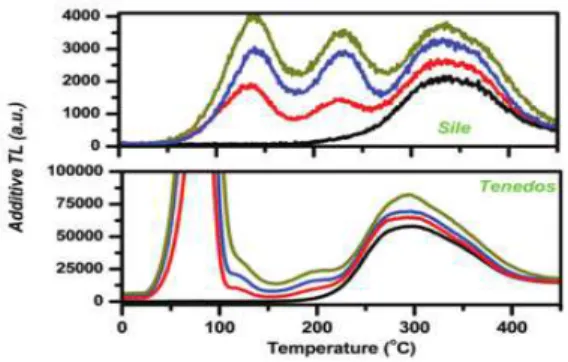
Natural TL glow curves for all samples exhibit the same main characteristics,
namely a glow curve that it has the form of a continuum centered around 380 oC. In the
case of Tenedos samples, all natural glow curves consist mainly of at least two prominent overlapping peaks, the first around 285 oC and the second around 350 oC. Each plot of Fig. 6 presents a selection of
NTL glow curves for each sampling site, in order to correlate their intensity to the corresponding equivalent doses yielded. Fig. 7 presents characteristic glow curves of the additive-dose procedure for one sample of each sampling site, namely the S4 sample (upper plot) as well as the T4 sample (lower
plot). Initial letter indicates Şile and Tenedos respectively. In the former case, the additive doses applied, range between zero and 75 Gy; however, in the respective plot, only glow curves corresponding to 25, 50 and 75 Gy are plotted. In the latter case, three additive doses were applied, namely 10, 20 and 35 Gy, while the corresponding glow curves are also plotted.
In both cases as well as for these specific additive-dose regions, even though the material used is quartz, the TL signal presents a linear response over increasing doses. Therefore, only linear fittings were performed to the dose response curves. This linearity should be strongly established, since the additive doses applied are large
Figure 6. A selection of NTL glow curves for each sampling site, in order to correlate
their intensity to the corresponding equivalent doses yielded.
Figure 7. Natural and natural-plus-beta dose glow curves obtained for the sample S4 (A) and
T4 (B). Reheats have been subtracted. Additive doses applied: 25, 50 and 75 Gy for the samples recovered from Şile while 10, 20 and 35 Gy for
those from Tenedos island.
Figure 8. Dose-response-slope curve of TL for layer S3, plotted versus temperature, for the three additive doses applied. Inset: Additive dose growth curve for the temperature of 375 oC.
enough to bring the samples to saturation, especially in the case of Şile samples. Linearity is strongly supported by Fig. 8, where the dose response slope is plotted versus temperature for the three different additive doses applied. This slope is calculated according the following formula:
[(NTL + βi) – (NTL)] / βi
Here with (NTL + βi) we denote the
corresponding additive glow curves, so the preceding subtraction takes place for each data point. Since all TL curves were monitored using 500 data points and heating rate of 1 oC/s, eventually we get
three different curves, each one corresponding to one among the additive doses applied with each data point corresponding to a different temperature in step of 1 oC. In the case of linearity, these
three curves should coincide. This is exactly the case for the samples collected from Şile (Fig. 8), in the temperature region where the NTL occurs, namely in the region between 300 and 450 oC. This unexpected linearity of
the response curves after applying the specific additive doses was found for all different samples studied in the present study. In the case of Tenedos sample, the presence of linearity is limited in the temperature region between 270 and 340 oC,
i.e. at the temperature region of the NTL signal once again. In the inset of Fig. 8, a representative example of additive buildup curve is also presented as filled squares for the temperature corresponding to the imof
each NTL signal.
6.3. Equivalent Doses. Supralinearity corrections
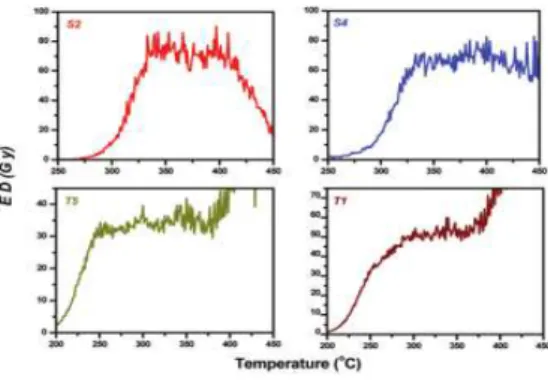
Equivalent doses were calculated with 1σ error values and are plotted against glow curve temperature for a selection of representing layers in Fig. 9. Errors derived mainly from the uncertainties in curve fitting, are ±1σ and were calculated by standard error propagation analysis (Knoll, 1999). In both cases of aeolianites, ED plateaus are wide enough, over 70 oC wide.
Although it was experimentally established that the laboratory bleaching for 4 h is adequate to leave only the un-bleachable component, there is always the risk that the exposure to sunlight prior to deposition was not sufficient to reach this level. However the wide TL plateaus and the good match between the TL and OSL ED results (35.5 – 45.6 Gy, Kiyak and Erginal, 2010) indeed qualify the fact that the TL signal has reached equilibrium and is bleached to the maximum. Furthermore, the glow curve temperature region of the ED plateau coincides with the respective temperature region of linear dose response slopes, as indicated in Fig. 8. The equivalent doses were obtained as the mean values of the best plateaus for each sample.
Plot A of Fig. 10 presents second glow TL
Figure 9. A selection of equivalent dose plateaus, plotted versus temperature.
Figure 10. Plot A: Second glow TL curves in the temperature region 300 – 500 oC after applying low
doses. Plot B: Supralinearity correction dose plateau, plotted versus temperature. Plot C: Second glow dose response curve for the
glow curve plotted versus temperature in the temperature region 300 – 500 oC for the
case of S4 sample. The respective second glow TL dose response curve after applying low doses, is presented in plot C of the same Fig. (10) for the temperature region of 375 -380 oC indicating the presence of intense
supralinearity in the low-dose region (Fleming, 1979). In the same Fig., plot B presents the supralinearity correction in the case of layer S4, plotted versus temperature in the same temperature region with the equivalent dose plateau. Supralinearity was observed in all samples collected from Şile, but not in those from Tenedos. A summary of the TL dating data is provided within Tables 1 and 2 for the case of Şile and Tenedos samples respectively. It is worth noticing that the 1σ error values indicated by the analysis of the TL data seem to be depth dependent, as with increasing depth these values increase in the case of Şile samples but decrease for the samples collected from Tenedos. Put simply, the luminescence signal could probably be well bleached for the deep samples in Tenedos. This result stands in good agreement with the correlation between the burial depth and the residual TL level after bleaching suggested from Fig. 5.
6.4. Dose rates
Only beta and gamma dose rates were considered in this work. Alpha radiation was neglected due to the short range of the alpha particles, which was previously removed by HF etching and the very low internal radioactivity of quartz grains. The dose rate of the radiation environment in which the studied samples were buried was calculated using gamma spectroscopic data recorded in situ. Total dose rate required for TL age was estimated from gamma dose rate and spectral data using conversion factors of Adamiec and Aitken (1998).
Corrections for carbonates, organic and water content were also adopted in the
present study.
Regarding the samples originated from Şile, burial dose rates spanned between 0.63±0.06 to 0.71±0.07 mGy/a. In the case of samples collected from Tenedos, the burial dose rates ranged from 1.84±0.08 to 2.03±0.08 mGy/a. The dose rates obtained are presented in Tables 1 and 2 respectively. As these Tables are going to further reveal, the dose rates in the two sampling sites differ almost by a factor of 3. A data summary is given in Table 3.
6.5. Ages &Interpretation
TL ages from both sites highlighted that dune sand deposition occurred on Aegean and Black Sea coast of Turkey during both the last glacial and interglacial periods.
In the case of Tenedos samples, the TL results revealed that the first accumulation of dune sands took place about 28±2 ka on the southern coast of the island when sea-level was at a descending tendency. The youngest age of 17±1 ka near the peak of the last glacial maximum was obtained from cross-beds with vast amount of rhizoliths as organo-sedimentary components. From the oldest and the youngest ages, it is concluded that the aeolianite records deposition of wind-drift sands within a time span of almost 10.000 years spanning from late stages of OIS3 to the near maximum period of OIS2. These results stand in agreement with the respective OSL results of 16 – 25 ka reported previously by Kiyak and Erginal (2010).
These ages imply that the Tenedos aeolianites and root cast within them comprise specific example to glacial aeolianites that were developed during low stand sea-level conditions. In terms of its paleo-coastal implications, the abundance of carbonate indicates that these connective carbonates could be related to wind-blown drift from an exposed carbonate-laden shelf where deposition of carbonates rich in bioclasts (Brooke, 2001 for a detailed
discussion). Implications on low-stand level accumulation were previously discussed extensively. Similar examples of carbonate dunes cemented with removed carbonates during lowstands were provided from Israel (Porat and Wintle, 1995; Frechen et al., 2001), western and southwestern Australia (Kendrick et al., 1991; Price et al., 2001), Hawaii (Muhs et al., 1993) and South India (Gardner, 1983).
In the case of Şile samples, we obtained much older ages from all layers in stratigraphic order within large errors. The oldest age obtained from the sample overlying the Pliocene clays at 3 meters below the rock surface was dated at 158±25ka. The youngest age yielded was, however, 108±14ka. The other three samples
yielded values, implying that both deposition and cementation occurred during the high sea stand of marine isotope 5 stage (MIS 5e). It is worth noticing the relative high uncertainty on the calculated ages for the samples collected from Şile. This is partly attributed to the supralinearity correction that is large as well as extremely variable for these samples (1.4 to 8.7%).
In the lack of any data to compare from the Black Sea coast, these ages are similar to many examples on world coastline, such as in Bahamas (Carew and Mylroie, 1997; Hearty and Kindler, 1997), western Mediterranean (Fumanal, 1995), and southwest Australia (Murray-Wallace et al., 2001). In addition, aeolianites belonging to
MIS 5e with abundant ooid contents (Frébourg et al., 2008. for a detailed review) as such in our samples were also recorded in Tunusia (Hasler et al., 2007) and Bahamas (Kindler and Hearty, 1995).
6.6. Quartz Characterization.
Characterization of quartz extracted from all samples of both sites was partly performed based on the data collected in the framework of the dating protocol applied, namely TL-based additive dose, total optical bleaching procedure. Especially in the case of the samples collected from Şile, the measurements indicated that all extracted quartz samples were very bright, yielding high sensitivity in both cases of NTL as well as artificial TL (second glow). Fast and quick bleaching was established by Figs 3-5. For the same sampling site (Şile), the linearity of the dose response curve even in the case of large additive doses should be emphasized. Finally, the presence of intense supralinearity in the low-dose region was established. Supralinearity corrections ranged between 1.4 and 8.7% of the estimated ED values. Table 3 provides a summary of several luminescence as well as compositional data for the two sampling sites under study.
In the case of samples collected from Tenedos island, the quartz samples extracted are also very bright. The TL sensitivity of those samples seems to be much larger when compared to the respective of the samples collected from Şile. This is also the case for the TL sensitivity. Figs 3-5 indicate the presence of an intense, hard-to-bleach component of the NTL signal. Furthermore, the lack of supralinearity in the low-dose region stands as another difference between the two different quartz samples. However, the wide plateau yielded in all cases could be considered as the unique similar luminescent feature of these quartzes. It is
worth emphasizing to the fact that even though the samples from Şile are less bright than those from Tenedos island, the age is quite larger in the former case due to larger ED.
Nevertheless, further measurements were performed in order to check some other features, such as sensitivity changes and grain-to-grain repeatability of NTL signal. In the former case, 11 successive irradiations – TL measurement cycles were applied on the same aliquot. Three different aliquots were used for each sample, each one corresponding to different dose. The doses delivered were the same doses applied in the framework of the additive dose procedure for each sample, i.e. 25, 50 and 75 Gy in the case of samples from Şile while 10, 20 and 35 Gy, for the samples collected from Tenedos. Sensitization was studied in terms of the 110 oC TL peak,
which is typical of the quartz TL glow curve as well as of unique interest. Strong sensitization is recorded in both cases, and furthermore, this sensitization pattern is similar regardless of the dose delivered. The sensitization versus repeated cycles recorded for the case of Tenedos samples was of the order 5-9% per cycle, while for samples from Şile was much increased, ranging between 19 and 27% per cycle. Moreover the much better bleach ability of the quartz extracted from Şile samples could be related to the lower abundance of the CaCO3at the specific aeolianite samples.
Finally, regarding repeatability of Natural luminescence signal, single grains were selected in the range 145 – 180 microns in order to measure the natural signal for each one. In the case of samples collected from Tenedos island, 20 grains were selected from each layer. Results indicate very good reproducibility, with mean intensity in TL with extremely low relative standard error, of the order of 8% in the case of TL. Repeatability indicates that despite the aeolian nature of the extracted quartz, bleaching and radiation history was
uniform for all quartz grains (Preusser et al., 2009). Repeatability was much better in the case of samples collected from Sile, yielding values of the order of 3.5%. However this value contradicts to the relatively large error values (7-11%) yielded for the respective ED values.
7. CONCLUSIONS
In the present study, the effectiveness of the multigrain, multi-aliquot, TL-based additive dose, total optical bleaching procedure suggested by Singhvi et al., (1982) was established for the case of quartz extracted from two aeolianite complexes both identified in the Turkish coasts. These samples of coastal aeolianites, recovered at the Turkish coasts of Tenedos (Bozcaada) island, Aegean Sea and Şile, Western Black Sea, were located very close the one to the other. In the latter case, the ages reported stand as the first record for the specific coastal area, spanning between 158±25 ka and 108±14 ka. These values imply that both
deposition and cementation occurred during the high sea stand of marine isotope stage 5 (MIS 5). The ages for all layers of both sites obtained by TL are in stratigraphic order within errors. Nevertheless, besides ages, a number of luminescent features and properties suggest the dissimilarity for the quartzes extracted from the aeolianites recovered at these two sampling sites. Consequently, despite the short distance of the two sampling sites, different properties of quartz indicate that transport from one sample to the other could not have possibly occured, even though the preferable wind directions would have favored such transportation. ACKNOWLEDGEMENT
Dr. George S. Polymeris is indebted to TUBITAK (The Scientific and Technological Research Council of Turkey) for financial support. This study is partly supported by Research Foundation of Çanakkale Onsekiz Mart University (Project Number: 2011/41).
REFERENCES
Adamiec, G., Aitken, M., (1998). Dose – rate conversion factors: update. Ancient TL 16, 37 – 49.
Aitken, M. J., (1985). Thermoluminescence Dating. Academic Press.
Bateman, M.D., Holmes, P.J., Carr, A.S., Horton, B.P., Jaiswal, M.K., 2004. Aeolianite and barrier dune construction spanning the last two glacial–interglacial cycles from the southern Cape coast, South Africa. Quaternary Science Reviews 23, 1681– 1698.
Berger, G. W., (2006). Trans-arctic-ocean tests of fine-silt luminescence sediment dating provide a basis for an additional geochronometer for this region. Quaternary Science Reviews 25, 2529 – 2551.
Bøtter-Jensen L., (1997). Luminescence techniques: instrumentation and methods. radiation
Measurements 17, 749-768.
Botter-Jensen, L., Bulur, E., Duller, G.A.T., Murray, A.S. (2000) Advances in luminescence instrument systems, radiation Measurements 32 523—528.
Bøtter-Jensen, L., McKeever, S.W.S., Wintle, A.G., (2003). optically Stimulated luminescence
Dosimetry. Elsevier Publishing, Amsterdam.
Erginal, A.E., Öztürk, B., (2009). Coastal salt weathering of Quaternary eolianite (Bozcaada Island) and Eocene sandstone (Gelibolu Peninsula): The contribution of microan-alytical data. Mineral research & exploration Bulletin, 139: 51-59.
Brooke, B.P., (2001). Distribution of carbonate eolanite. earth-Science reviews 55, 135–164. Carew J.L., Mylroie, J.E., (1987). A refined geochronology for San Salvador Island,
Bahamas: Proceedings of the Third Symposium on the Geology of the Bahamas, CCFL Bahamian Field Station, San Salvador, Bahamas, pp. 35–55.
Gardner, R.A.M., (1983). Aeolianite. In: Goudie, A.S., Pye, K. (eds.), Chemical Sediments and Geomorphology: Precipitates and Residua in the Near-Surface Environment. Academic Press, London, pp. 265–300.
Ertek, T.A., Kıyak, N.G., Erginal, A.E., (2009). The first aeolionite record from the Black Sea coast: OSL dating of Sile aeolionite. LUMIDOZ-III, Luminescence Dosimetry Congress, 28-30 Eylül 2009, Abstracts book, p. 27 (in Turkish).
Fleming, S., (1979). Thermoluminescence Techniques in Archaeology. Clarendon Press. Frechen, M., Dermann, B., Boenigk, W., Ronen, A., (2001). Luminescence chronology of
aeolianites from the section at Givat Olga – Coastal Plain of Israel. Quaternary
Science reviews 20, 805 – 809.
Fumanal, (1995). Pleistocene dune systems in the Valencian Betic cliffs (Spain). iNQUA
Subcomission on Mediterranean and Black Sea Shorelines Newsletter 17, 32–38.
Hasler, C.A., Frebourg, G., Davaud, E., (2007). Anatomy and weather induced internal heterogeneities of a Pleistocene carbonate coastal dune (Rejiche Formation, southeast Tunisia) (abs.): AAPG Annual Convention and Exhibition, Long Beach, California, v. 17, p. 61.
Hearty, P.J., Kindler, P., (1993). New Perspectives on Bahamian Geology: San Salvador Island, Bahamas. Journal of Coastal research 9, 577–594.
Kendrick, G.W., Wyrwoll, K.H., Szabo, B.J., (1991). Pliocene–Pleistocene coastal events and history along the western margin of Australia. Quaternary Science reviews 10, 419– 439.
Kindler, P., Hearty, P.J., (1995). Pre-Sangamonian aeolianites in the Bahamas? New evidence from Eleuthera Island. Marine Geology 127, 73-86.
Kiyak, N.G., Erginal, A.E., (2010). Optical Stimulated Luminescence Dating Study of Aeolionite on the Island of Bozcaada, Turkey: Preliminary Results. Journal of
Coastal research (DOI: 10.2112/08-1169.1).
Knoll, F.G., (1999). radiation Detection and Measurements, third ed. J. Wiley & Sons, Inc. Muhs, D.R., Whelan, J.F., Kennedy, G.L., Rockwell, T.K., (1993). Late Quaternary sea level
history of the pacific coast of North America: a detailed record of the Last Glacial/Interglacial cycle, J.A Kelmelis, M Snow, (Editors), US Geological Survey Global Change Research Forum, US Geological Survey, Herndon, VA, , pp. 101– 102.
Murray, A.S., Wintle, A.G., (2000). Luminescence dating of quartz using an improved single aliquot regenerative-dose protocol. radiation Measurements 32, 57-73.
Murray-Walace, C. V., Bourman, R. B., Prescott, J. R., Williams, F., Price, D. M., Belperio. A. P., (2010). Aminostratigraphy and thermoluminescence dating of coastal aeolianites and the later Quaternary history of a failed delta: The river Murray mouth region, South Australia. Quaternary Geochronology 5, 28 – 49.
Murray-Wallace, C.V., Brooke, B.P., Cann, J.H., Belperio, A.P., Bourman, R.P., (2001). Whole-rock aminostratigraphy of the Coorong Coastal Plain, South Australia: towards a 1 million year record of sea-level highstands. Journal of the Geological Society,
london 158, 111–124.
Porat, N., Wintle, A. G., (1995). IRSL dating of aeolianites from the late Pleistocene coastal kurkar ridge, Israel. iNQUA 14th international Conference. Alfred Wegner Stiftung, Berlin.
Porat, N., Wintle, A. G., Ritte, M., (2004). Mode and timing of kurkar and hamra formation, central coastal plain, Israel. israel J. of earth Sciences 53, 13 -25.
Preusser, F., Chithambo, M.L., Götte, T., Martini, M., Ramsayer. K., Sendezera, E.J., Susino, G., Wintle, A.G., (2009). Quartz as a natural luminescence dosimeter. earth Science
reviews 97, 184 – 214.
Price, D.M., Brooke, B.P., Woodroffe, C.D., (2001). Thermoluminescence dating of aeolianites from Lord Howe Island and south-west Western Australia. Quaternary
Science reviews (Quaternary Geochronology) 20, 841–846.
Roberts, D.L., Bateman, M.D., Murray-Wallace, C.V., Carr, A.S., Holmes, P.J., (2008). Last interglacial fossil elephant trackways dated by OSL/AAR in coastal aeolianites, Still Bay, South Africa. Palaeogeography, Palaeoclimatology, Palaeoecology 257, 261– 279.
Saltik, O., Saka, K., (1972). Geological investigation of northern Saroz Gulf, Gelibolu Peninsula, Imbroz-Bozcaada and Çanakkale coastline. TPAO Archives No; 786 (in Turkish).
Singhvi, A.K., Sharma, Y.P., Agrawal, D.P., (1982). Thermoluminescence dating of sand dunes in Rajasthan, India. Nature 295, 313 – 315.
Vacher, H.L., Rowe, M.P., (1997). Geology and hydrogeology of Bermuda. In: Vacher, H.L., Quinn, T. (Eds.), Geology and Hydrogeology of Carbonate islands. Developments in