http://dx.doi.org/10.1080/00958972.2016.1241394
Platinum(II)-thiosemicarbazone drugs override the cell resistance
due to glutathione; assessment of their activity against human
adenocarcinoma cells
M. Poyraza, S. Demirayakb, C. N. Bantic, M. J. Manosc, N. Kourkoumelisd and S. K. Hadjikakouc
afaculty of science and arts, Chemistry department, afyon Kocatepe university, afyonkarahisar, turkey; bdepartment of Pharmaceutical Chemistry, medipol university, istanbul, turkey; cinorganic and analytical Chemistry, department of Chemistry, university of ioannina, ioannina, Greece; dmedical Physics laboratory, medical school, university of ioannina, ioannina, Greece
ABSTRACT
New platinum(II) compounds of the thiosemicarbazone 1-(1H-Benzimidazol-2-yl)ethan-1-one thiosemicarbazone (BzimetTSCH), [Pt(BzimetTSCH) Cl]·2H2O (1) and [Pt(BzimetTSCH)(tpp)]Cl·H2O·MeCN (2) were synthesized. The complexes were characterized by FT-IR spectroscopy and 1H NMR spectroscopy. The crystal structures of 1 and 2 were determined with single-crystal X-ray diffraction analysis. The coordination around platinum is square planar in both complexes. Compounds 1 and 2 were evaluated for their in
vitro cytotoxic activity against human adenocarcinoma breast (MCF-7) and
cervix (HeLa) cells. The apoptotic pathway of cell death was confirmed by cell cycle arrest test. Since deactivation of cisplatin caused by glutathione (GSH) seems to be an important determinant of its cytotoxic effects, the reactions of 1 and 2 with GSH were investigated by UV-absorption spectroscopy. The genotoxicities on normal human fetal lung fibroblast cells (MRC-5) caused by 1 and 2 were evaluated by fluorescence microscopy. The absence of micronucleus in MRC-5 cells confirms the in vitro non toxic behavior of the compounds. Moreover, the in vivo genotoxicities of 1 and 2 were evaluated by the Allium cepa test. Due to negligible genototoxic effect and high antitumor activity which is similar to that of cisplatin, 2 could be a candidate for further study as potential drug since the mitotic index is unchanged.
Pt S N L N bloodstream [Cl -]= 100 mM passive diffusion L= Cl or PR3 cytoplasm [Cl-]= 4-10 mM Pt S N L N aquation Pt+ S N OH2 N Pt+ S N N inactivation glutathione ARTICLE HISTORY received 22 July 2016 accepted 8 september 2016 KEYWORDS Biological inorganic chemistry; drugs design and development; platinum(ii) metallodrugs; cytotoxicity; glutathione; genotoxicity
© 2016 informa uK limited, trading as taylor & francis Group
CONTACT m. Poyraz [email protected]; C. n. Banti [email protected]; s. K. hadjikakou [email protected] supplemental data for this article can be accessed at http://dx.doi.org/10.1080/00958972.2016.1241394.
1. Introduction
Platinum-based drugs such as cisplatin, carboplatin, and oxaliplatin are clinically widely used against
different types of tumors [1]. Platinum compounds bind to a variety of cellular targets, especially DNa,
causing distortion in DNa backbone and trigger apoptosis to the cancer cells [2]. Platinum complexes
exhibit high affinity for sulfur-containing biomolecules, such as amino acids (cysteines and methionines),
peptides (glutathione), and proteins (metallothionein) [2, 3]. However, their interaction with
intracellu-lar sulfur residues, like glutathione, leads to inactivation of platinum compounds, and thus to celluintracellu-lar
resistance against platinum together with toxic side effects [2]. The interactions with the HS-groups
of GSH are restricted when the metal complexes have S-bonded ligands [4]. The design of new
metal-lotherapeutics aims for selective metal-based drugs which eliminate cancer cells without toxic effect
against normal cells [5]. especially, platinum(II) and palladium(II) complexes containing N and S donors
with anticancer activities exhibit reduced toxicity compared to cisplatin and its analogs [6].
Thiosemicarbazones have shown antibacterial, antifungal, antitumor, and antiviral activities [7].
Thiosemicarbazones where the side chain is attached α to an N-heterocyclic ring, namely
α-N-hetero-cyclic thiosemicarbazones (N-TSCs), are strong metal chelating agents and show antineoplastic activity
by interaction toward DNa [8, 9]. Particularly, 3-aminopyridine-2-carboxaldehyde thiosemicarbazone
(Triapine, Vion Pharmaceuticals, New Haven, CT) has been selected for Phases I and II clinical trials for
antitumor therapy [9]. Thiosemicarbazone complexes of platinum(II) have proven to be
chemotherapeu-tic agents due to synergischemotherapeu-tic effect of the pharmacological properties of both ligands and metal [10–12].
Only three structures of metal complexes with 1-(1H-benzimidazol-2-yl)ethan-1-one
thiosemicarba-zone (BzimetTSCH) [13] are reported. These include the structures of [BzimetTSC]2Ni [14], ([Zn(NO3)(H2O)
(BzimetTSC)]NO3) [15], and [Co(BzimetTSC) (BzimetTSCH)] [16]. The antimicrobial activity of ([Zn(NO3)
(H2O)(BzimetTSC)]NO3) and [Co(BzimetTSC)(BzimetTSCH)] were evaluated against positive,
Gram-negative bacteria, and the fungi Candida albicans, showing moderate activity [15, 16].
In the course of our studies on the design and development of new metallotherapeutics [17–23],
we have prepared two new platinum complexes of BzimetTSCH (scheme 1), [Pt(BzimetTSCH)Cl]·2H2O
(1) and [Pt(BzimetTSCH)(tpp)]Cl·H2O·MeCN (2) (tpp = triphenylphosphine). Compounds 1 and 2 were
characterized by IR, 1H NMR and single-crystal X-ray diffraction (XRD) analysis. BzimetTSCH was chosen
in order to form stable complexes with Pt(II) which will be able to override the interaction with glu-tathione and reduce cellular resistance. To evaluate the deactivation of 1 and 2 caused by gluglu-tathione, the reactions of 1 and 2 with glutathione (GSH) were investigated by UV-absorption spectroscopy. Compounds 1 and 2 were also used to investigate the influence of the lipophilicity on cancer cell viability, since increasing lipophilicity is expected to improve the permeability of the massive
com-pounds to cell membranes and the activity of metal–phosphine complexes toward cancer cells [24].
Compounds 1 and 2 and BzimetTSCH were tested for their in vitro antiproliferative activity against the human adenocarcinoma cells, MCF-7 (breast) and HeLa (cervix), and the non cancerous cells, MRC-5 (fetal lung fibroblast). The genotoxicities on normal human fetal lung fibroblast cells (MRC-5) caused by 1 and 2 were evaluated by fluorescence microscopy, in vitro. The in vivo genotoxicity of 1 and 2 were evaluated by the Allium cepa test.
N H N N5 6 7 8 9 10 11 12 13 14 15 16 N H CH3 NH2 S 1 2 3 4
2. Results and discussion 2.1. General aspects
Complex 1 was synthesized from the reaction between BzimetTSCH and PtCl2 in ethanol/water
solu-tion under reflux, while 2 was derived by refluxing acetonitrile/ethanol solusolu-tion of BzimetTSCH, tpp,
and PtCl2. Red needle crystals of 1 have been grown from slow evaporation of acetonitrile solution
after recrystallization, while reddish-orange prismatic crystals of 2 were grown from the filtrate of the mother solution after reflux. The formulas of the compounds were initially detected with spectroscopic methods and their structures were determined by single-crystal X-ray diffraction analysis. The crystals of 1 and 2 are air stable when they are stored in the dark at room temperature.
2.2. Solid-state studies 2.2.1. Vibrational spectroscopy
The asymmetric and symmetric stretching of ν(NH2) and ν(NH) bonds, respectively, at 3368, 3181,
3071 cm−1 in the IR spectrum of free ligand BzimetTSCH undergo negligible shifts in 1 and 2,
suggest-ing the non-coordination of the terminal NH2 and N–H of imidazole (figures S1–S3) [25]. The band at
3426 cm−1 assigned to ν(O–H) of free ligand remained in the spectra of the complexes due to the water
molecules co-crystallized.
The bands at 1624 and 842 cm−1 in 1 and at 1615 and 839 cm−1 in 2 are attributed to ν(C=N) and
ν(C=S), respectively. Coordination of the azomethine nitrogen to the metal ion is supported by shift
of the vibrational band of ν(C=N) to higher wavenumbers in 1 and to lower wavenumbers in 2 [16].
Coordination of sulfur causes, in the spectra of both complexes, shift of the ν(C=S) band at 842(1)
and 839(2) cm−1 to lower frequency [26]. The bands at 515 and 501 cm−1 are attributed to ν(C–P) in 2
(figure S4).
2.2.2. Crystal and molecular structure of [Pt(BzimetTSCH)Cl]·2H2O (1) and [Pt(BzimetTSCH(tpp)]
Cl·H2O·MeCN (2)
ORTeP diagrams of 1 and 2 along with their selected bond distances and angles are shown in figures
1 and 2. In the case of 1, one Cl− and one BzimetTSCH are coordinated to Pt(II) forming a square
pla-nar geometry. The BzimetTSCH is coordinated tridentate through S1,N3,N1. Two water molecules are co-crystallized. One phosphorus from tpp, two nitrogens, and one sulfur (N3,N2,S1) from BzimetTSCH form a square planar geometry around platinum(II) in 2. The net charge in 2 is balanced by a chloride counter anion. The bond distances around platinum in 1 are: Pt1–S1 = 2.2505(12), Pt1–N1 = 2.048(3), Pt1–N3 = 1.974(4), and Pt1–Cl1 = 2.3140(11) Å, while the corresponding bond distances in 2 are Pt1– S1 = 2.249(2), Pt1–N3 = 2.057(6), Pt1–N2 = 2.092(6), and Pt1–P1 = 2.257(2) Å. The C10–S1 bond distance
varied from 1.697(4) Å in free ligand, to 1.748(4) (1) and 1.763(8) Å in 2, respectively [16]. The N4–C10
bond length is 1.351 Å in free BzimetTSCH, while for 1 it is 1.328(5) Å and 1.318(9) Å for 2. This shortening is a consequence of the coordination of the ligand to platinum.
The angles around platinum(II) ion deviate from the ideal value of 90° due to electrostatic repul-sions among valance shell electron pairs (VSePR theory). The angles are Cl1–Pt1–S1 = 95.48(4), Cl1– Pt1–N1 = 98.93(9), Cl1–Pt1–N3 = 178.76(11), S1–Pt1–N1 = 165.58(8), S1–Pt1–N3 = 84.92(10), and N1–Pt1–N3 = 80.67(13)° in 1, while in 2 they are P1–Pt1–S1 = 94.25(7), P1-Pt1-N2 = 103.46(18), P1– Pt1–N3 = 177.17(16), S1–Pt1–N2 = 162.29(19), S1–Pt1–N3 = 83.51(17), and N2–Pt1–N3 = 78.8(2)°.
2.3. Solution studies
Since ligand displacement and changes to the structure of the platinum drugs cisplatin, carboplatin,
and oxaliplatin occurred upon their dilution in DMSO [27], the stability of 1 and 2 in DMSO solutions
was tested by UV–vis (figure S5) spectra and 1H NMR (figures S6 and S7) measurements for a period
metal drugs during the biological experiments. No changes were observed between the initial UV or 1H NMR spectra and the corresponding spectra after 48 h confirming retention of the structures in solution.
2.3.1. 1H NMR studies
The 1H NMR spectrum of the BzimetTSCH (figure S8) is dominated by the signals at 12.69, 10.66, and
2.40 ppm which are attributed to H(3N, s), H(8N,s), and H(16CH
3–, s) (scheme 1). The absence of H(3N)
resonance signal in the 1H NMR spectra of 1 and 2, which is observed at 12.70 ppm in the spectrum of
BzimetTSCH (figure S8), suggests coordination of the drug to platinum through N and S donors. The
broad signals at 8.41 ppm in 1 and 8.16 ppm in 2 are assigned to H(8N) which is shifted due to
coordi-nation. The signal at 2.25 ppm in 1 and at 2.55 ppm in 2 correspond to the H(16C) of the CH
3– group.
The assignment of the 1H NMR spectra of both 1 and 2 is based on their crystal structure and indicates
the coordination of the ligands to platinum and retention of the structures in DMSO solution.
2.3.2. 31P NMR studies
The 31P NMR spectrum of 2 confirms the retention in DMSO-d
6 solutions. The signal at −6.849 ppm of
tpp is shifted at 7.240 ppm in 2 upon coordination (figure S9).
Figure 1. orteP diagram together with the numbering of 1. selected bond lengths (Å) and angles [°]: Pt1–Cl1 = 2.3140(11), Pt1– s1 = 2.2505(12), Pt1–n1 = 2.048(3), Pt1–n3 = 1.974(4), n3–n4 = 1.375(5), Cl1–Pt1–s1 = 95.48(4), Cl1–Pt1–n1 = 98.93(9), Cl1–Pt1– n3 = 178.76(11), s1–Pt1–n1 = 165.58(8), s1–Pt1–n3 = 84.92(10), n1–Pt1–n3 = 80.67(13).
2.4. Biological tests
2.4.1. Antiproliferative activity
Complexes 1 and 2 and BzimetTSCH were tested for their in vitro antiproliferative activity against two human adenocarcinoma cell lines, MCF-7 (human breast adenocarinoma cell line), and HeLa (human
cervix adenocarcinoma cell line), by the SRB assay after 48 h of incubation. The IC50 values are
summa-rized in table 1. The lower IC50 value is exhibited by 2 (8.8 ± 0.4 (2) and 13.1 ± 0.4 (1) μΜ, respectively).
Complex 2 exhibits five times higher activity than 1, against MCF-7 cells. The same trend applies against HeLa cells (1.5 times higher activity). Moreover, 2 shows better antiproliferative activity than cisplatin
against both cell lines (the IC50 values of cisplatin are 5.5 and 3.9 μM, respectively). Compounds which
contain tpp are generally more active against MCF-7 or HeLa (table 1) [28, 29]. This might be attributed
to the higher lipophilicity introduced by tpp and through this to better membrane permeability of the platinum complexes.
The toxicities of BzimetTSCH, 1 and 2 are evaluated against normal human fetal lung fibroblast cells
(MRC-5 cells) (table 1). The IC50 values of 1 and 2 are 16 ± 1 (1) and 4.8 ± 0.4 (2) μΜ, respectively. The
therapeutic potency or selectivity of a metallotherapeutic agent could be surveyed by the therapeutic
potency index (TPI). TPI is defined as the IC50 value against normal cell line divided by IC50 value against
cancer cell line of the same or similar tissue. Therefore, the higher the TPI value the better potency of
the metallotherapeutic agent [18]. For MCF-7 cells, the TPI for 1 and 2 are 0.9 and 1.3, respectively,
while against HeLa are 1.2 and 0.5. The corresponding TPI values for the cisplatin are 0.2 and 0.3 against Figure 2. orteP diagram together with the numbering scheme of 2. selected bond lengths (Å) and angles [°]: Pt1–s1–2.249(2), Pt1–P1 = 2.257(2), Pt1–n2 = 2.092(6), Pt1–n3 = 2.057(6), P1–Pt1–s1 = 94.25(7), P1–Pt1–n2 = 103.46(18), P1–Pt1–n3 = 177.17(16), s1-Pt1-n2 = 162.29(19), s1–Pt1–n3 = 83.51(17), n2–Pt1–n3 = 78.8(2).
MCF-7 and HeLa cells, respectively (table 1). BzimetTSCH has no effect to proliferation of cancerous or non-cancerous cells. In conclusion, 2 exhibits stronger cytotoxic activity against adenocarcinoma cells, selectivity against cancerous cells, while it exerts comparable activity with cisplatin.
2.4.2. Computational study
Platinum compounds of tpp exhibit better cytotoxic activity than those without (table 1), which
might be attributed to the higher lipophilicity introduced by tpp (see above). Theoretical cal-culations were performed to rationalize the influence of steric and electronic factors involved in the activity of the compounds. Thus, the dipole moment and frontier orbital energies were
calculated by single point energy calculations at the semi-empirical PM6 level (table 2) [30]. The
other properties in table 2 were calculated using Chemaxon software available at (http://www.
chemicalize.org). all properties were assessed for 1 and 2 as well as known crystal structures which
are included in table 1. The results confirm our assumption about the influence of the lipophilicity
on the compound’s activities since compounds of higher LogP (higher lipophilicity) exhibit better
cytotoxicity (tables 1 and 2).
Table 1. metal complexes against two adenocarcinoma cell lines mCf-7 (breast), hela (cervix), and normal human fetal lung fibro-blast cells (mrC-5 cells).
this work; l1 = thiophene-2-carboxaldehyde-n(4)phenyl thiosemicarbazone; l2 = 5-Chlorothiophene-2-carboxaldehyde-n(4)phe-nyl thiosemicarbazone; l3 = 5-Phel2 = 5-Chlorothiophene-2-carboxaldehyde-n(4)phe-nylthiophene-2-carboxaldeyde-n(4)phel2 = 5-Chlorothiophene-2-carboxaldehyde-n(4)phe-nyl; l4 = 5-nitrothiophene-2-carboxaldehyde-n(4) phenyl thiosemicarbazone; l5 = thiophene-2-carboxaldehyde-n(4)nitrophenyl thiosemicarbazone; l6 = 2,6-diacetylpyridine bis(4n-o-tolylthiosemicarbazone), l7 = 2,6-diacetylpyridine bis(4n-p-tolylthiosemicarbazone; l8 = [3,5-diacetyl-1,2,4-triazol
bis(4-cyclohexylthiosemicarbazone); l9 = thiosemicarbazone- derived from indole-7-carbaldehyde. Complexes IC50 (μΜ) Ref. MCF-7 HeLa MRC-5 1 17.1 ± 0.7 13.1 ± 0.4 15.7 ± 1.2 * 2 3.6 ± 0.4 8.8 ± 0.4 4.8 ± 0.4 * BzimettsCh >30 >30 >30 PtCl2l1 37 [10] PtCl2l2 37 [10] PtCl2l3 105 [10] PtCl2l4 1.7 [10] PtCl2l5 46 [10] [Ptl6] dmso >100 [8] [Ptl7] dmso 44 ± 2 [8] [Pt(h3l8)]2 >100 [28] Pt(l9)(PPh3) 1.49 ± 0.04 [29] Cisplatin 5.5 ± 0.4 3.9 ± 0.1 1.1 ± 0.2 [21, 22]
Table 2. Physico-chemical properties for Pt complexes with thiosemicarbazones.
aPm6 l7 = 2,6-diacetylpyridine bis(4n-p-tolylthiosemicarbazone; l8 = [3,5-diacetyl-1,2,4-triazol
bis(4-cyclohexylthiosemicarba-zone); l9 = thiosemicarbazone- derived from indole-7-carbaldehyde.
Complexes Dipole (D)a e HOMO (eV)a e LUMO (eV)a LogP HBD HBa Volume
Polar Surface area Molec-ular Surface area Molec-ular polariza-bility 1 8.92 −8.24 −2.01 1.96 2 6 293.13 56.56 362.85 36.31 2 4.88 −6.52 −0.69 5.93 2 6 486.37 56.56 779.72 68.42 [Ptl7] dmso 7.84 −8.05 −2.23 6.65 2 9 474.89 57.84 736.99 66.14 [Pt(h3l8)]2 3.32 −8.22 −1.03 9.86 3 11 706.67 90.96 1142.76 94.82 Pt(l9)(PPh3) 6.32 −7.78 −1.09 5.72 1 5 478.15 44.53 759.36 66.89
2.4.3. Cell cycle
In order to rationalize the mechanism of action of 1 and 2 flow cytometry was employed. Since a charac-teristic of apoptosis is the internucleosomal DNa fragmentation, the apoptotic cells can be identified as a
consequence on DNa content frequency histograms with fractional (sub-G1 peak) DNa content [31, 32].
The possible effect of 1 and 2 on the progression of cell cycle was performed to quantify the
percent-age of MCF-7 cells which undergo apoptosis giving a sub-G1 peak. exponentially growing MCF-7 cells
were treated with 1 and 2 in their IC50 values for 48 h, stained with propidium iodide, and the amount
of DNa was analyzed by flow cytometry. Figure 3 illustrates the pronounced effects on the cell cycle
caused from 1 and 2. The control cells (not treated cells), are spread in 5.8% sub-G1 phase, 50.1% in
G0/G1, 23.9% in S, and 17.1% in G2/M phase. after incubation of the MCF-7 cells with 1 and 2, an increase
in the number of apoptotic cells in sub-G1 phase (7.0% (1) and 21.9% (2)) was observed compared to
the control group (5.8%). The percentage of cells in the S phase, however, was increased to 27.1% with 1. The percentage of the non-treated cells in the S phase is 23.9%. Thus, 1 suppresses cell proliferation Figure 3. effects of 1 and 2 on cell cycle against mCf-7 cells. the relative number of cells within each cell cycle was determined by flow cytometry. number of cells in sub-G1, G0/G1, s, and G2/m phase are indicated.
by inhibiting DNa synthesis and inducing S phase cell cycle arrest [33]. The percentage of cells in the
G0/G1 phase when they are treated with 2 is increased to 56.9%, while the non-treated cells (control)
show 50.1% cells in the G0/G1 phase (figure 3). MCF-7 cells were blocked by 2 during the G0/G1 transition
and the number of apoptotic cells increased significantly after 48 h of incubation. Cisplatin analogs 0.0 0.1 0.2 0.3 0.4 0.5 0.6 0.7 420 480 540 600 Wavelength (nm) Ab so rb an ce
1-0min 1-60min 1-120min 1-180min 1-240min 1-300min 1-360min
(A) Ratio 1/1000 0.0 0.1 0.2 0.3 0.4 0.5 0.6 0.7 0.8 0.9 1.0 240 300 360 420 480 540 600 Wavelength (nm) Ab so rb an ce
1-0min 1-60min 1-120min 1-180min 1-240min 1-300min 1-360min
(B) Ratio 1/500 0.0 0.2 0.4 0.6 0.8 1.0 1.2 1.4 1.6 1.8 420 480 540 600 Wavelength (nm) Ab so rb an ce
1-0min 1-60min 1-120min 1-180min 1-240min 1-300min 1-360min
(C)
Ratio 1/250
240 300 360
240 300 360
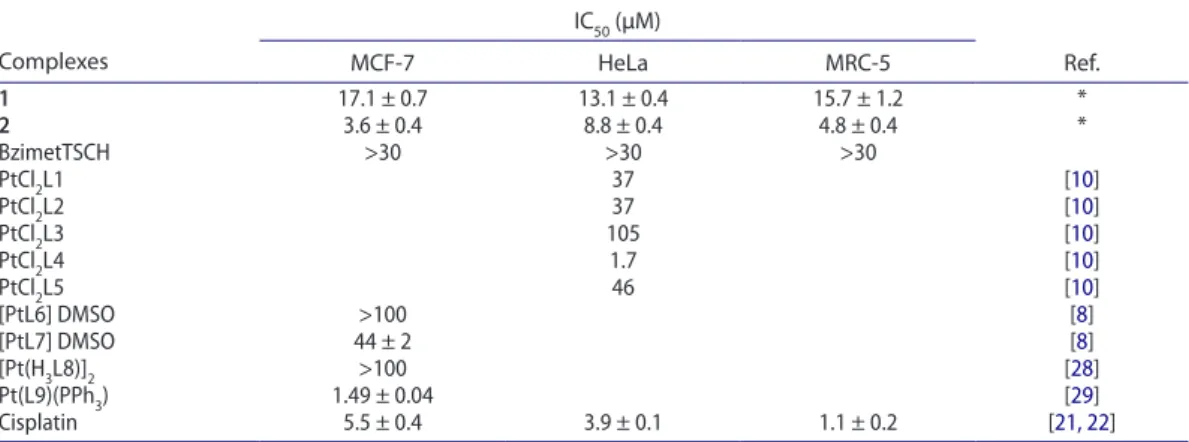
Figure 4. initial uV spectra of the solutions (final volume of 2.0 ml) containing different concentrations of 1, 16.5 (a), 33 (B), and 66 (C) μm in 100 mm tris hCl, ph 7.4 with a high excess of Gsh (16.5 mm) at 37 °C and after 1, 2, 3, 4, 5, and 6 h.
(cis-[PtCI2(CH3SCH2CH2SCH3)], cis-[PtCl2(DMSO)2]), at IC50 concentrations, increased the number of MCF7
cells in G0/G1 phase of cell cycle [34].
0.0 0.1 0.2 0.3 0.4 0.5 0.6 240 300 360 420 480 540 600 Wavelength (nm) Ab so rb an ce
2-0min 2-60min 2-120min 2-180min 2-240min 2-300min 2-360min
(A) Ratio 1/4000 0.0 0.1 0.2 0.3 0.4 0.5 0.6 0.7 0.8 240 300 360 420 480 540 600 Wavelength (nm) Ab so rban ce
2-0min 2-60min 2-120min 2-180min 2-240min 2-300min 2-360min
(B) Ratio 1/2000 0.0 0.1 0.2 0.3 0.4 0.5 0.6 0.7 0.8 0.9 1.0 240 300 360 420 480 540 600 Wavelength (nm) Ab so rb an ce
2-0min 2-60min 2-120min 2-180min 2-240min 2-300min 2-360min
(C)
Ratio 1/1000
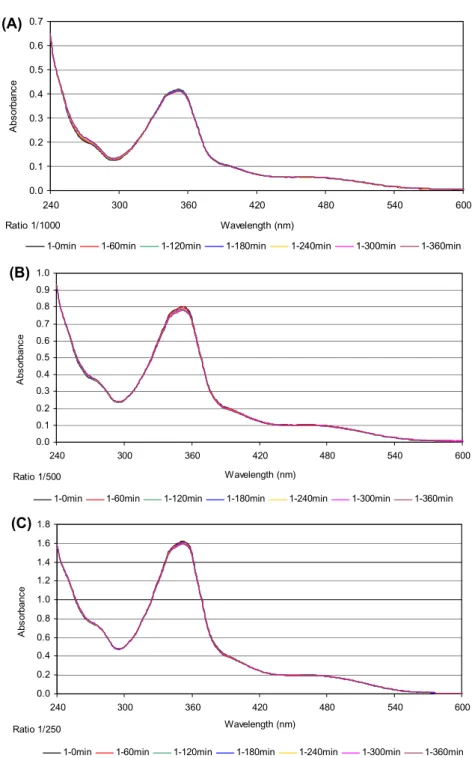
Figure 5. initial uV spectra of the solutions (final volume of 2.0 ml) containing different concentrations of 2, 4.2 (a), 8.3 (B), and 16.5 (C) μm in 100 mm tris hCl, ph 7.4 with a high excess of Gsh (16.5 mm) at 37 °C and after 1, 2, 3, 4, 5, and 6 h.
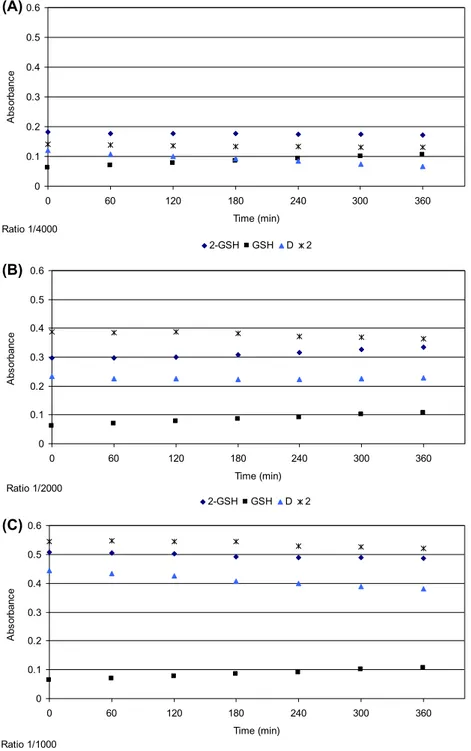
2.4.4. Reaction of 1 and 2 with GSH as monitored by UV absorption
The deactivation of cisplatin, caused by glutathione, is an important determinant of cytotoxic effects. Thus, the reactions of 1 and 2 with glutathione (GSH) were investigated and the results are compared
with the binding affinity of GSH to cisplatin [4]. The presence of sulfur from thiosemicarbazone ligand
in the coordination sphere is expected to eliminate the cell resistance against the metallotherapeutic compounds through GSH. The initial UV spectra of the solutions contain different concentrations of 1 (16.5 (a), 33 (B) and 66 (C) μM) or 2 (4.2 (a), 8.3 (B) and 16.5 (C) μM) in 100 mM Tris-HCl, pH 7.4 with
a high excess of GSH (16.5 mM) at 37 °C and after 1, 2, 3, 4, 5, and 6 h are shown in figures 4 and 5.
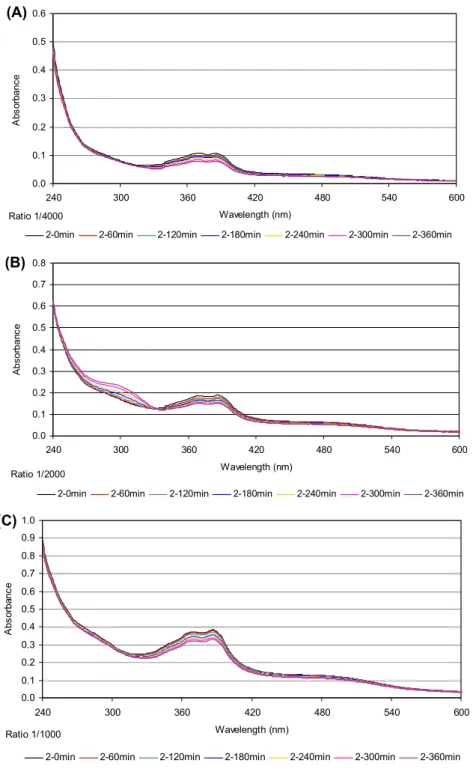
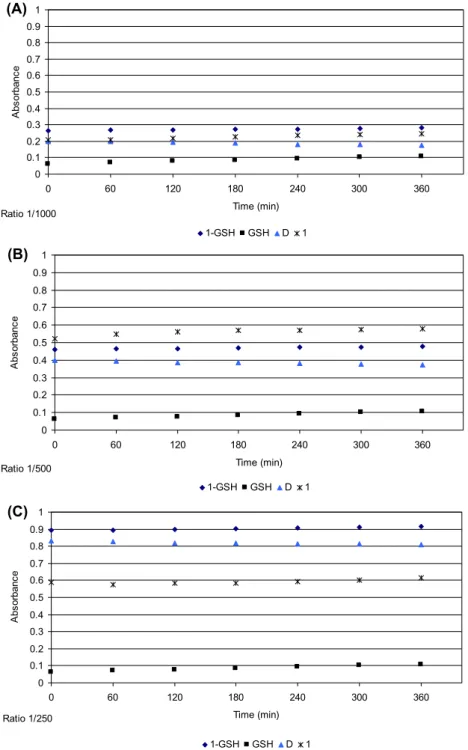
Increasing of absorption intensity in time is due to (i) the reaction of metal complex with GSH (formation of metal-sulfur bonds) and (ii) to the oxidation of GSH (formation of the disulfide GSSG). The diagram of
absorption versus time for GSH alone is shown in figure 6. However, as the rate of disulfide formation is
slow, the concentration of GSH was assumed not to change much, over time during the GSH–complex reaction. Because the GSH concentration is 250 or 1000 fold higher than that of 1 or 2, respectively, the reaction does not deplete GSH. The absorbance associated with GSH–complex formation is obtained
by abstracting the absorbance due to disulfide from the observed absorbance (figures 7 and 8). The
difference shows the change in absorption for reaction of a complex with GSH (because the rate of disulfide formation is not important in the presence of metal complexes). although 1 or 2 and Pt-GSH products absorb at 260 nm, the extinction coefficients of the products are much greater than those of 1 or 2 [35, 36]. Thus, the absorbance at 260 nm is mainly due to formation of Pt-GSH products. Figures
7 and 8 show no increase in absorption, indicating no complex–GSH formation. Thus, 1 and 2 undergo
no deactivation from GSH in contrast to cisplatin [4, 36].
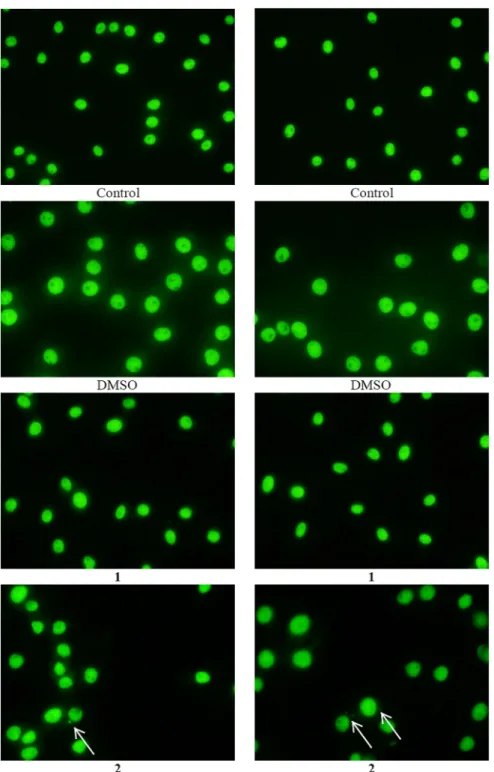
2.4.5. Evaluation of genotoxicity by micronucleus assay
The presence of micronuclei (MN) is a biomarker of mutagenic, genotoxic, or teratogenic agent influence
[37]. The MN can be formed during the transition metaphase–anaphase of the mitosis, upon influence
of an exogenous factor (such as chemical agents). The MN appears as small membrane bound DNa
fragments in the cytoplasm of interphase cells [38]. The MN is unable to be incorporated to daughter
cells [37]. The micronucleus assay has been used in monitoring genetic damage in different tissue and
cell types [39]. Human cell lines in culture are sensitive tools for toxicity screening and they are capable
of reducing the use of animals in toxicological testing [40].
In order to ascertain the genotoxicity of 1 and 2 against MRC-5 normal cells (see above), the possible inductions of micronucleus frequencies was checked. The micronucleus frequencies in the MRC-5 cell culture without treatment is 0.8%, which becomes 0.56% after treatment with DMSO. No micronuclei (0.8%) were detected when 1 was used. although, a slight increase in the micronucleus frequencies is
0.0 0.1 0.1 0.2 0.2 0.3 0.3 0.4 0.4 240 300 360 420 480 540 600 Wavelength (nm) Ab so rb an ce
GSH-0min GSH-60min GSH-120min GSH-180min
GSH-240min GSH-300min GSH-360min
observed when the cells were treated with 2 (1.0%) (figure 9). Therefore, 1 causes no genetic damage to normal cells, indicating no mutagenic, genotoxic, or teratogenic. Complex 2 on the other hand seems to be slightly more genotoxic than 1.
Ratio 1/1000 0 0.1 0.2 0.3 0.4 0.5 0.6 0.7 0.8 0.9 1 0 Time (min) Ab so rbanc e 1-GSH GSH D 1 (A) Ratio 1/500 0 0.1 0.2 0.3 0.4 0.5 0.6 0.7 0.8 0.9 1 0 Time (min) Ab so rban ce 1-GSH GSH D 1 (B) Ratio 1/250 0 0.1 0.2 0.3 0.4 0.5 0.6 0.7 0.8 0.9 1 0 60 120 180 240 300 360 60 120 180 240 300 360 60 120 180 240 300 360 Time (min) Ab so rbanc e 1-GSH GSH D 1 (C)
Figure 7. absorbance at 260 nm for different concentrations of 1, 16.5 (a), 33 (B), and 66 (C) μm incubated with Gsh (16.5 mm) in 100 mm tris hCl, ph 7.4, buffer containing 5 mm naCl at 37 °C vs. time (0–6 h) ( ), Gsh (■), the complex ( ), and the points derived from the subtraction among them (d curve) ( ).
2.4.6. In vivo genotoxicity test
The development of new drugs requires assessment of their potential toxicity. The Allium cepa test is an experimental model which has been employed to evaluate the in vivo potential genotoxicity of 1
0 0.1 0.2 0.3 0.4 0.5 0.6 0 60 120 180 240 300 360 Time (min) Ab so rbanc e 2-GSH GSH D 2 Ratio 1/4000 (A) 0 0.1 0.2 0.3 0.4 0.5 0.6 0 60 120 180 240 300 360 Time (min) Ab so rbanc e 2-GSH GSH D 2 Ratio 1/2000 (B) Ratio 1/1000 0 0.1 0.2 0.3 0.4 0.5 0.6 0 60 120 180 240 300 360 Time (min) Ab so rban ce 2-GSH GSH D 2 (C)
Figure 8. absorbance at 260 nm for different concentrations of 2, 4.2 (a), 8.3 (B), and 16.5 (C) μm incubated with Gsh (16.52 mm) in 100 mm tris hCl, ph 7.4, buffer containing 5 mm naCl at 37 °C vs. time (0–6 h) ( ), Gsh (■), the complex ( ), and the points derived from the subtraction among them (d curve) ( ).
and 2, since it is crucial in the development of new metallotherapeutics [19, 22, 41]. Allium cepa show
high correlation with mammal test systems [41].
Figure 9. micronucleus formed in mrC-5 cells treated with iC50 values of 1 and 2 for a period of 48 h; arrow indicates micronucleus in mrC-5 cells.
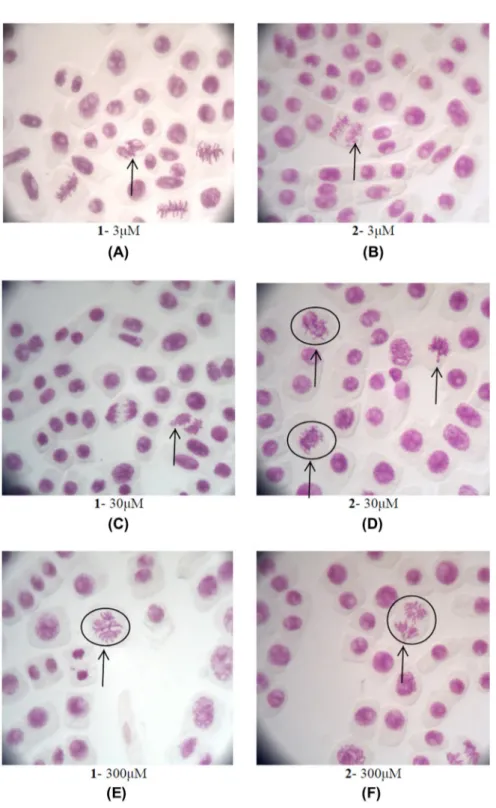
Figure 10. Allium cepa meristematic cells exposed to 1 and 2. (a) Allium cepa meristematic cells exposed with 3 μΜ of 1. metaphase
with chromosome adherence (B) Allium cepa meristematic cells exposed with 3 μΜ of 2. Chromosome losses and bridges at anaphase (C) Allium cepa meristematic cells exposed with 30 μΜ of 1. anaphase with chromosome adherence (d) Allium cepa meristematic cells exposed with 30 μΜ of 2. Chromosome aberration, anaphase with chromosome bridge, and loss observed. Chromosome losses at telophase (e) Allium cepa meristematic cells exposed with 300 μΜ of 1. Chromosome aberration, anaphase with chromosome bridge and loss observed. (f) Allium cepa meristematic cells exposed with 300 μΜ of 2. Chromosome aberration, anaphase with chromosome bridge and loss observed.
The mitotic index % (MI) is defined as the ratio between the cells in a population undergoing mitosis
to the cells not undergoing mitosis [19, 22, 41].
The decrease in the mitotic index (MI) of Allium cepa can be considered as a reliable method to deter-mine the presence of a cytotoxic agent. DNa damages are assessed such as chromosome aberrations (Ca), nuclear abnormalities (Na), and presence of micronucleus (MN). Ca is characterized by changes
in either chromosomal structure or in the total number of chromosomes [19, 22, 41]. The Ca includes
chromosome bridges and breaks and are indicators of a clastogenic action, whereas chromosome losses, delays, and adherence result from aneugenic effects. Na are characterized by morphological alterations in the interphasic nuclei, as a result of exposure in the tested agent. These alterations are observed as lobulated nuclei, nuclei carrying nuclear buds, polynuclear cells, and mini cells. MN are considered as the most effective and simplest endpoint to analyze the mutagenic effect.
The decreasing of the mitotic index observed when Allium cepa is incubated with 1 or 2 at 3, 30, and 300 μΜ for 48 h was associated with appearance of chromosome aberrations (%), the nuclear
abnor-malities (%), and the micronucleus (%) (figure 10). The range of the concentrations studied contains
the IC50 values of 1 and 2 against the cells (table 1). Figure 11 shows the normal prophase, metaphase,
and telophase in Allium cepa meristematic cells in the negative control.
Figure 11. normal prophase (P), metaphase (m), and telophase (d) in Allium cepa meristematic cells in negative control.
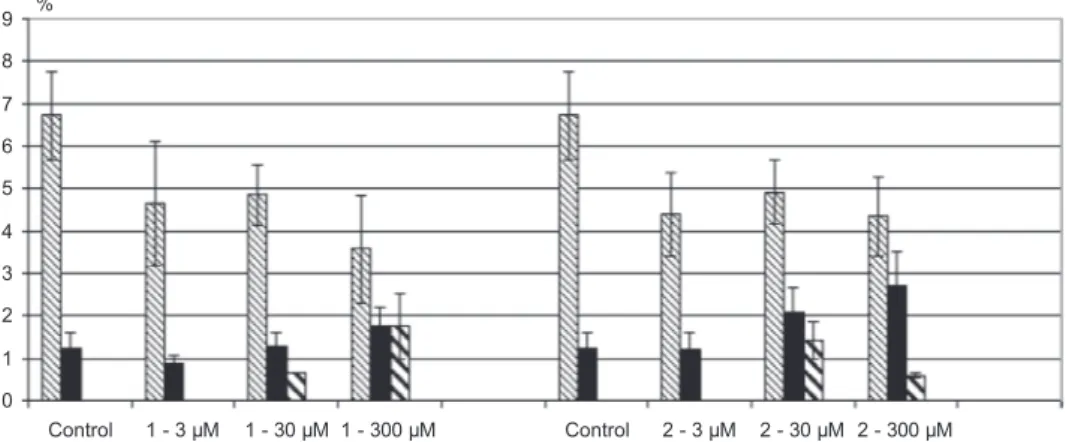
0 1 2 3 4 5 6 7 8 9 Control 1 - 3 µΜ 1 - 30 µΜ 1 - 300 µΜ Control 2 - 3 µΜ 2 - 30 µΜ 2 - 300 µΜ %
Mitotic index Chromosome aberration Nuclear abnormalities Micronucleus
Figure 12. the mitotic index % (mi), the chromosomal aberrations (%), the nuclear abnormalities (%), and the micronucleus (%) observed when Allium cepa was incubated with 1 and 2.
analysis of the mitotic index (MI) reveals a decreasing of cell division index at 300 μΜ for 1 and 2
(MI is 3.6% (1), 4.3% (1) toward 6.7% of the control) (figure 12). The ΜΙ of the cell division of Allium
cepa is affected when they are treated with 1 or 2 with 300 μΜ, indicating they are mutagenic or genotoxic.
The effect in mitotic index caused by 1 or 2 is associated with alteration in the chromosome aberrations (Ca) and the presence of nuclear abnormalities (Na). Chromosome aberrations of Allium cepa in mesophase, metaphase, anaphase, and telophase are shown in figure 12. an increase in the chromosome aberrations was observed by treatment of Allium cepa with 1 and 2 at the high-est concentration of 300 μΜ (Ca = 1.8 (1) and 2.7 (2) %, respectively) toward the negative control (Ca = 1.3%). The most common chromosome aberrations observed are sticky, bridges, and loss
chromosomes (figure 9). Moreover, an increase Na with 1 and 2 at the highest concentration of
300 μΜ (Na = 1.8 (1) and 0.6 (2) %, respectively) is observed toward the negative control (Na = 0%). No MN were observed in accordance with the findings of in vitro genotoxicity studies (see geno-toxicity by micronucleus assay).
3. Conclusion
[Pt(BzimetTSCH)Cl]·2H2O (1) and [Pt(BzimetTSCH)(tpp)]Cl·H2O·MeCN (2) with square planar geometry
were developed to investigate (a) the influence of the lipophilicity since the tpp is expected to improve the permeability of the massive compounds to cell membranes and activity of metal–phosphine com-plexes toward cancer cells and (b) the higher stability of Pt-thiosemicarbazone than the corresponding Pt-glutathione which might be formed in cytoplasm, a factor causing cell resistance to platinum contain-ing anticancer drugs. Compounds 1 and 2 were tested for their antiproliferative activity against human adenocarcinoma breast (MCF-7) and cervix (HeLa) cells. Complex 2 which contains tpp exhibits better cytotoxic activity against MCF-7 cells (five times higher activity against MCF-7) than 1 without tpp. The same trend also appears against HeLa cells. Mixed ligand Pt(II) complexes of thiosemicarbazones and
tpp are more active against MCF-7 or HeLa (table 1). The increase in the number of apoptotic cells in
sub-G1 phase (7.0% (1) and 21.9% (2)) toward the control group (5.8%) suggest apoptotic mechanism
of action of 1 and 2, with 2 showing stronger activity. The
[(1R,2R)-N1–2-amyl-1,2-cyclohexanediamine-N,N′](malonato-O,O′)platinum(II) inducing apoptosis and arresting cells in the G2 phase against HepG2
cells was also shown [42]. The higher cytotoxicity and apoptotic activity of 2 are attributed to the higher
lipophilicity due to the presence of tpp, which leads to better membrane permeability. Computations further support the influence of lipophilicity since compounds with higher logP, generally, exhibit better activity. The reaction of 1 and 2 with GSH show that 1 and 2 undergo no interaction with GSH
in contrast to cisplatin, which reacts with a first-order reaction with GSH [4]. This interaction between
1 and 2 and glutathione is probably restricted by the existence of sulfur from the thiosemicarbazone ligands coordinated to Pt(II). Thus, although the drawback of cisplatin is the eliminations of its thera-peutic activity due to the resistance developed by cancer cells, this might not occur for 1 and 2 since they do not interact with glutathione.
The in vitro cytotoxicity studies show that [Pt(etImt)4]Cl2 (etImt = N-ethyl-13-diazinane-2-thione)
exhibits twofold better activity than cisplatin against MCF7, which is comparable with that of 2
(~2-fold stronger than cisplatin) [43]. Organoplatinum(II) complexes, on the other hand, [PtCl(Saf)(8-OQ)],
[Pt(Saf-1H)(8-OQ)], [PtCl(Meug)(8-OQ)], [Pt(Meug-1H)(8-OQ)], [Pt(eteug-1H)(8-OQ)], and [Pt(eteug-1H) (Q)] (Saf = safrole, Meug = methyleugenol, Meteug = methyl eugenoxyacetate, eteug = ethyleugenoxy-acetate, Q = quinoline, 8-OQ = 8-hydroxyquinolinate, and Q-CO = quinolin-2-carboxylate) were also tested against MCF-7 cells, indicating strong activity (2.09, 1.74, 9.04, 4.86, 1.67, and > 210.18 μM,
respec-tively), which however is comparable with 2 (3.6 μΜ) [44].
The absence of micronucleus when MRC-5 cells were treated with 1 and 2 confirms in vitro non geno-toxic behavior. The absence of nuclear abnormalities in vivo confirms the non-genogeno-toxic manner of 1 and 2. Therefore, 2 shows better activity against adenocarcinoma cancer cells, selectivity against cancerous
over normal cells, and better activity than cisplatin, with meaningless or no genotoxicity in vitro or in vivo. In conclusion, 2 could be a possible candidate for further study as a new chemotherapeutic agent. 4. Experimental
4.1. Materials and instruments
all the chemicals and solvents were spectroscopic and analytical grade and used as received from com-mercial sources. The FT-IR spectra were recorded on a Shimadzu IRaffinity-1S FT-IR spectrophotometer
from 4000 to 400 cm−1 using KBr pellets. The 1H and 31P NMR spectra were recorded on a Bruker aC
250 MHz FT-NMR instrument in DMSO-d6 solution. a UV-1600 PC series spectrophotometer of VWR was
used to obtain electronic absorption spectra.
4.2. Synthesis and crystallization of BzimetTSCH, [Pt(BzimetTSCH)Cl]·2H2O (1) and
[Pt(BzimetTSCH)(tpp)]Cl·H2O·MeCN (2)
BzimetTSCH: BzimetTSCH was synthesized following a previously described method [16]. a mixture of 2-acetylbenzimidazole (5 mmol), thiosemicarbazide (5 mmol), and 1 mL of acetic acid in 50 mL of ethanol was refluxed for 6 h. The product precipitated in a cooled solution, and was filtered and recrystallized from ethanol (max. yield: 80%).
IR (KBr, cm−1): ν(OH) + ν(NH
2) + ν(NH) 3426(br), 3368(m), 3181(w), 3071(br); ν(C=N) + δ(NH2) 1620–
1610 (vs); δ(NH) 1543 (s); ν(ring) + δ(NCS) 1499 (s), 1468 (m), 1447 (m); ν(C=S) + γ(CH) 846(m); γ(CH)
766 (m); δ(ring) 656 (s). 1H NMR (ppm) in DMSO-d
6: 12.69 (s, H(3N)), 10.66 (s, H(8N)), 8.53–7.11 (aromatic
proton), 2.40 (s, H16C of methyl group)), etOH used as solvent for the synthesis: 3.44 (q, –CH
2–, etOH),
1.06 (t, CH3– etOH).
4.3. [Pt(BzimetTSCH)Cl]·2H2O] (1)
a suspension of PtCl2 (0.0665 g, 0.25 mmol) in ethanol (50 mL) and water (10 mL) was stirred half an
hour at 40 °C. a solution of the ligand (0.058 g, 0.25 mmol) in ethanol (10 mL) was added to the sus-pension. The resulting mixture was stirred under reflux for at least 6 h. The mixture was filtered while hot and the filtrate was left for slow evaporation at room temperature. Small red needle crystals were recrystallized from acetonitrile giving X-ray quality red needles.
1: Red crystal; elemental analysis found: C, 23.50; H, 2.95; N, 13.94; S, 6.83%. Calculated for
C10H14ClN5O2PtS: C, 24.08; H, 2.83; N, 14.04; S, 6.43%. IR (KBr, cm−1): ν(OH) + ν(NH
2) + ν(NH) 3470(m),
3330(m), 3171(w) 3065(w); ν (C=N) + δ(NH2) 1624(vs); δ(NH) 1559(m); ν(ring) + δ(NCS) 1500(s), 1477(vs),
1447(m); ν (C=S) + γ(CH) 842(m); γ(CH) 755(m); δ(ring) 638(m). 1H NMR (ppm) in DMSO-d
6: 8.41 (s, H(8N)),
8.12–7.31 (aromatic protons of BzimetTSCH), 2.25 (s, 3H(16C)).
4.4. [Pt(BzimetTSCH)(tpp)]Cl·H2O·MeCN (2)
PtCl2 (0.0665 g, 0.25 mmol) in acetonitrile (40 mL) was refluxed for 1 h giving a yellow solution. a mixture
of a solution of the ligand (0.058 g, 0.25 mmol) in ethanol (10 mL) and a solution of triphenylphosphine (0.0656 g, 0.25 mmol) in ethanol (10 mL) were added to the yellow solution. The resulting mixture was refluxed for 6 h. The mixture was filtered and the filtrate left for slow evaporation at room temperature, giving X-ray quality reddish-orange prismatic crystals.
2: Reddish-orange crystal; elemental analysis found: C, 45.55; H, 3.75; N, 10.44; S, 3.92 %. Calculated
for C30H30ClN6OPtPS: C, 45.95; H, 3.85; N, 10.72; S, 4.09%. IR (KBr, cm-1): ν(OH) + ν(NH
2) + ν(NH) 3447(br),
3295(br), 3145(w) 3060(w); ν(C=N) + δ(NH2) 1615(s); δ(NH) 1559(m); ν(ring) + δ(NCS) 1500(s), 1477(vs),
1437(s); ν(C=S) + γ(CH) 839(s); γ(CH) 744(s); δ(ring) 632(m); ν(C–P) 515(s), 501(m). 1H NMR (ppm) in
4.5. X-ray structure determination
Suitable crystal was selected for data collection which was performed on a Bruker D8 QUeST
diffrac-tometer equipped with graphite-monochromated Mo-Kα radiation. Data reduction was performed with
aPeX II [45]. Data were corrected for absorption effects using the multi-scan method (SaDaBS) [46]. The
frames were integrated with the Bruker SaINT software package [47] using a narrow-frame algorithm.
The structures were solved with direct methods using SHeLXS97 [48] and refined by full-matrix
least-squares procedures on F2 with SHeLXL97 [49]. all non-hydrogen atoms were refined anisotropically;
hydrogens were located at calculated positions and refined via the “riding model” with isotropic thermal
parameters fixed at 1.2 (1.3 for CH3 groups) times the Ueq of the appropriate carrier atom.
1: C10H10ClN5PtS, 2(H2O), MW = 498.86, monoclinic, space group P21/c, a = 6.8916(4), b = 21.9580(14),
c = 9.6392(6) Å, α = 90, β = 100.944(2), γ = 90°, V = 1432.13(15) Å3, Z = 4, T = 293 K, ρ (Calcd) = 2.314 g cm−3, μ = 10.138 mm−1, F(0 0 0) = 944. 33,943 reflections measured, 3273 unique (R
int = 0.039). The final
R1 = 0.0249 (for 2984 reflections with I > 2s(I)) and wR(F2) = 0.0514 (all data) S = 1.24.
2: C28H25N5PPtS, C2H3N, Cl, H2O, MW = 784.17, monoclinic, space group P21/n, a = 10.505(5),
b = 21.722(5), c = 14.104(5) Å, α = 90, β = 95.110(5), γ = 90°, V = 3206(2) Å3, Z = 4, T = 293 K, ρ
(Calcd) = 1.625 g cm−3, μ = 4.609 mm−1, F(0 0 0) = 1544. 68,047 reflections measured, 5641 unique
(Rint = 0.072). The final R1 = 0.0452 (for 4992 reflections with I > 2s(I)) and wR(F2) = 0.1116 (all data)
S = 1.19.
Crystallographic data (excluding structure factors) for the structures reported in this article have been deposited with the Cambridge Crystallographic Data Center as supplementary publication nos. CCDC-1453335 (1) and -1453336 (2). Copies of the data can be obtained free of charge on application to CCDC,
12 Union Road, Cambridge CB2 1eZ, U.K. (Fax: (+44) 1223–336-033; e-mail: [email protected]).
4.6. Biological tests 4.6.1. Cells screening
Biological experiments were carried out in DMSO Dulbecco’s modified eagle’s medium solutions for 1 and 2. Stock solutions of 1 and 2 (0.01 M) in DMSO were freshly prepared and diluted with cell culture
medium to the desired concentration (0.5–30 μM). Results are expressed in terms of IC50 values, which
is the concentration of drug required to inhibit cell growth by 50% compared to control, after 48 h incubation of the complexes with cell lines. The cell viability was determined by SRB assay as previously
described [22].
4.6.2. Cell cycle
MCF-7 cells were seeded at 105 cells/well in six-well plates at 37 °C for 24 h. Cells were treated with 1
and 2 at the indicated IC50 values for 48 h. afterward, the cells were trypsinized and washed twice with
phosphate-buffered saline (PBS) and separated by centrifugation. With the addition of 1 mL of cold 70% ethanol, the cells were incubated overnight at −20 °C. For analysis, the cells were centrifuged and
trans-ferred into PBS, incubated with RNase (0.2 mg mL−1), and propidium iodide (0.05 mg mL−1) for 40 min
at 310 K and then analyzed by flow cytometry using a FaCS Calibur flow cytometer (Becton Dickinson, San Jose, Ca, U.S.a.). For each sample, 10,000 events were recorded. The resulting DNa histograms were
drawn and quantified using FlowJo software (version FlowJo X 10.0.7r2) [50].
4.6.3. Reaction of 1 and 2 with GSH as monitored by UV absorption
This study was performed as reported previously [4].
4.6.4. Micronucleus
a micronucleus test was performed with the following literature procedure [51, 52]. MRC-5 cells were
seeded (at a density of 2 × 10⁴ cells/well) in glass cover slips which were afterward placed in six-well
2 in IC50 values for 48 h. after exposure of 1 and 2, the cover slips were washed three times with PBS and with a hypotonic solution (75 mM KCl) for 10 min at room temperature. The hypotonized cells were fixed by at least three changes of 1/3 acetic acid/methanol. The cover slips were also washed with cold
methanol containing 1% acetic acid. The cover slips were stained with acridine orange (5 μg mL−1) for
15 min at 37 °C. after, the cover slips were rinsed three times with PBS to remove any excess acridine orange stain. The number of micronucleated cells per 1000 cells was determined.
4.6.5. In vivo genotoxicity test
Small bulbs (1.5–2.0 cm in diameter) of the common onion, Allium cepa, were purchased from a local market. Prior to initiating the test, the outer scales of the bulbs and the dry bottom plate were removed without destroying the root primordia. Bulbs of Allium cepa were placed in test tubes (10 mL) which were filled with water and placed in the incubator at 25 °C, 50–60% humidity and 12 h/day lighting for 48 h. aliquots from complex stock solutions (0.01 M in DMSO) were added in the test tubes to incubate the bulbs with the complexes, at 3, 30, and 300 μΜ. Onion bulbs (two per dose) were exposed to the platinum compounds for 48 h. The roots growing in mineral water were used as a control. The roots were then fixed in 1:3 acetic acid–methanol solutions for 24 h at 4 °C, and finally stored in 70% ethanol. Root tips were hydrolyzed in 6 N HCl at 37 °C for 5 min followed by one wash of 1 min in distilled water before staining in Schiff’s reagent for 40 min. after the root caps were removed from well stained root tips, 1 mm of the meristematic was immersed in a drop of 45% acetic acid on a clean slide and squashed into single cells using the eraser end of a pencil to apply pressure. In order to evaluate the rate of the cellular division the microscopic parameter of the mitotic index was determined. all categories were analyzed by counting 1800 cells per concentration (300 cells per slide, total of six slides).
Acknowledgements
CNB and SKH would like to thank (i) the Unit of bioactivity testing of xenobiotics, the University of Ioannina, for providing access to the facilities, (ii) the atherothrombosis Research Centre of the University of Ioannina for providing access to the flow cytometer, (iii) the Josef and esther Gani Foundation for the financial support (project number 81455), and (iv) the State Scholarships Foundation of Greece (IKy) for the post doctoral research fellowship of excellence program IKy-Siemens (project number 22957).
Disclosure statement
No potential conflict of interest was reported by the authors.
References
[1] y. Jung, S.J. Lippard. Chem. Rev., 107, 1387 (2007).
[2] H. Khan, a. Badshah, G. Murtaz, M. Said, Z.U. Rehman, C. Neuhausen, M. Todorova, I.S. Butler. Eur. J. Med. Chem., 46, 4071 (2011).
[3] K.J. Barnham, M.I. Djuran, P. del Socorro Murdoch, J.D. Ranford, P. Sadler. Inorg. Chem., 35, 1065 (1996).
[4] C.N. Banti, L. Kyros, G.D. Geromichalos, N. Kourkoumelis, M. Kubicki, S.K. Hadjikakou. Eur. J. Med. Chem., 77, 388 (2014). [5] N.C. Campanella, M. da Silva Demartini, C. Torres, e. Tonon de almeida, C. Marli Cação Paiva Gouvêa. Genet. Mol Biol.,
35, 159 (2012).
[6] G. Faraglia, D. Fregona, S. Sitran, L. Giovagnini, C. Marzano, F. Baccichetti, U. Casellato, R. Graziani. J. Inorg. Biochem.,
83, 31 (2011).
[7] H. Beraldo, D. Gambino. Mini-Rev. Med. Chem., 4, 31 (2004). [8] a.I. Matesanz, I. Leitao, P. Souza. J. Inorg. Biochem, 125, 26 (2013).
[9] a.I. Matesanz, C. Hernández, a. Rodríguez, P. Souza. Dalton Trans., 40, 5738 (2011).
[10] a. Karaküçük-İyidoğan, D. Taşdemir, e. elçin Oruç-emre, J. Balzarini. Eur. J. Med. Chem., 46, 5616 (2011).
[11] T.T. Tavares, D. Paschoal, e.V.S. Motta, a.G. Carpanez, M.T.P. Lopes, e.S. Fontes, H.F. Dos Santos, H. Silva, R.M. Grazul, a.P.S. Fontes. J. Coord. Chem., 67, 956 (2014).
[12] a.a. ali, H. Nimir, C. aktas, V. Huch, U. Rauch, K.H. Schäfer, M. Veith. Organometallics, 31, 2256 (2012). [13] M. Poyraz, H. Berber, C. Ogretir. ARKIVOC, 8, 309 (2007).
[15] M. Poyraz, M. Sarı, a. Güney, F. Demirci, S. Demirayak, e. Şahin. J. Coord. Chem., 61, 3276 (2008). [16] M. Poyraz, M. Sari, F. Demirci, M. Kosar, S. Demirayak, O. Büyükgüngör. Polyhedron, 27, 2091 (2008).
[17] C.N. Banti, a.D. Giannoulis, N. Kourkoumelis, a. Owczarzak, M. Kubicki, S.K. Hadjikakou. Dalton Trans., 43, 6848 (2014). [18] C.N. Banti, L. Kyros, G.D. Geromichalos, N. Kourkoumelis, M. Kubicki, S.K. Hadjikakou. Eur. J. Med. Chem., 77, 388 (2014). [19] I. Sainis, C.N. Banti, a.M. Owczarzak, L. Kyros, N. Kourkoumelis, M. Kubicki, S.K. Hadjikakou. J. Inorg. Biochem., 160, 114
(2016). doi:10.1016/j.jinorgbio.2015.12.013.
[20] D.B. Shpakovsky, C.N. Banti, G. Beaulieu-Houle, N. Kourkoumelis, M. Manoli, M.J. Manos, a.J. Tasiopoulos, S.K. Hadjikakou, e.R. Milaeva, K. Charalabopoulos, T. Bakas, I.S. Butler, N. Hadjiliadis. Dalton Trans., 41, 14568 (2012).
[21] a. Han, I.I. Ozturk, C.N. Banti, N. Kourkoumelis, M. Manoli, a.J. Tasiopoulos, a.M. Owczarzak, M. Kubicki, S.K. Hadjikakou.
Polyhedron, 79, 151 (2014).
[22] O.S. Urgut, I.I. Ozturk, C.N. Banti, N. Kourkoumelis, M. Manoli, a.J. Tasiopoulos, S.K. Hadjikakou. Mater. Sci. Eng., C, 58, 396 (2016).
[23] C.N. Banti, D.C. Charalampou, N. Kourkoumelis, a.M. Owczarzak, M. Kubicki, S.K. Hadjikakou, N. Hadjiliadis. Polyhedron,
87, 251 (2015).
[24] S.J. Berners-Price, R.J. Bowen, P. Galettis, P.C. Healy, M.J. McKeage. Coord. Chem. Rev., 185–186, 823 (1999).
[25] e. Ramachandran, P. Kalaivani, R. Prabhakaran, N.P. Rath, S. Brinda, P. Poornima, V. Vijaya Padmad, K. Natarajan.
Metallomics, 4,218 (2012).
[26] M.C. Rodrı́guez-argüelles, e.C. López-Silva, J. Sanmartı́n, a. Bacchi, C. Pelizzi, F. Zani. Inorg. Chim. Acta, 357, 2543 (2004). [27] M.D. Hall, K.a. Telma, K.-e. Chang, T.D. Lee, J.P. Madigan, J.R. Lloyd, I.S. Goldlust, J.D. Hoeschele, M.M. Gottesman.
Cancer Res., 74, 3913 (2014).
[28] a.I. Matesanz, J. Perles, P. Souza. Dalton Trans., 41, 12538 (2012).
[29] a.a. Ibrahim, H. Khaledi, P. Hassandarvish, H. Mohd ali, H. Karimian. Dalton Trans., 43, 3850 (2014). [30] J.J.P. Stewart. J. Mol. Model., 13, 1173 (2007).
[31] M. Kajstura, H.D. Halicka, J. Pryjma, Z. Darzynkiewicz. Cytometry Part A, 71A, 125 (2007). [32] y.H. Shiao, S.H. Lee, K.S. Kasprzak. Carcinogenesis, 19, 1203 (1998).
[33] K. Zhang, X. Zhao, J. Liu, X. Fang, X. Wang, X. Wang, R. Li. Oncol. Lett., 7, 881 (2014).
[34] G. Bogdanović, V. Kojić, T. Srdić, D. Jakimov, M.I. Djuran, Ž.D. Bugarčić, M. Baltić, V.V. Baltić. Met. Based Drugs, 9, 33 (2002). [35] J.C. Dabrowiak, J. Goodisman, a.-K. Souid. Drug Metab. Dispos., 30, 1378 (2002).
[36] a. Halámiková, P. Heringová, J. Kašpárková, F.P. Intini, G. Natile, a. Nemirovski, D. Gibson, V. Brabec. J. Inorg. Biochem.,
102, 1077 (2008).
[37] O. Torres-Bugarín, M. Guadalupe Zavala-Cerna, a. Nava, a. Flores-García, M. Luisa Ramos-Ibarra. Dis. Markers, ID 956835 (2014).
[38] y. Li, D.H. Chen, J. yan, y. Chen, R.a. Mittelstaedt, y. Zhang, a.S. Biris, R.H. Heflich, T. Chen. Mutat. Res., 745, 4 (2012). [39] a. Celik, O. Ogenler, U. Comelekoglu. Mutagenesis, 20, 411 (2005).
[40] S.C. Sahu, S. Roy, J. Zheng, J.J. yourick, R.L. Sprando. J. Appl. Toxicol., 34, 1200 (2014). [41] D.M. Leme, M.a. Marin-Morales. Mutat. Res., 682, 71 (2009).
[42] a. Lyu, X. Qin, L. Fang, S. Gou. J. Coord. Chem., 69, 1653 (2016).
[43] a. Zainelabdeen, a. Mustafa, M. Monim-ul-Mehboob, M.y. Jomaa, M. altaf, M. Fettouhi, a.a. Isab, M.I.M. Wazeer, H. Stoeckli-evans, G. Bhatia, V. Dhuna. J. Coord. Chem., 68, 3511 (2015).
[44] T. Thi Da, L. Thi Hong Hai, L. Van Meervelt, N. Huu Dinh. J. Coord. Chem., 68, 3525 (2015). [45] APEX II, Bruker aXS Inc., Madison, Wisconsin, USa (2013).
[46] SADABS, Bruker aXS Inc., Madison, Wisconsin, USa (2012). [47] SAINT, Bruker aXS Inc., Madison, Wisconsin, USa (2013). [48] G.M. Sheldrick. Acta Crystallogr., Sect. A, 46, 467 (1990).
[49] G.M. Sheldrick. SHELXL-97, Program for the Refinement of Crystal Structures, University of Göttingen, Germany (1997). [50] S.H. van Rijt, I. Romero-Canelón, y. Fu, S.D. Shnyder, P.J. Sadler. Metallomics, 6, 1014 (2014).
[51] T. Matsushima, M. Hayashi, a. Matsuoka, M. Ishidate Jr, K.F. Miura, H. Shimizu, y. Suzuki, K. Morimoto, H. Ogura, K. Mure, K. Koshi, T. Sofuni. Mutagenesis, 14, 569 (1999).
![Figure 1. orteP diagram together with the numbering of 1. selected bond lengths (Å) and angles [°]: Pt1–Cl1 = 2.3140(11), Pt1–](https://thumb-eu.123doks.com/thumbv2/9libnet/5418843.103007/4.739.131.617.75.568/figure-ortep-diagram-numbering-selected-bond-lengths-angles.webp)