East J Med 24(4): 490-496, 2019 DOI: 10.5505/ejm.2019.46873 ORIGINAL ARTICLE
The Relationship Between Calcium Metabolism
Parameters
Saliha Yildiz1 , Mustafa Öztürk2
1Department of Endocrinology, Van Yuzuncu Yil University 2Department Endocrinology, Medipol University, İstanbul
Introduction
Calcium and phosphorus homeostasis are mostly mediated by three hormones acting on intestine, kidney and bone: namely parathyroid hormone (PTH), 1,25 dihydroxy vitamin D (1,25 (OH), D - calcitriol) and calcitonin.
In this study, we aimed to investigate and describe all of the above-mentioned calcium metabolism parameters (except calcitonin) and the closely related Mg levels in the patient population.
Materials and Methods
Ethics committee approval was obtained for this retrospective study. Van Yuzuncu Yil University Medical Faculty Hospital database was scanned. Study included results of 25 (OH) vitamin D3 (ng/ml), Ca (mg/dl), P (mg/dl), Mg (mg/dl), iPTH (pg/ml) and Ca (mg/dl) -creatinine (mg/dl) from 3/9/2009 to 21/5/2012 that were performed on the same blood sample. The results of patients under 15 years of age were not included to the study.
Roche modular P800 device was used by photometric method with commercial kit to evaluate calcium, phosphorus and magnesium. Arcitect ABBOT device was used by chemiluminescence method with commercial kit to evaluate parathormon. 25OH vitamin D Agilent 1200 was studied by HPLC method. The COBAS Integra 800 device was used with a photometric method using a commercial kit for spot urine sample. Two groups were formed as male and female.
Three different groups were formed for calcium values: normal and non-normal (below 8.5 or above 10.5 mg/dl); low and not low (<8.5 and ≥8.5 mg/dl), high and not high (>10.5 and ≤510.5 mg/dl). In addition, analysis was carried out in groups of 0.5 mg/d starting from 7 for calcium values.
25-OH vitamin D was grouped as those with and without severe vitamin D deficiency (<10 and ≥10ng/ml), with or without vitamin D deficiency (<20 and≥20 ng/ml). They were also divided into groups of 4.99 and below, 5 to 9. 99, 10 to 19.99, 20 to 29.99, 30 and above. Phosphor values were
ABSTRACT
Blood calcium is under very tight control in a narrow range of 8.5-10.5 mg/dl. We aimed to investigate the factors that contributed to this control.
464 females and 254 males aged 16-96 years were examined retrospectively. PTH, 25OH vitamin D, Ca, Mg, P and spot urine calcium, creatinine levels were examined.
The rates were as follow; hypercalcemia 5.6%, primary hyperparathyroidism 10.4%, secondary hyperparathyroidism 40.8%, tertiary hyperparathyroidism 17.5%, normal PTH hypercalcemia 1.25%, hypocalcemia 13.5%, hypoparathyroidism 3.7%, hypovitaminosis D 77.6%, hypophosphatemia 6.4%, hyperphosphatemia 17.5%, hypomagnesemia 17.5%, hypermagnesemia 10.4%.
Severe vitamin D deficiency was found as 37% (n= 172) in females and 20% (n= 53) in males (p <0.01). Urinary Ca and urine creatinine 25 OH vitamin D cut-off value was 10 ng/ml and it was 13ng/ml for PTH. While vitamin D was 10-20 ng/ml, urine Ca/creatinine ratio was lowest and it increased after 20 ng/ml in females and 30 ng/ml in males. There was a negative correlation with PTH as Ca decreased from 8.3 mg/dl and a positive correlation when it increased above 9.2 mg/ dl. Mg correlated positively with PTH, Ca and P (p= 0.00 r= 0.23, p= 0.007 r= 0.13, p= 0.00 r= 0.21, respectively). Mg was found to be significantly correlated with all parameters and 25 OH vitamin D was not correlated with any parameters. On the other hand, we have determined the threshold values where the parameters interact with each other.
grouped as normal and non-normal (below 2.5 or above 4.5 mg / dl); high and non-high (> 4.5 and ≤ 4.5 mg/dl) and non-low (<3 and ≥3mg/dl). Magnesium was grouped as normal and non-normal (<1.8 or > 3 mg/dl), low or non-low (<1.8 or ≥1.8mg/dl), (<2 or ≥2 mg/dl) high and non-high (> 3 or ≤3 mg/dl).
The lower limit for PTH was accepted as <30 pg/ml. Parathyroid hormone was grouped in 3 levels; low and non-low (<30 and ≥30pg/ml); high and non-high (≥65 and <65 pg/ml), high and very high (> 300 and ≤300 pg/ml). Calcium/creatinine ratio in spot urine was calculated and 0.06-0.20 mg / dl: was accepted as normal.
Age, 25OH vitamin D, PTH, Ca, P, Mg, spot urine fractionated Ca excretion (spot urine Ca/spot urinary creatinine), CaxP relationships were also investigated in addition to the groups defined above.
Student t test was used to determine the relationship between the parameters. In addition, Pearson correlation coefficient was calculated for the relationship between the parameters. The gender was analyzed by Chi-square test. Statistical significance level was taken as p <0.05 (5%). SPSS 16.0 software program was used.
Results
Of the 718 patients aged between 16-96 years, 64.6% were women (n꞊ 464) and 35.4% were men (n꞊254) (Table 1). It was found that 53.2% of patients had Mg (n꞊382) and 23.4% of them had spot urine calcium and creatinine (n꞊ 168). Calcium was detected in 13.5% of the patients below 8.5 mg/dl (n꞊97), in 5.6% of above 10.5 mg/dl (n꞊40). 25 OH vitamin D <10 ng/ml was 40% (55/137) (14 cases with> 10.5) in the non-normal group and 29% in the non-normal group (170/581) (p = 0.013) (Table 2).The mean vitamin D level was 23.23 ng/ml. 25 OH vitamin D levels were below10 ng/ml in 31.3% of patients (n= 225) , below 20 ng/ml in 61.4% (n: 441), below 30 ng/ml in 77.6% (n= 557), and above 150 ng/ml in 0,5% (n꞊ 4). Severe vitamin D deficiency was 37% in females (n= 172) and 20% (n꞊53) in males (p <0.01) (Table 2). PTH was found to be 45% (99/216), 36% (82/225) in the normal range in moderate and severe hypovitaminosis D. PTH was 65 pg/ml and above in 55.6% (n: 399), below 30 pg/ml in 8.4% (n= 60), 120 pg/ml and above in 27.9% (n= 201), above 300 pg/ml in
13.4% (n꞊96) and above 600 pg/ml in 6.5% (n= 47). A significant difference was observed in PTH in 39% of females (n=184) and in 53% of males (n꞊135) as <65 pg/ml (p <0.01). Again in 6% of females (n꞊ 30), 11% (n=30) of males PTH was <30 and significantly different (p=0.013) (Table 2).
Phosphorus levels were found to be less than 2.5 mg/dl (n꞊46) in 6.4%, below 3 mg/dl (n=134) in 18.7%, and above of 4.5 mg / dl in 17.5% (n=126). PTH was > 300 pg/ml in 42 patients (7%) with phosphorus ≤4,5 mg/dl group, 54 in 126 patients (43%) with phosphorus> 4.5 mg / dl group (p <0.01) (Table 2). Blood Mg levels were; below 1.8 mg/dl in 17.5% (n=67), above 2.6 mg/dl in 10.4% (n꞊40), above 3 mg/dl in 1.5% (n=6), in normal range in 80.8% (n꞊309). Mg; correlated positively with PTH, Ca and P (p=0.00 r=0.23, p=0.007 r=0.13, p=0.00 r=0.21, respectively).
When vitamin D was 10-20 ng/ml urine Ca/creatinine ratio was lowest, it increased after 20 ng/ml in females and 30 ng/ml in males. Median difference Ca excretion increased from PTH> 200 pg/ml, it was highest at 300-599 pg/ml and it decreased after 600 pg/ml. In 1.25% (n=9) of patients with hypercalcemia suggesting malignancy, PTH levels were found in normal limits and Female/Male ratio was 6/3. There was no significant difference in age between these cases and those without (48.8±16.5 and 44.5±16.4 p=0.28).
Primary hyperparathyroidism (PH) (n=73) was detected in 10.16% of the patients. Female/Male ratio was 54/19 and there was no significant difference when compared with those without PH (p=0.09). The ages of the patients with PD were significantly greater than those without (51.4±17.5, 43.8±16.1; p꞊0.00). Secondary hyperparathyroidism (SH) (n=293) was detected in 40.8% of the patients. Female/Male ratio was 215/78 and there was a significant difference compared to those without (p= 0.00). The ages of patients with SH were significantly higher than those without (46.4±17.3, 43.3±15.6; p=0.014). Tertiary hyperparathyroidism (TH) (n=126) due to renal failure was detected in 17.5% of patients. Female/Male ratio was 78/48 and there was no significant difference with the non-TH (p=0.47). The age of the patients with TH was significantly higher than that of those without (respectively 50.7±17.7, 43.3±15.8; p= 0.00) (Table 2). Hypoparathyroidism (HP) (n=27) was detected in 3.7% of the patients. 19 of the patients were
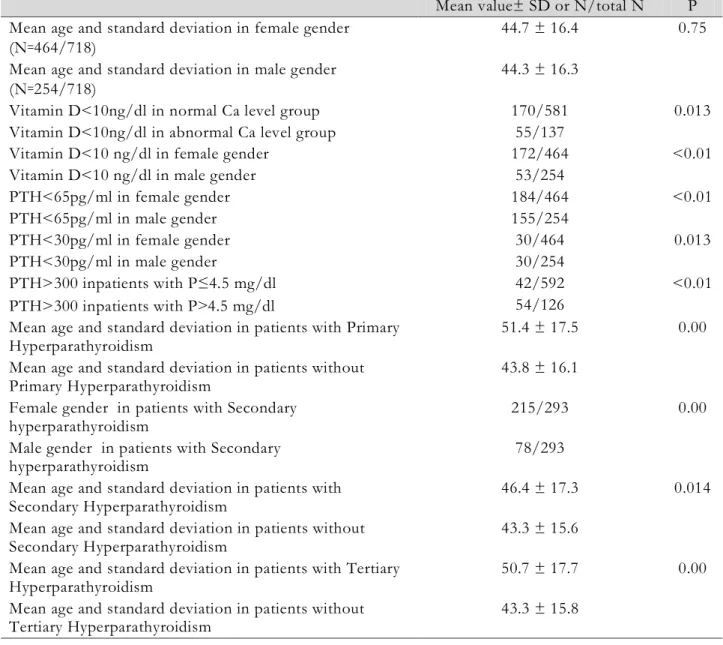
Table 1. Results of descriptive statistics of the working group data
N Minimum Maximum Mean Std. Deviation
Age 718 16 96 44,60 16,432 25OH vitamin D 718 0.85 240.15 23,2319 25,67831 PTH 718 0.4 2979.9 173,102 312,2697 Ca 718 4.65 18,78 9,1965 ,97918 P 718 1.09 11,90 3,7733 1,08984 Mg 382 1.05 4,37 2,1198 ,39448 Spot Urine Ca 292 0.1 130,5 12,703 13,7423
Spot Urine creatinine 168 2,23 331,06 113,4605 70,27936 Fractionated Ca excretion in spot urine 168 0.0014 2,9923 ,182698 ,3561453 Serum calcium and phosphor product
levels 718 8,5238 112,9310 34,573824 10,3472052
Table 2. Results of working group
Mean value± SD or N/total N P Mean age and standard deviation in female gender
(N꞊464/718)
44.7 ± 16.4 0.75 Mean age and standard deviation in male gender
(N꞊254/718) 44.3 ± 16.3
Vitamin D<10ng/dl in normal Ca level group 170/581 0.013 Vitamin D<10ng/dl in abnormal Ca level group 55/137
Vitamin D<10 ng/dl in female gender 172/464 <0.01
Vitamin D<10 ng/dl in male gender 53/254
PTH<65pg/ml in female gender 184/464 <0.01 PTH<65pg/ml in male gender 155/254 PTH<30pg/ml in female gender 30/464 0.013 PTH<30pg/ml in male gender 30/254 PTH>300 inpatients with P≤4.5 mg/dl 42/592 <0.01 PTH>300 inpatients with P˃4.5 mg/dl 54/126 Mean age and standard deviation in patients with Primary
Hyperparathyroidism 51.4 ± 17.5 0.00
Mean age and standard deviation in patients without
Primary Hyperparathyroidism 43.8 ± 16.1
Female gender in patients with Secondary
hyperparathyroidism 215/293 0.00
Male gender in patients with Secondary
hyperparathyroidism 78/293
Mean age and standard deviation in patients with
Secondary Hyperparathyroidism 46.4 ± 17.3 0.014
Mean age and standard deviation in patients without
Secondary Hyperparathyroidism 43.3 ± 15.6
Mean age and standard deviation in patients with Tertiary
Hyperparathyroidism 50.7 ± 17.7 0.00
Mean age and standard deviation in patients without
Fig.1. Pearson correlation coefficient (r), p value (p), and proportional number of patients (pt) between calcium
and PTH in the patient group below each selected cut-off starting from calcium 6
female and 8 were male and there was no significant difference when compared with the general group (p꞊0.68). No significant difference was found for age (HP 46.1±16.4, nonHP 44.5±17.4; p=0.63).
Other results of our study;
1- Ca showed a negative correlation with PTH as it decreased from 8.3 mg/dl and a positive correlation as it increased from 9.2 mg/dl. The strongest negative correlation was at 7.1-7.3 mg/dl and the strongest positive correlation was at 9.5 mg/dl. (Figure 1)
2- In patients with severe hypovitaminosis D (<10 ng/ml),; 8% (n: 18/225) hypophosphatemia (P<2.5 mg/dl), 16% hyperphosphatemia (n꞊36), 18.2% hypocalcemia (n= 41/225), 6.2% hypercalcemia (n꞊14) were detected.
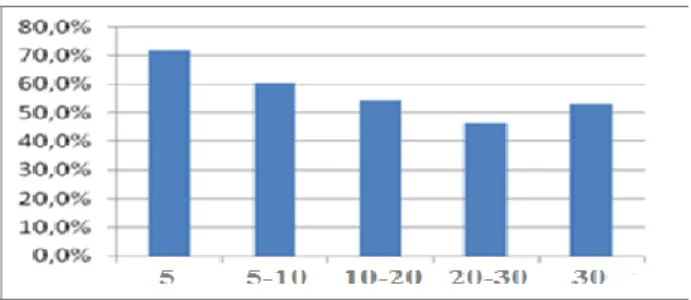
3- The hypocalcemia rate was 30% and the hyperparathyroidism rate was 71% when Vitamin D was <5 ng/ml (Figure 2,3). The deepest hypophosphatemia (1.09 mg/dl) was observed at this level.
4- While vitamin D was <10 ng/ml, we found that PTH was higher than 30 pg/ml, the effective limit value for urinary Ca and urine creatinine was 10 ng/ml.
5- The vitamin D threshold value of PTH was approximately 13 ng/ml.
6- General population analysis showed that PTH and Mg increased significantly as P increased. 7- P has increased as calcium decreased from
<7-7.49 mg/dl. It was found that P decreased as calcium levels increased from 10.5 mg/dl in female and from 9.5 mg/dl in male.
8- P was high in PTH <20 pg/ml, stable in 20-300 pg/ml and increased again from 20-300 pg/ml. 9- Mg was found to be the lowest at PTH <20 pg/ml, was stable between 20-120 pg/ml and started to rise again above 120 pg/ml.
10- Mg did not have a significant effect on PTH when the limit was taken as 1.8 mg/dl, but it was positively related with Ca, PTH and CaxP from 2 mg/dl.
11- As Ca decreased below 8 mg / dl Mg decreased as Ca increased above 10 mg/dl, Mg has been observed to increase.
12- The lowest value of fractional Ca excretion was found to be Ca <7 mg/dl and the highest value was> 10.5 mg/dl.
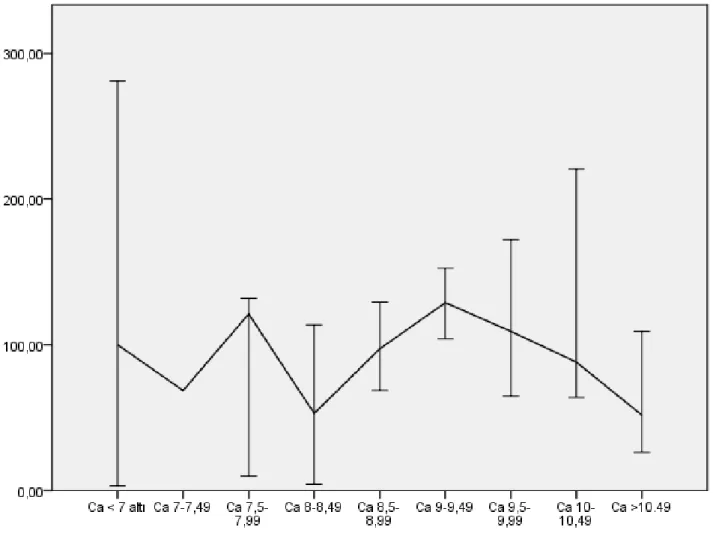
13- Urinary creatinine excretion was found to decrease at the levels of Ca> 10.49 mg/dl, 8-8.49 mg/dl and 7-7.49 mg/dl (Figure 4).
14- There was significant correlation between age and PTH (r=0.1), P and PTH (r=0.189), Mg and PTH (r=0.235), spot urine creatinine and PTH (r=-0.162), CaxP and PTH (r=0.176), spot urinary creatinine and age (r=-0.234).
Discussion
Two hormones that provide homeastasis of calcium, phosphorus and magnesium are PTH and
Fig. 2. Hyperparathyroidism according to 25 OH
vitamin D levels
vitamin D. Blood calcium is very tightly controlled in a narrow range from 8.5 to 10.5 mg/dl. We have detected the negative correlation with PTH as Ca level decreased lower than 8.3 mg/dl and the positive correlation as the level increased more than 9.2 mg/dl. The strongest negative correlation was in 7.1-7.3 mg/dl and the strongest positive correlation was in 9.5 mg/dl (Figure 1).
Serum calcium measurements are reported to be high in approximately 1% of the general population (1). In our study, this rate was 5.6%. The fact that our study group consist of patients may explain the highness. More than 80% of hypercalcemia is caused by malignancy and hyperparathyroidism (2). We found 10.4% primary hyperparathyroidism, 17.5% tertiary hyperparathyroidism due to renal failure and 1.25% hypercalcemia with normal PTH levels suggesting malignancy.
The prevalence of hypocalcemia was found between 15% and 88% in various studies (3.4). The prevalence of hypoparathyroidism is also reported to be 0.5-6.6% (5). We found 13.5% hypocalcemia and 3.7% hypoparathyroidism. We also observed that as age increases, Ca goes beyond normal limits.
Vitamin D deficiency is a global health problem in the community and its prevalence is reported as 20%-100% (6,7,8). Thomas et al. has found the prevalence of hypovitaminosis D as 57%. They found 25 OHD <8 ng / ml in 22% and 8-15 ng / ml in 34% and found an increase in PTH when the level decreased below 15 ng/ml (9). In our study, we found hypovitaminosis D (25OH vitamin D <30 ng / ml, n: 557) in 77.6% of the patients and severe vitamin D deficiency in 39.7% of them (25 OH vitamin D <10 ng / ml, n= 225). In our study, although vitamin D did not have any significant correlation with any parameters, in subgroup analysis lower vitamin D level increased PTH above 30 pg/ml. The effective limit value for urinary Ca and urinary creatinine was 10 ng/ml, for PTH.
Fig. 3. 25 OH Vitamin D levels according to
hypocalcemia rates
Vitamin D levels were found to be lower in female in the 25 OH D<30 ng/mL psychogeriatric research conducted in Canada in 2011. Mg and PTH were found to be higher in females and there was a strong negative relationship between Mg and vitamin D (10). 1,25 (OH) 2D3 does not stimulate intestinal absorption of Mg and there is no correlation between serum 1,25 (OH) 2D3 and net Mg absorption (11). We did not observe such a relationship either. However, we found that Mg is associated with all parameters except vitamin D. In our study, 25OH vitamin D and Mg levels were significantly lower in females and PTH was significantly higher. These results are consistent with the higher prevalence of vitamin D in females.
In a study of 118 patients with asymptomatic hypercalcemia primary hyperparathyroidism in 2011, it was found that spot urinary calcium excretion was 26% lower and PTH was 27% higher when 25 OH vitamin D was <10 ng/ml (12). When we compared the groups with vitamin D levels below and above 10 mg/dl, we did not find any significant difference for PTH and urine Ca/creatinine (p꞊ 0.6, 0.4, respectively). However, when vitamin D was 10-20 ng/ml, we found the urine Ca/creatinine ratio to be lowest, and we found an increase in females after 20 ng/ml and in males after 30 ng/ml.
Increase in PTH is an important indicator of vitamin D deficiency. When serum 25 OH vitamin D levels fall below 10 ng/mL, the case receiving 1200 mg Ca per day was suppressed 20% of PTH compared to the case receiving 800 mg. This effect decreases when 25 OH vitamin D levels exceed 10ng /ml and it disappears at 18ng/ml or more (13). In our study, the mean vitamin D level was determined as 23.2 ng/ml (Table 1) and no significant correlation was found between any parameters. The cut-off value of PTH was found to be approximately 13 ng/ml. Vitamin D level was found to be the highest in PTH between 10-19.9 pg/ml . While vitamin D was <5 ng/ml, the rate of hypocalcemia was 30% and the rate of
Fig. 4. Urinary creatinine excretion according to blood calcium levels
hyperparathyroidism was 71% (Figure 3). The deepest hypophosphatemia (1.09 mg/dl) was observed at this level. Vitamin D deficiency secondary hyperparathyroidism was detected by 40.8%. In severe vitamin D deficiency (<10ng/ml), minimum 1.9% hypercalcemia and 36% normal PTH levels were also noted.
Kidney is the main place where the plasma Mg concentration is regulated. 1,25 (OH)₂ vitamin D₃ reabsorption increases in the thick ascending limb of PTH Henle (14). Phosphate depletion inhibits Mg reabsorption (15). Our study demonstrates the positive association of Mg with PTH and P. In a study of Mayo clinic, 31.5% of hypermagnesemia and 20.2% of hypomagnesemia were found in the hospitalized patients (16). We found Mg levels above 1.8 mg/dl in 17.5% of patients, over 2.6 mg/dl in 10.4% and above 3 mg/dl in 1.5% of patients.
PTH is the main regulator of PO₄ reabsorption and excretion. It is phosphatetic effective. 1.25 (OH)₂ D₃ decreases renal phosphate reabsorption (17). In our study, P, PTH was stable at 20-300 pg/ml and it was determined to increase over 300.
Mg was stable in the 20-120 range and after 120 it has started to increase. The increased factor is thought to be impaired renal function.
Hypophosphatemia occurs in 1-5% of hospitalized patients. Malabsorption, vitamin D deficiency, long-term vomiting, excess glucocorticoid, hyperparathyroidism, the use of antacid, thiazide group diuretic and phosphate binding agent can be counted among the causes of hypophosphatemia (18). In our study, hypophosphosemia was 6.4 percent. Ca was found to correlate significantly with P. We found hyperphosphatemia at a rate of 17.5 percent. Hypophosphatemia was found in 20% of patients with severe hypovitaminosis D. We also found that hypophosphatemia and hypomagnesemia were the highest in the lowest vitamin D values.
Urinary calcium excretion; it reflects dietary calcium intake, calcium absorption, serum calcium and calcium loss from the skeletal system. It was observed that the median difference Ca excretion increased after PTH> 200 pg/ml and decreased after 600 pg/ml. The values of 200-599 pg/ml suggest hyperparathyroidism and 600 pg/ml and
above suggest chronic renal failure. Urinary creatinine evaluation suggests that the fact that calcium is out of the normal affects the renal function negatively. (Figure 4)
As a result, Mg has a significant relation with almost all parameters. 25OH vitamin D has not been associated with any parameters and we have determined the threshold values in which parameters interact with each other.
References
1. Hancı V, Özbilgin Ş. Kalsiyum Dengesi Bozuklukları: Hipokalsemi-Hiperkalsemi; Yoğun Bakım Dergisi 2018; 12: 43-58.
2. Moe SM. Disorders involving calcium, phosphorus, and magnesium. Prim Care 2008; 35: 215-237.
3. Zaloga GP. Hypocalcemia in critically ill patients. Crit Care Med 1992; 20: 251-262.
4. Zivin JR, Gooley T, Zager RA, Ryan MJ. Hypocalcemia: A pervasive metabolic abnormality in the critically ill. Am J Kidney Dis 2001; 37: 689-698.
5. Carine GhassanRicha, Ali Ihsan Issa, Akram Salim Echtay and Mohamad Souheil El Rawas. CaseReport Idiopathic Hypoparathyroidism and Severe Hypocalcemia in Pregnancy. Hindawi Case Reports in Endocrinology Volume 2018, Article
ID 8316017, 4 pages
https://doi.org/10.1155/2018/8316017
6. Gois PHF, Ferreira D, Olenski S, Seguro A.C. Vitamin D and Infectious Diseases: Simple Bystander or Contributing Factor? Nutrients 2017; 9: 651.
7. Mithal A, Wahl DA, Bonjour JP, Burckhardt P, et al. Global vitamin D status and determinants of hypovitaminosis D. Osteoporos. Int 2009; 20: 1807-1820.
8. Holick MF. High prevalence of vitamin D inadequacy and implications for health. Mayo Clin Proc 2006; 81: 353-373.
9. Thomas MK, Lloyd-Jones DM, Thadhani RI, et al. Hypovitaminosis D in medical inpatients. N Eng J Med 1998; 338: 773.
10. Jennifer Ford, Ana Hategan, James A. Bourgeois, Daniel K. Tisi. Hypovitaminosis D: A Contributor to Psychiatric Disorders in Elderly? Canadian geriatric journal 2012; 15: No3.
11. Murray J. Favus, David A. Bushinsky, and Jacob Lemann Jr. Regulation of Calcium, Magnesium, andPhosphate Metabolism. Chapter 13. 2006 American Society for Bone and Mineral Research: 80.
12. Channa N Jayasena, Mohammad Mahmud, Fausto Palazzo, Mandy Donaldson, Karim Meeran, Waljit S Dhillo. Utility of the urine calcium-to-creatinine ratio to diagnose primary
hyperparathyroidism in asymptomatic
hypercalcaemic patients with vitamin D deficiency. Ann Clin Biochem March 2011; 48: 126-129.
13. Steingrimsdottir L, Gunnarsson O, Indridason OS, Franzson L, Sigurdsson G. Relationship between serum parathyroid hormone levels, vitamin D suffi ciency and calcium intake. JAMA 2005; 294: 2336-2341.
14. Elena Pérez González, F. Santos Rodríguez, E.
Coto García. Magnesium homeostasis.
Etiopathogeny, clinical diagnosis and treatment of hypomagnesaemia. A case study. Nefrologia 2009; 29: 518-524.
15. Quamme GA. Renal magnesium handling: new insights in understanding old problems. Kidney Int 1997; 52: 1180.
16. Abdullah MAA , Sandawana WM, Falhammar H; Magnesium and Human Health: Perspectives and Research Directions: Hindawi International Journal of Endocrinology; Volume 2018, Article
ID 9041694, 17 pages
https://doi.org/10.1155/2018/9041694
17. Murray J. Favus, David A. Bushinsky, and Jacob Lemann Jr. Regulation of Calcium, Magnesium, andPhosphate Metabolism. Chapter 13. 2006 American Society for Bone and Mineral Research: 81, 82.
18. Kahvecioğlu S. Hipofosfatemi Tanı ve Tedavisi: Turkiye Klinikleri J Nephrol-Special Topics 2014; 7: 56-59.