the atmosphere of Kazakhstan using satellite data
Zhuldyz Darynova,
aAigerim Maksot,
bLyazzat Kulmukanova,
bMilad Malekipirbazari,
cHamed Sharifi,
aMehdi Amouei Torkmahalleh,
b,d,*
and Tracey Holloway
eaRizgard Payesh Asman LLP (Sky Aerosol Monitoring LLP), Department of Air Pollution Modelling, Tehran, Iran
bNazarbayev University, School of Engineering, Department of Chemical Engineering, Chemical and Aerosol Research Team, Astana, Kazakhstan
cBilkent University, Department of Industrial Engineering, Ankara, Turkey
dNazarbayev University, Environment and Resource Efficiency Cluster, Astana, Kazakhstan eUniversity of Wisconsin–Madison, Nelson Institute for Environmental Studies and the Department of Atmospheric and Oceanic Sciences, Madison, Wisconsin, United States
Abstract.
Tropospheric NO2 concentrations obtained from the measurements of the Ozone Monitoring Instrument on board the NASA Aura satellite from 2005 to 2016 were studied to identify major NO2 emission hot spots, trends, and seasonal variations over Kazakhstan. Emission hot spots are observed over the locations of thermal power plants (Ekibastuz) and major urban and industrial regions (Almaty and Shymkent), as well as the capital city (Astana). Some decreasing trends have been observed for NO2 over Ekibastuz, whereas the regions of Almaty and Shymkent showed increasing trends due to industrial growth. The seasonal pattern of the NO2 concentration shows a difference between three industrial cities of Almaty, Shymkent, and Ekibastuz versus the rest of Kazakhstan. In these three cities, a NO2 maximum is found during wintertime, which we attribute to seasonality of emissions associated with elec-tricity production and the longer chemical lifetime of NO2in winter. In contrast, in Astana and the rest of Kazakhstan, the NO2concentration reaches a maximum in the summer.© 2018 Societyof Photo-Optical Instrumentation Engineers (SPIE) [DOI:10.1117/1.JRS.12.042610]
Keywords:NO2; NASA Aura Satellite; Kazakhstan; Almaty; Astana; power plants.
Paper 180367SS received May 28, 2018; accepted for publication Sep. 28, 2018; published on-line Oct. 25, 2018.
1 Introduction
Nitrogen dioxide (NO2) and its precursor nitric acid (NO) together are known as nitrogen oxides (NOx), which play a vital role in the tropospheric chemistry. NOxis a precursor of tropospheric ozone and nitrate particulate matter, both of which affect air quality and climate.1NO
x concen-trations in the troposphere are highly variable in both space and time, reflecting its short chemical lifetime in the atmosphere and its nonuniform distribution.2The lifetime of NO2was reported to be∼6 h in summer, ∼6 to 12 h in spring and fall, and 12 20 h in winter, due to the variability in the photolysis rate and water vapor content in the atmosphere.3
Emissions of NOxcome from both anthropogenic and natural sources. Elevated temperatures associated with combustion combine ambient N2and O2to form NO, which oxidizes to NO2. Major contributors to global NOx emissions include industrial activities, electricity generation, transportation, and prescribed burnings.4Natural phenomena, such as lightning, wildfires, and
soil microbial activities, contribute to NOx emissions.5
This study focuses on NOxemissions in Kazakhstan, which is the ninth largest country in the world at 2.72 million km2, one of the top coal and oil producing countries in the world,6while
*Address all correspondence to: Mehdi Amouei Torkmahalleh, E-mail:[email protected]
maintaining one of the lowest population densities of any country at 7 per km2.7Over 50% of
the Kazakhstan’s energy is supplied by coal, and the oil sector is the largest determinant of the country’s economic growth (ibid). Between 2002 and 2016, the gross domestic product of Kazakhstan has increased sixfold. In 2014, the highest per capita household coal consumption occurred in Poland (165 kgoe/cap), followed by Kazakhstan (157 kgoe/cap), and Mongolia (104 kgoe/cap).8,9Kazakhstan experiences unique metrological conditions where the tempera-ture in winter time may go down to−40°C in the north. Characterizing NOxemissions in this large, energy-intense country bears relevance to air quality and climate impacts for the region, country, and world. The World Bank found that the air quality monitoring network in Kazakhstan may experience unrepresentative sampling because the number of monitoring sites are low, and the selection of monitored pollutants does not comply with recognized priority pollutants.10To address this data need, we apply satellite retrievals of NO2to assess NOxtrends and spatial variability in Kazakhstan.
Long-term observations of satellite NO2 columns can constrain NOx emission inventories and significantly reduce model uncertainties in simulations studies.11Prior studies using satellite
data indicate that NO2levels decreased sharply over the last decade in many countries, such as the United States, Japan, Australia, New Zealand, and those in Western Europe.12–15 This decrease resulted from a combination of the implementation of emission control devices on ther-mal power plants, the shuttering of inefficient plants, and stricter vehicle emission standards.16 Liu et al.17found that a high NOx concentration does not necessarily correspond to a long life-time, and the correlation between NOxlifetime and NO2tropospheric vertical column density is rather low (R2 ¼ 0.22), probably due to the complex NO
xchemistry, which is also affected by meteorological and chemical variability, such as variations in UV flux, water vapor, and VOC levels.18
Currently, only a few studies regarding the atmosphere of Central Asia are available. In par-ticular, no studies were found in the literature that investigates NO2concentrations variability in Kazakhstan. The objective of this study was to examine the temporal evolution of tropospheric NO2 in four major cities of Kazakhstan including Astana, Shymkent, Almaty, and Ekibastuz from 2005 to 2016 using the data from ozone monitoring instrument (OMI) launched on the NASA Aura satellite in July 2004.
2 OMI Tropospheric NO
2Columns
Our study uses data from OMI to assess air quality patterns and trends in Kazakhstan. OMI is a nadir-viewing wide-field imaging spectrometer data on the board of NASA Aura satellite. Its ground resolution is 13 km× 25 km, spectral and spatial detection is 780 × 576 pixels, respectively, and can detect UV with wavelength 350 to 500 nm. The instrument observes Earth’s backscattered radiation in the ultraviolet and a visible range of 350 to 500 nm with a wide-telescope feeding two imaging grating spectrometers. Aura was launched on July 14, 2004, into a Sun-synchronous polar orbit at ∼705-km altitude with a local equator crossing time of 13:45 in the ascending node.3,19
The hyperspectral capabilities of the instrument can improve the accuracy and precision of the total ozone concentration. Also, it allows for accurate radiometric and wavelength selfcali-bration over the long term. The Dutch OMI NO2 (DOMINO) retrieval algorithm consists of three steps. First, the slant columns of NO2 are obtained from the OMI reflectance spectra in the 405- to 465-nm window using the DOAS technique.20 Second, the stratospheric and tropospheric contributions to the OMI NO2 slant columns are separated by assimilating the slant columns of a global chemistry and transport model.21,22 We used monthly average
level-3 product. Finally, tropospheric slant column is converted to a vertical column with the tropospheric air mass factor.
The tropospheric NO2column retrievals used are from the version-2 DOMINO data product for OMI22obtained through the TEMIS25 website. The ground pixel size of the OMI retrievals is 13 to 24 km with a daily global coverage. This study employs the monthly average level 3 OMI NO2 product available at 0.25 deg× 0.25 deg because these data are gridded files on a fixed grid. One grid cell (0.25 deg× 0.25 deg) falls in each city. Since cities are not perfectly square
shaped, at the edges there might be some uncertainties. In the case of Almaty, which is sur-rounded by mountains, the grid cell did not cover mountains.
3 Study Area
We focus on the four major cities of Kazakhstan including Astana, Shymkent, Almaty, and Ekibastuz from 2005 to 2016. These four cities are among most populated and largest urban areas where potential NO2 emissions exist.
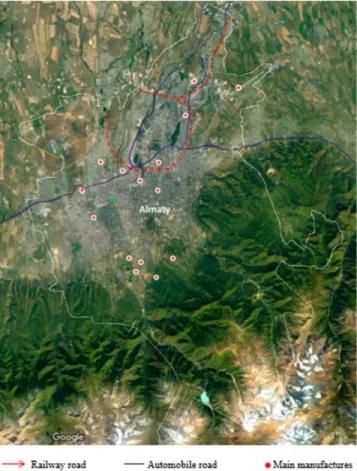
Almaty (43.22°N, 76.85°E) is located in the valley of big and small Almatinka rivers at the foot of Trans-Ili Alatau mountains (Fig.1). The city is surrounded by mountains and hills, limit-ing horizontal movement of air. Wind generally blows southward durlimit-ing the day, brlimit-inglimit-ing cold and polluted air from the North and northward at night.23 The population of Almaty has
increased from 2005 to 2016 by 42% (Fig.2).24 Sources of NO
2 in Almaty include thermal power plants, motor vehicles, boilers from military garrisons of regional operational units of the Ministry of Defense, boiler companies, and building material manufacturing. Emissions from transportation account for ∼80% of NOx emissions in Almaty.23 As of 2010, over 500,000 vehicles were registered in Almaty, of which 54.6% were produced from 1996 to 2003, 20.9% from 2003 to 2008, and only 2.4% recently manufactured, suggesting that engines do not comply with modern emission standards.23
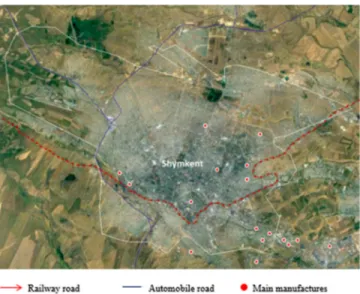
Shymkent (42.34°N, 69.69°E) is an industrial city with the population of 902,000 by 2016. The city population has increased from 2005 to 2016 by 68% (Fig.3).25The main sources of NO2 come from stationary and mobile sources (Fig.4). The stationary sources include lead, petrochemical, chemical, thermal power plants, and uranium mining enterprises. Mobile sources have been reported to be the main source of formaldehyde, nitrogen dioxide, and carbon monoxide.26 The estimated total emissions of harmful substances in the atmosphere in the
Fig. 1 Almaty Google map. Almaty is located in the valley of big and small Almatinka rivers at the foot of Trans-Ili Alatau mountains.
city of Shymkent show that the ratio of hazardous substances emitted by stationary sources to harmful substances released by mobile sources average 1 to 4.5 annually.27
Ekibastuz (51.73°N, 75.32°E) is located in the Pavlodar region of the Republic of Kazakhstan (Fig. 5). An increase in population was observed for Ekibastuz from 2006 to 2016 by 8.6% (Fig. 6). One of the largest coal deposits in Kazakhstan is in Ekibastuz, where high-ash coal is extracted by an open-pit method, and fuels two of the largest power plants in the country.
Fig. 3 The city population of Shymkent has increased from 2005 to 2016 by 68%.25
Fig. 4 Shymkent Google map. The main sources of NO2 over Shymkent come from stationary
and mobile sources.
While 72% of electricity in Kazakhstan is produced by thermal power plants, Ekibastuz State District Power Plant-1 (SDPP-1) contributes to 12% of the demand.28,29High-ash coals with
inadequate ash collectors at local plants lead to significant emissions of harmful substances, such as NOxand SO2into the atmosphere. Since Ekibastuz uses brown coal with a high content of minerals (more than 30%), pollutant emissions from coal thermal power plants extend to
Fig. 5 Ekibastuz Google map. Ekibastuz is located in the Pavlodar region of the Republic of Kazakhstan.
Fig. 6 An increase in population was observed for Ekibastuz from 2006 to 2016 by 8.6%.25
the entire northeast of Kazakhstan, Siberia, and Mongolia.30Minor industrial activities account for∼20% of the emissions.31SO2 and NOx were detected at a distance of 119 km.32
In December 1997, Kazakhstan’s capital city changed from Almaty to Astana (51.16°N, 71.47°E). As a result industrial outputs and the gross regional products have increased by 11 and 90 times, respectively. While the trend of migration to Almaty did not decrease from 2005 to 2016, the population migrating to the new capital, Astana, increased. Figure 7
shows the population increase by 65% from 2005 to 2016 in Astana.24 This shift in capital, construction, and transport by roads and railways increased dramatically, introducing increased sources of dust and air pollutions. To offset air pollution, the government organized projects such as the construction of a large (190 ha) forest park. In addition, the area of landscaping in Astana increased from 67.9 ha in 1997 to 1061.5 ha in 2009.33 Figure8 shows the current map of Astana.
4 Results and Discussion
Annual averages of OMI columns over Kazakhstan from 2005 to 2016 show the high NO2 ver-tical tropospheric columns over the megacities (Almaty, Shymkent), as well as the towns with big thermal power plant (Ekibastuz) (Fig.9). The annually averaged NO2vertical columns over Kazakhstan are low,∼0.8 × 10¹⁵ molecules∕cm2. However, there exists“hotspots” in the coun-try, such as the southern cities of Almaty, Shymkent, and the northern city Ekibastuz (Fig.9). The city of Almaty showed the most striking changes in NO2 density from 2005 to 2016 (k ¼ 0.0236). As shown in Fig. 10, the vertical columns peak annual average increased from 4.8× 10¹⁵ molecules∕cm2 to 6.4× 10¹⁵ molecules∕cm2. Another striking increase (k ¼ 0.0151) came from another major city in the south, Shymkent (Fig.10), where the vertical columns increased from 1.4 to 3.1× 10¹⁵ molecules∕cm2.
Overall increase in NO2concentrations between 2005 and 2016 over Almaty and Shymkent cities could be attributed to the rise in the population (Figs.2and 3, respectively) and vehicle count. Another reason for increased NO2 levels can be credited to the growing number of chemical factories and power plants.
In 2013, the government implemented two big projects: emission trading system (ETS) and Euro-4 standard for cars.34,35When observing total NO2columns, the ETS and ICAP potentially contributed to the decrease in NO2over Almaty (20%) and Ekibastuz (17%) from 2012 to 2014
Fig. 8 Astana Google Map. This shift in capital, construction, and transport by roads and railways increased dramatically, introducing increased sources of dust and air pollutions.
(Fig. 10). When the government transferred the Combined Heat and Power-2 (CHP-2) to the Almaty city territory in 2015, the NO2 is shown to slightly increase in this area (14%).36 After 2015, the optimization of technical processes power stations and employing natural gas-driven buses stabilized NO2level in hot spot cities, such as Almaty (19% change of NO2 over the Almaty).36
In comparing the urban area of Almaty with the rural area of Esik (43.35°N, 77.46°E), satellite data show that NO2 density in the rural area of Esik is four times lower than Almaty city for the period of 2005 to 2016.
In the capital city of Astana (formerly Akmola), located in the northern part of the country, shows an 11% decrease from 2005 to 2016 (Fig. 10). Despite Astana’s relatively high popu-lation, the observed average NO2 column during 2005 to 2016 is 1.2× 10¹⁵ molecules∕cm2, which is as low as rural areas elsewhere in the country (Table1).
Figure 11 shows the monthly NO2 tropospheric column over Kazakhstan in year 2014. During winter time there are some gray patterns, specifically in the north part, which shows missing data due to the extended snow cover. Therefore, in this study the evaluation of NO2 concentration over northern part of country during winter is not reliable. Another important point from Fig. 11 is that NO2 level changes over the whole country and hotspots during the year. The overall pattern over country changes from blue (low NO2) to light blue (high
Fig. 10 NO2 column trend over Kazakhstan and its cities between 2005 and 2016.
NO2) as season changes from winter to summer, while pattern over hot spots changes from yellow (very high NO2) to light blue (high NO2) during this period. Figure 11 also shares valuable information regarding the impact of majorly polluted neighbor countries including China and Russia on NO2 density in Kazakhstan. It is understood from Fig. 11 that from October to February, Kazakhstan is influenced by the border regions of China and Russia.
Fig. 11 Illustration of the monthly NO2 tropospheric column over Kazakhstan in year 2014. December shows missing data due to extended snow coverage.
Table 1 The trend line equations for NO2 variations from 2005 to 2016 for different cities of
Kazakhstan.
Cities Almaty Esik Shymkent Ekibastuz Astana Kazakhstan
Trend line
Figure 12 shows the seasonal behavior of NO2 retrievals in cities, as well as the country average. The maximum NO2 peak for Almaty, Shymkent, and Ekibastuz occurs during wintertime (at 9.85× 10¹⁵ molecules∕cm2, 5.30× 10¹⁵ molecules∕cm2, and 4.25× 10¹⁵ molecules∕cm2, respectively), which is consistent with Ref. 22. Two factors account for this wintertime peak in Kazakhstan: the heavier use of combustion power plants for heating and the longer lifetime of NO2 in the atmosphere. In the summertime, urban to rural NO2 density may vary by a factor of 4. This ratio is amplified in the winter, with urban areas showing 20× more NO2 density than rural areas (Fig. 12). Rural regions are typically at the national average of NO2 concentration, as the majority of Kazakhstan’s area is rural. As seen in Fig.12, the rural areas stay relatively stagnant in their NO2 concentrations, with the maximum NO2 occurring in the summertime, though the difference between maximum and minimum value is low (0.5× 10¹⁵ molecules∕cm2).
5 Conclusion and Future Work
In this study, Kazakhstan is suggested as a case study for applying satellite data to assess air quality and energy sectors. As a country with rapid industrial and social growth, and without an established air quality monitoring network, the value of satellite data to assess emissions is particularly high.
This study analyzed retrievals of the vertical column density of NO2 from the OMI over atmosphere of Kazakhstan between 2005 and 2016. Observations are coincided with other papers: (1) the dominant NO2source regions correspond primarily to areas with high population and large industry; (2) hot spots are strongly correlated with electricity usage and fuel sources; and (3) in northern hemisphere hot spots peak NO2 is much higher during winter. OMI obser-vations have shown that hotspot cities in Kazakhstan are industrial megacities with high pop-ulation (Almaty, Shymkent) and a small town with thermal power plants providing 72% of electricity in Kazakhstan (Ekibastuz). The rest of the country has approximately the same amount of NO2 concentration. From the rural sample region of Esik, the NO2 levels stayed much lower year round, having concentrations that are 1∕4 (in summer) to 1∕20 (in winter) of its urban neighbor, Almaty. Significant increase in NO2 over 2005 to 2016 was recorded in the growing cities of Almaty and Shymkent, while NO2 columns in the rest of the country fluctuated insignificantly. From analyzing the seasonal behavior of NO2 over Kazakhstan, we show a wintertime peak for hotspot cities due to the increased need for heat and increased life-time of NO2. In comparing the annual columns in 2012 and 2014, it was possible to estimate that the implementation of the Euro-4 standard and the ETS reduced NO2up to 40% in Almaty, the city with the highest number of automobiles in country. Discrepancies for other two cities can be used to identify specific areas needing further studies.
Fig. 12 Average seasonal variation of NO2column over Almaty, Shymkent, Ekibastoz, Astana,
This work could be expanded by a comparison with ground-based monitoring data, model estimates of column NO2, and/or other satellite data products. As next-generation NO2 data become available—include the Netherlands Space Office and European Space Agency Tropomi instrument launched in 2017, and the upcoming geostationary Sentinel 4 geostationary satellite will offer new sources of NO2 over Kazakhstan and the region to improve our char-acterization of energy and emissions in this rapidly changing country.
The transboundary influence from other countries can be investigated in the future using modeling tools, such as GEOS-Chem. Particularly, biomass burning in China (East of Kazakhstan) during the winter time can introduce NO2 to Kazakhstan as shown in Fig. 11, although the global wind in Kazakhstan is westerly wind. We will address this point as our future work using GEOS-Chem study.
Acknowledgments
The authors of this study would like to acknowledge Nazarbayev University for providing the Faculty Small Grant (No: 090118FD5315) to the authors of this paper (MAT, LK, ZD, and AM) to conduct this study. Participation of TH was supported by the NASA Health and Air Quality Applied Sciences Team. We appreciate the helpful comments of Anastasia Montgomery and Mary Spraggs of the Holloway Group at the University of Wisconsin—Madison. We acknowl-edge the free use of tropospheric NO2column data from the OMI sensor from www.temis.nl.
References
1. C. Wild et al., “Climate change impedes scleractinian corals as primary reef ecosystem engineers,”Mar. Freshwater Res. 62, 205–215 (2011).
2. K. Miyazaki et al., “Decadal changes in global surface NOx emissions from multi-constituent satellite data assimilation,”Atmos. Chem. Phys. 17, 807–837 (2017).
3. L. N. Lamsal et al., “Ground-level nitrogen dioxide concentrations inferred from the satellite-borne Ozone Monitoring Instrument,” J. Geophys. Res. Atmos. 113, D16308 (2008).
4. F. Federico and M. Amman, “Contributions to cities’ ambient particulate matter (PM): a systematic review of local source contributions at global level,”Atmos. Environ. 120, 475–483 (2015).
5. J.-F. Lamarque et al.,“Assessing future nitrogen deposition and carbon cycle feedback using a multimodel approach: analysis of nitrogen deposition,” J. Geophys. Res. Atmos. 110, D19303 (2005)
6. J. Knebelmann, Natural Resources’ Impact on Government Revenues, United Nations University, Econstor, Helsinki (2017).
7. Worldbank, “Population density. CC BY- 4.0,” Food and Agriculture Organization and World Bank Population Estimates, 2018, http://www.worldbank.org/en/country/ kazakhstan/overview.
8. IEA, “Balances for 2014,” 2016, https://www.iea.org/statistics/statisticssearch/report/ ?country=WORLD&product=balances&year=2014(28 January 2017).
9. A. Kerimray et al., “Coal use for residential heating: patterns, health implications and lessons learned,”Energy Sustainable Dev. 40, 19–30 (2017).
10. JERP and WB, “Towards cleaner industry and improved air quality monitoring in Kazakhstan,” 2013, http://documents.worldbank.org/curated/en/132151468047791898/ Towards-cleaner-industry-and-improved-air-quality-monitoring-in-Kazakhstan.
11. S. Wang et al.,“Satellite measurements oversee China’s sulfur dioxide emission reductions from coal-fired power plants,”Environ. Res. Lett.10, 114015 (2015).
12. S.-W. Kim et al.,“Satelliteobserved U.S. power plant NOx emission reductions and their impact on air quality,”Geophys. Res. Lett.33, L22812 (2006).
13. S. McFarlane, Air Quality Regulations and Odour Management in Australia and New Zealand, pp. 78, Clean Air Society of Australia and New Zealand, Olinda, Victoria (2009).
14. P. Castellanos and F. Boersma, “Reductions in nitrogen oxides over Europe driven by environmental policy and economic recession,”Sci. Rep.2, 265 (2012).
15. B. N. Duncan et al., “The observed response of ozone monitoring instrument (OMI) NO2columns to NOxemission controls on power plants in the United States: 2005-2011,”
Atmos. Environ.81, 102–111 (2013).
16. B. N. Duncan et al.,“A space-based, high-resolution view of notable changes in urban NOx pollution around the world (2005–2014),”J. Geophys. Res. Atmos.121, 976–996 (2016) 17. F. Liu et al.,“NOxlifetimes and emissions of cities and power plants in polluted background
estimated by satellite observations,”Atmos. Chem. Phys. 16, 5283–5298 (2016).
18. R. A. Harley et al.,“Changes in motor vehicle emissions on diurnal to decadal time scales and effects on atmospheric composition,”Environ. Sci. Technol.39, 5356–5362 (2005). 19. P. F. Levelt et al.,“Science objectives of the ozone monitoring instrument,”IEEE Trans.
Geosci. Remote Sens.44, 1199–1208 (2006).
20. U. Platt and J. Stutz, Differential Optical Absorption Spectroscopy, pp. 135–174, Springer, Berlin Heidelberg (2008).
21. F. Dentener et al.,“Trends and inter-annual variability of methane emissions derived from 1979-1993 global CTM simulations,”Atmos. Chem. Phys.3, 73–88 (2003).
22. K. F. Boersma et al., “An improved tropospheric NO2 column retrieval algorithm for the ozone monitoring instrument,”Atmos. Meas. Tech.4, 1905–1928 (2011).
23. L. Carlsen et al.,“Assessment of the air quality of Almaty. Focusing on the traffic compo-nent,” Int. J. Biol. Chem. 5(1), 49–69 (2013).
24. Institute of Demography of the National Research University, “Higher School of Economics,” “Population at the beginning of the year, regions of the Republic of Kazakhstan,” Demoscope Weekly, 2016, http://www.demoscope.ru/weekly/ssp/kaz_pop_ 2003.php.
25. Statistics Department for South Kazakhstan Region,“Population of Shymkent,” Ministry of National Economy of the Republic of Kazakhstan Committee on Statistics, 2016,http://www .ontustik.stat.kz/rus/admin/obl_v_cifr/doc/Din_Dimograf_r.doc.
26. S. H. Shapalov,“Analysis of environmental problems of the South Kazakhstan and the City of Shymkent,” 2017, http://group-global.org/ru/publication/57240-analiz-ekologicheskih-problem-yuzhno-kazahstanskoy-oblasti-i-goroda-shymkent(17 April 2017).
27. A. G. Bogdanovich et al.,“Analysis of the state of protection environment. Identification of socio-economic factors and conditions affecting air pollution,” (2010).
28. Bourabai Research Institution,“Electric power industry of Kazakhstan,” 2016,http://www .bourabai.kz/toe/kazenergy.html (18 May 2017).
29. Vnesheconombank, “About the project of construction of the third energy block of Ekibastuzskaya gres-2,” 2010, http://www.veb.ru/press/news/index.php?id_19=6552& filter_year_19=2010&filter_month_19=7&from_19=2 (19 May 2017).
30. Z. H. T. Mukayev,“Training and methodology complex,” Ministry of Education and Science of the Republic of Kazakhstan, Shakarim State University, Semey, 2015, http:// grazit.ru/programma-disciplini-vvedenie-v-socialeno-ekonomicheskuyu-geog.html?page=4
(30 March 2017).
31. M. Brody and A. Golub,“Improving air quality and health in Kazakhstan: monitoring, risk assessment and management,” Вестник Казахского Национального медицинского университета (Республиканское государственное предприятие на праве хозяйственного ведения {\guillemotleft}КазНМУ им. СДАсфендиярова {\guillemotright} Министерства здравоохранения и социального развития Республики Казахстан) (2014).
32. S. W. Kim et al., “Evaluations of NOx and highly reactive VOC emission inventories in Texas and their implications for ozone plume simulations during the Texas Air Quality Study 2006,”Atmos. Chem. Phys.11, 11361–11386 (2011).
33. Ecological condition of Astana, http://a-portal.moreprom.ru/news%2Bview%2B332.html
(8 August 2017).
34. International Carbon Action Partnership,“Kazakhstan emissions trading systems,” 2017,
https://icapcarbonaction.com/en/?option=com_etsmap&task=export&format=pdf&layout= list&systems[]=46.
35. Parliament of the Republic of Kazakhstan, “On the approval of the technical regulations on the requirements for emissions of harmful (polluting) substances of vehicles to be issued in circulation on the territory of the Republic of Kazakhstan,” Law of the Republic of Kazakhstan, 2013,http://online.zakon.kz/Document/?doc_id=31330110#pos=0;0(9 March 2017).
36. Almaty City Maslikhat, “Plans for Almaty development,” 2016, http://www.mga.kz/ solutions/maslikhat-programms/662-programma-razvitiya-goroda-almaty-na-2016-2020-gody.html (4 April 2017).
Mehdi Amouei Torkmahallehis an assistant professor in Chemical Engineering Department at Nazarbayev University and a director of the Aerosol and Air Quality Laboratory in the School of Engineering, Nazarbayev University.
Tracey Holloway is a professor in the Nelson Institute for Environmental Studies and the Department of Atmospheric and Oceanic Sciences at the University of Wisconsin-Madison. She leads an air quality research program in the Nelson Institute Center for Sustainability and the Global Environment.