*Corresponding Author Cite this article ([email protected]) ORCID ID 0000 – 0002 – 0960 – 5335
*([email protected]) ORCID ID 0000 – 0002 – 2748 – 0660
Research Article / DOI: 10.26833/ijeg.743661
Yiğit E & Duysak H (2021). Fully optimized multilayer radar absorber design using multi-objective abc algorithm. International Journal of Engineering and Geosciences, 6(3), 136-145
Received: 27/05/2020; Accepted: 22/12/2020 International Journal of Engineering and Geosciences
https://dergipark.org.tr/en/pub/ijeg
e-ISSN 2548-0960
Fully optimized multilayer radar absorber design using multi-objective abc algorithm
Enes Yigit1 , Huseyin Duysak *1
1Karamanoglu Mehmetbey University, Engineering Faculty, Department of Electrical-Electronics Engineering, Karaman, Turkey
Keywords ABSTRACT
Multi-objective optimization Pareto front
Radar absorbing material (RAM)
Triple objective ABC
Main purpose of the design of multi-layer radar absorber (MRA) by means of metaheuristic optimization algorithms is to minimize both the total thickness (TT) of MRA and the maximum reflection coefficients for transverse electric (RTE) & transverse magnetic (RTM) polarizations at any oblique angle of incidence. For this purpose, sequence and thicknesses of layers of the MRA have been optimized by either single-objective approach based on combining all objectives or double-objective approach in which TT is evaluated separately from the reflection coefficients. In this study, triple-objective artificial bee colony (TO-ABC) algorithm integrated with Pareto front technique is proposed for fully optimized MRA design. Thus, both RTE, RTM and TT are simultaneously minimized by optimizing thickness, sequence and number of the layers. To demonstrate the superiority of TO-ABC, 3 types of MRAs operating at the frequency ranges of 2–18 GHz for each angle of incidence from 0⁰ to 60⁰ are optimized and compared with the literature. Furthermore, 4 different real MRAs are also optimized using real materials given in the literature. Thanks to the developed graphical user interface and TO-ABC algorithm, despite the limited number of materials, all possible solutions providing the specified parameters are easily achieved and successful MRA structures are designed.
1. INTRODUCTION
Electromagnetic (EM) stealth technology is an important issue which has increased its popularity in the last quarter century and has many commercial and military applications. The main purpose of this technology is to reduce the EM energy scattered from the target as much as possible and to make the target invisible to the radar receiver. Within this scope, multi-layer radar absorbers (MRA) have become very popular in recent years due to their superior absorption capabilities (Yigit and Duysak, 2019a). To produce the MRA having low thickness and low reflection properties, the sequence and thickness of the materials used in the layers should be optimally determined. For this purpose, natural-inspired optimization algorithms such as artificial bee colony (ABC)(Toktas et al., 2018), central force algorithm (CFO) (Asi and Dib, 2010), particle swarm optimization (PSO)(Goudos and Sahalos, 2006a) , genetic algorithm (GA) (Kern and Werner, 2003) and differential evolution (DE) (Goudos, 2009) and also surrogate-based optimization(Toktas et al., 2019) have
been successfully applied to various MRA designs operating at different frequency ranges between 0.2–18 GHz (Asi and Dib, 2010; Goudos, 2009; Goudos and Sahalos, 2006a, 2006b; Jiang et al., 2009; Kern and Werner, 2003; Michielssen et al., 1993; Ranjan et al., 2018; Roy et al., 2016, 2015; Toktas et al., 2019, 2018; Weile et al., 1996; Yigit and Duysak, 2019a). Most of these studies were performed either for normal incidence or for a limited angle of incidence. Broad-band and wide-angle MRAs should be designed for practical implementations of the stealth technologies. However, the design of broad-band and wide-angle MRA with as thin as possible is a challenging problem. In all of the studies given in references (Asi and Dib, 2010; Goudos, 2009; Goudos and Sahalos, 2006a, 2006b; Jiang et al., 2009; Kern and Werner, 2003; Michielssen et al., 1993; Ranjan et al., 2018; Roy et al., 2016, 2015; Toktas et al., 2019, 2018; Weile et al., 1996), where predefined 16 virtual materials were preferred, MRA designs were performed by means of either single objective (Asi and Dib, 2010; Goudos, 2009; Goudos and Sahalos, 2006a; Kern and Werner, 2003; Michielssen et al., 1993; Ranjan
137 et al., 2018; Roy et al., 2016, 2015; Toktas et al., 2018) or multi-objective (MO) approaches (Goudos and Sahalos, 2006b; Jiang et al., 2009; Toktas et al., 2018; Weile et al., 1996). In the MO approach, both thickness and reflection coefficients are optimized simultaneously, while in single objective optimization all objectives are combined in a single objective function by means of weight coefficients (Goudos, 2009). In addition, a new double-stage method has recently been introduced that optimizes the total thicknesses (TT) of layers separately from number & sequence of the layers (NSL) (Yigit and Duysak, 2019a) . Thanks to the double-stage approach, negative effects of sudden changes in layer sequence has been prevented (Yigit and Duysak, 2019a). However, similar to other single or MO approaches (Asi and Dib, 2010; Goudos, 2009; Goudos and Sahalos, 2006a, 2006b; Jiang et al., 2009; Kern and Werner, 2003; Michielssen et al., 1993; Ranjan et al., 2018; Roy et al., 2016, 2015; Toktas et al., 2019, 2018; Weile et al., 1996), in (Yigit and Duysak, 2019a) the reflection coefficients for Transverse Electric (TE) and Transverse Magnetic (TM) polarizations were combined in a single objective function. Satisfactory results can be achieved by combining different objective functions at the beginning of the algorithm, but in some special cases, it is inevitable that MO optimization is required for compromises between objectives. For example, in some cases, it may be desirable to minimize the maximum reflection coefficient by sacrificing TT. In this case, MO optimization approaches are inevitable.
In this study, three different objectives (TT, reflection coefficients for TE and TM polarizations) for fully optimized MRA design are synchronously minimized by means of Pareto-integrated triple objective ABC (TO-ABC) algorithm. In MRA design problem, it is not a reasonable approach to set a minimum or maximum objective for the number of layers (NL). As it can be seen from (Yigit and Duysak, 2019a), much thinner structures can be designed by using more layers. Therefore, in this study, NSL is simultaneously optimized with thicknesses. A graphical user interface (GUI) is designed on the MATLAB platform to easily obtain possible solutions on the Pareto front. The effectiveness of the method is demonstrated by using both 16 predefined virtual materials (Michielssen et al., 1993) and up-to-date 21 real materials(Yigit and Duysak, 2019a). The designed structures are compared with the similar multi-layer radar absorbers in the literature(Ranjan et al., 2018). 3 different designs (for TE/TM modes) effective at the frequency band of 2-8 GHz, 12-18 GHz and 2-18 GHz at the angles of incident between 0⁰ and 60⁰ are optimized. In addition, 4 different MRA structures are also designed, which consist entirely of real materials, operating across the entire band from 2 to 18 GHz for all angles of incident between 0⁰ and 60⁰.
The physical model of the MRA design and the basic theory of the ABC algorithm are briefly presented in the next section. In Section III, the detailed information of TO-ABC is presented. The implementation of the TO-ABC algorithm and optimized MRA designs are given in Section IV. The concluding remarks and possible further studies are mentioned in the conclusion section.
2. PHYSICAL MODEL of MRA STRUCTURE and ABC ALGORITHM
2.1. Physical Model of MRA Structure
A basic MRA structure consists of different materials coated on a perfect electric conductor. Each layer is defined by different electrical properties and different thickness. The main purpose of the MRA design is to determine the NSL and TT, to minimize the back scattered energy for TE & TM polarizations for desired angle of incidences and frequencies. While the EM wave travels through each layer, it is exposed to the transmission, the absorption and the reflection effects in the each layer. Therefore, the total surface reflection of the MRA depends on the alignment of the entire structure. Since the detailed formulation of MRA design problem was given in many studies (Asi and Dib, 2010; Goudos, 2009; Goudos and Sahalos, 2006a, 2006b; Jiang et al., 2009; Kern and Werner, 2003; Michielssen et al., 1993; Ranjan et al., 2018; Roy et al., 2016, 2015; Toktas et al., 2019, 2018; Weile et al., 1996; Yigit and Duysak, 2019a), in this study only the basic equations are given and critical points are indicated. In the polarization-insensitive MRA design, the back-scattered energy must be minimized in both TE and TM polarizations along with the TT of the MRA. Therefore, three objective functions (𝑶𝑭𝟏, 𝑶𝑭𝟐, 𝑶𝑭𝟑) are defined as follow,
minimize OF1= 𝑚𝑎𝑥𝑖𝑚𝑢𝑚 {20𝑙𝑜𝑔10(𝑅𝑇𝐸)}
minimize OF2= 𝑚𝑎𝑥𝑖𝑚𝑢𝑚 {20𝑙𝑜𝑔10(𝑅𝑇𝑀)}
minimize OF3= 𝑇𝑇
(1) where 𝑹𝑻𝑴 and 𝑹𝑻𝑬 are the reflection coefficient matrices, which includes the TM and TE polarizations corresponding to each of the defined angle of incidence and the frequency values. For an MRA structure with 𝑴 (Mth layer is perfect electric conductor) layer, the RTE
and RTM are defined as follows (Yigit and Duysak, 2019a), 𝑹𝒊𝑻𝑬= 𝒓𝒊 𝑻𝑬+ 𝑹 𝒊+𝟏𝑻𝑬𝒆−𝟐𝒋𝒌𝒊+𝟏𝒅𝒊+𝟏 𝟏 + 𝒓𝒊𝑻𝑬𝑹𝒊+𝟏𝑻𝑬𝒆−𝟐𝒋𝒌𝒊+𝟏𝒅𝒊+𝟏 (2) 𝑹𝒊𝑻𝑴= 𝒓𝒊𝑻𝑴+ 𝑹 𝒊+𝟏𝑻𝑴𝒆−𝟐𝒋𝒌𝒊+𝟏𝒅𝒊+𝟏 𝟏 + 𝒓𝒊𝑻𝑴𝑹 𝒊+𝟏𝑻𝑴𝒆−𝟐𝒋𝒌𝒊+𝟏𝒅𝒊+𝟏 (3)
where 𝒅𝒊 corresponding to the thickness of each layer. The 𝒓𝒊𝑻𝑬 and 𝒓𝒊𝑻𝑴 are given as follows,
𝐫𝐢𝐓𝐄= { 𝛍𝐢+𝟏𝐤𝐢− 𝛍𝐢𝐤𝐢+𝟏 𝛍𝐢+𝟏𝐤𝐢+ 𝛍𝐢𝐤𝐢+𝟏 −𝟏, & 𝐫𝐢𝐓𝐌= { 𝛆𝐢+𝟏𝐤𝐢− 𝛆𝐢𝐤𝐢+𝟏 𝛆𝐢+𝟏𝐤𝐢+ 𝛆𝐢𝐤𝐢+𝟏 𝐢 < 𝐌 𝟏 𝐢 = 𝐌 (4)
According to the angle of incidence 𝜽°, the wave number 𝒌𝒊, of the 𝒊𝒕𝒉 layer is defined as,
𝑘𝑖= 2𝜋𝑓√𝜇𝑖𝜀𝑖− 𝜇0𝜀0𝑠𝑖𝑛2(𝜃) (5) In (4), while 𝝁𝒊 and 𝜺𝒊 are the frequency(𝒇) depended complex permeability and permittivity of the materials, 𝝁𝟎 and𝜺𝟎 are permeability and permittivity of free space,
138 respectively (Yigit and Duysak, 2019a). According to the (2) and (3), the TT of the structure is defined as follow,
𝑇𝑇 = ∑ 𝑑𝑖 𝑀−1
𝑖=1
(6)
2.2. Single-Objective ABC Algorithm for MRA Design Natural inspired metaheuristic optimization techniques can produce satisfactory results which are close to the optimum result for nonlinear problems. ABC is an efficient algorithm inspired by the nectar search activities of honey bee swarms (Karaboga and Basturk, 2007). In the algorithm, the number of food sources (NS) specify the potential solutions of the problem, while the amount of nectar in the sources corresponds to fitness value of the solution. The details of the algorithm developed by modeling the behavior of employed, onlooker and scout bees are given in (Yigit and Duysak, 2019a). The changes made in these three phases in the MO-ABC algorithm are explained in detail in the next section.
3. MO-ABC ALGORITHM
3.1. Multi -Objective Optimization
In the single-objective optimization, optimum results can be obtained by comparing only the single value of the objective function. However, if there is more than one objective function, the problem is defined as a MO optimization problem and all objective functions are simultaneously optimized. The mathematical expression of MO optimization problem can be defined as follows.
𝑚𝑖𝑛𝐹(𝜒) = [𝑓1(𝜒), 𝑓2(𝜒), … . . , 𝑓Π(𝜒)] (7) 𝜒 = [𝑥1, 𝑥2, … … , 𝑥𝑢] 𝑆 (8) where 𝚷, 𝝌 and 𝑺 are the number of the objective functions, 𝒖 dimensional decision variable vector and the search space, respectively. The solution of the multi-objective optimization problem is generally represented by a Pareto optimal set (Deb et al., 2002; Huo et al., 2015). For the minimization problems, if at least one objective value of the solution 𝝌 is less than the other solution 𝝌′, and all objective values of 𝝌′ aren’t less than 𝝌, then 𝝌 dominates 𝝌′. However, if no solution dominates the solution 𝝌′, 𝒕𝒉𝒆𝒏 𝝌′ is called as the nondominated or Pareto-efficient solution. All Pareto solutions constitute elite solution (ES) set which are the possible solutions of the MO problem.
3.2. Multi-Objective ABC Algorithm
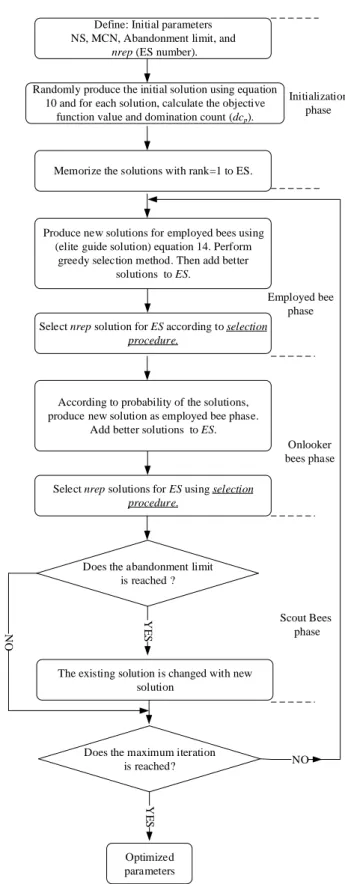
The MO-ABC algorithm includes four phase; initialization, employed bees, onlooker bees and scout bees. The flow chart of the algorithm is given in the Fig.1.
Define: Initial parameters NS, MCN, Abandonment limit, and
nrep (ES number).
Randomly produce the initial solution using equation 10 and for each solution, calculate the objective
function value and domination count (dcp).
Memorize the solutions with rank=1 to ES.
Produce new solutions for employed bees using (elite guide solution) equation 14. Perform
greedy selection method. Then add better solutions to ES.
Select nrep solution for ES according to selection procedure.
Initialization phase
Employed bee phase
According to probability of the solutions, produce new solution as employed bee phase.
Add better solutions to ES.
Select nrep solutions for ES using selection procedure.
Onlooker bees phase
Scout Bees phase Does the abandonment limit
is reached ?
Does the maximum iteration is reached?
The existing solution is changed with new solution Y E S NO Optimized parameters Y E S NO
Figure 1. The flow chart of MOABC 1) Initialization
The population 𝑷 of the bee swarm is defined as follows, 𝑷 = {𝝌𝟏, 𝝌𝟐, … . , 𝝌𝑵𝑺} (9) where 𝑵𝑺 is the number of food source. The initial food sources 𝝌𝒑 are randomly generated by (10),
139 where 𝒑 ∈ {𝟏, 𝟐, … . . , 𝑵𝑺} and 𝒅 ∈ {𝟏, 𝟐, … . . , 𝒖} are the solution vector index and dimension of 𝝌𝒑, respectively. 𝒍𝒃 and 𝒖𝒃 are lower and upper bound of solution vectors.
Determination of elite solutions.
In MO optimization, there are more than one objective function, so it is not simple to determine the non-dominated solutions. In this study, in order to sort and select the ES, fast nondominated sorting (Deb et al., 2002) requiring the less computations, is preferred. For each solution, two parameters are calculated, these are;
1. Domination count, 𝒅𝒄𝒑: the number of solutions which dominate the solution 𝒑,
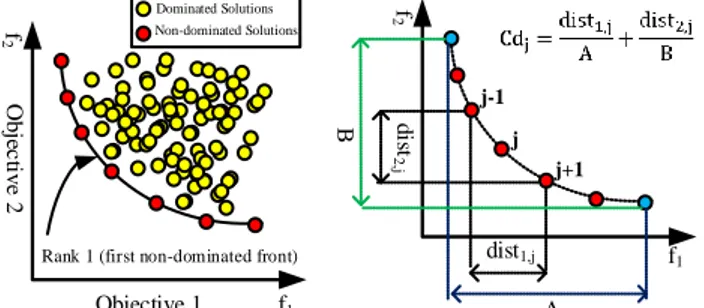
2. 𝑺𝑷: Set of the solutions dominated by solution 𝒑 . In fast nondominated sorting method, the initial values of 𝒅𝒄𝒑 of all solutions in population are defined as zero. For each solution 𝒑 in the population 𝑷 is then compared with every other solution 𝒒 in 𝑷. If the solution 𝒑 is better than 𝒒, then 𝑺𝑷=𝑺𝑷∪ {𝒒}, otherwise; 𝒅𝒄𝒑= 𝒅𝒄𝒑+ 𝟏. If 𝒅𝒄𝒑= 𝟎, 𝒅𝒄𝒑. 𝐫𝐚𝐧𝐤 = 𝟏. Otherwise, 𝒅𝒄𝒑 corresponding to each member (𝒒) of 𝑺𝑷 is reduced by one. When 𝒅𝒄𝒑 of 𝒒 is zero, it is saved to the new 𝑸 list. This 𝑸 list constitutes the second nondominated front. This process continues until all front is determined (Deb et al., 2002). In this study, ES consists of the first nondominated front as illustrated in Fig. 2(a).
Crowding Distance
The crowding-distance is obtained according to each objective function value of the Pareto points. For each objective function, the distance values of the largest and smallest points are assumed as an infinite. The initial values of the distances of all solutions are assigned as zero and then the distances of each solutions for each objective function are updated as follows (Deb et al., 2002).
𝑑𝑖𝑠𝑡𝑚,𝑗 = 𝑑𝑖𝑠𝑚,𝑗+
𝑓𝑚,𝑗+1− 𝑓𝑚,𝑗−1 max(𝑓𝑚) − min (𝑓𝑚)
(11)
where 𝐝𝐢𝐬𝐭𝐦,𝐣 denotes distance of jth solution of mth objective function as illustrated in Fig. 2b.
The exact crowding-distance vector (𝐂𝐝𝐣) is obtained by summing the individual distance values corresponding to each objective as follows,
𝐶𝑑𝑗= ∑ 𝑑𝑖𝑠𝑡𝑚,𝑗 Π
m=1
(12)
Selection procedure
The number of ES can be more than the desired number of archive, 𝐧𝐫𝐞𝐩. Therefore, population selection strategy must be applied to select solutions to constitute 𝐄𝐒. Since the ranks of the all solutions in ES are equal to 1, the solutions with the higher distance should be selected.
For this purpose, the crowding distance values (𝐂𝐝) of all solutions are sorted in descending form and the first 𝐧𝐫𝐞𝐩 solutions are selected.
2) Employed Bee Phase
In the employed bee phase, bees search new food sources to improve the existing solution. In the original ABC algorithm(Karaboga and Basturk, 2007), a new food source 𝛘′ is generated by using (13) for each employed bee sources (𝐧 = 𝟏 … 𝐍𝐒),
𝜒𝑛𝑟′ = 𝜒𝑛𝑟+ (𝜒𝑛𝑟− 𝜒𝑘𝑟) (13) where 𝛘𝐤𝐫 is neighbour solution of 𝛘𝐧𝐫 corresponding to the randomly generated 𝐫 ∈ [𝟏, 𝐮].
Original ABC algorithm don’t use the ES or best solution. However, to effectively improve the solutions in MO-ABC, the new solutions must be updated based on the ES (Huo et al., 2015). In the second phase of the MO-ABC algorithm, a new food source is produced by the following equation (Huo et al., 2015),
𝝌′
𝒏𝒓= 𝝌𝒏𝒓+ (𝝌𝒏𝒓− 𝝌𝒌𝒓) + (𝒚𝒏𝒓− 𝝌𝒌𝒓)
𝒚𝒏𝒓𝑬𝑺 (14)
where and are random numbers in the ranges of [-1, 1] and [0, 2], respectively. 𝐲𝐧𝐫 denotes the randomly selected solution from 𝐄𝐒.
The choice between the existing and new solutions is determined by means of the greed selection. If the existing solution is worse than the new solution, the abandonment counter is reset and 𝐄𝐒 = 𝐄𝐒 ∪ {𝛘′𝐧}; otherwise, the counter is increased. After all employed bees search new food source, 𝐄𝐒 is updated by performing the selection procedure.
f1 f 2 j j+1 j-1 dist1,j d is t 2 ,j A B f1 f 2 Objective 1 O b je c tiv e 2
Rank 1 (first non-dominated front)
Dominated Solutions Non-dominated Solutions
Figure 2. Illustration of the Pareto front points; a) Dominated and non-dominated solutions, b) Determination of Crowded distances
3) Onlooker Bee Phase
In the onlooker bee phase, in order to calculate the selection probability value, the fitness value of each solution must be calculated. For a single objective function, the fitness value is calculated as follows (Karaboga and Basturk, 2007)
𝑓𝑖𝑡(𝜒𝑛) = 1
1 + 𝑓(𝜒𝑛) (15)
However, in the MO optimization, since the number of objective functions is more than one, (15) is not applicable. Thus, the fitness function based on
140 normalization should be used. The normalization calculation is as follows (Huo et al., 2015),
𝑓′ 𝑚(𝜒𝑛) = { max(𝑓𝑚) − 𝑓𝑚(𝜒𝑛) max(𝑓𝑚) − min(𝑓𝑚) , 𝑖𝑓 max(𝑓𝑚) ≠ min(𝑓𝑚) 1, 𝑖𝑓 max(𝑓𝑚) = min(𝑓𝑚) (16)
The 𝒇𝒊𝒕(𝝌𝒏) is calculated as following equation (Huo et al., 2015) 𝑓𝑖𝑡(𝜒𝑛) = 1 Π∑ 𝑓 ′ 𝑚(𝜒𝑛) Π 𝑚=1 (17)
The selection probability is calculated as follows,
𝑝𝑟𝑜𝑏𝑛= 0.9𝑓𝑖𝑡(𝜒𝑛) max𝑛=1𝑁𝑆 𝑓𝑖𝑡(𝜒
𝑛)
+ 0.1 (18)
Then, each of the onlooker bees searches the new food source depending on the selection probability. If randomly generated number in the range of [𝟎, 𝟏] is greater than 𝒑𝒓𝒐𝒃𝒏, the new solution will be produced using (14) and the steps in the employed bee phase are applied.
4) Scout Bee Phase
In this phase, if a solution is not improved when the abandonment limit is reached, the existing solution is changed. For this purpose, the existing employed bee is transformed to the scout bee and a new food source is generated by (10). Thus, the algorithm continues to run until the maximum cycle number (MCN) or it reaches a predefined stop criteria.
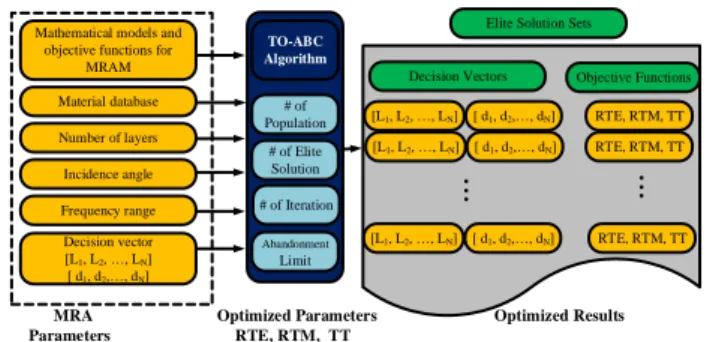
4. IMPLEMENTATION OF TO-ABC ALGORITHM The TO-ABC method for MRA design consists of 3 main parts as seen in Fig. 3. The objective functions of the algorithm are defined as given in (1).
Number of layers Material database Mathematical models and
objective functions for MRAM
Incidence angle
Frequency range
MRA Optimized Parameters Optimized Results Parameters RTE, RTM, TT Decision vector [L1, L2, , LN] [ d1, d2, , dN] [L1, L2, , LN] [ d1, d2, , dN] Decision Vectors RTE, RTM, TT Objective Functions Elite Solution Sets
[L1, L2, , LN] [ d1, d2, , dN] [L1, L2, , LN] [ d1, d2, , dN] RTE, RTM, TT RTE, RTM, TT
...
...
# of Population # of Elite Solution # of Iteration Abandonment Limit TO-ABC AlgorithmFigure 3. Implementation of TO-ABC to design of MRA The parameters of the MRA structure and TO-ABC algorithm are defined as given in Fig. 3. Since the minimum layer thicknesses are defined as 0, at the end of the optimization the layers with zero thicknesses are removed from the sequence. Thus, the ES are listed as shown in the Fig. 3 and optimized results are obtained. 4.1. Graphical User Interface for MRA Design
Dozens of studies have been done for the MRA design in the last quarter century. Each of these studies aimed to develop a part of the design problem. In this study, a fully
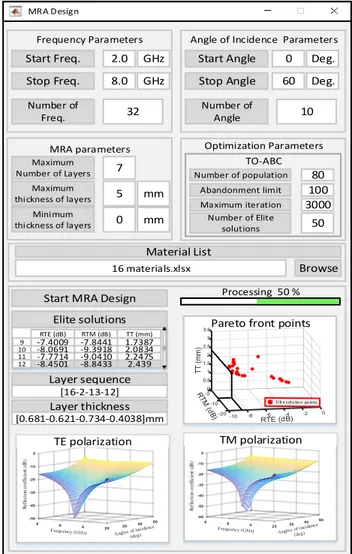
optimized MRA design method is presented for the first time. However, since there are many parameters to consider in MRA design, an easily accessible interface is needed for real applications. Therefore, in this study, a GUI is developed for a fully optimized MRA design. As seen in Fig. 4 the GUI has 5 different parametric inputs such as Frequency, Angle of Incidence, MRA, Optimization and Material List. After these inputs have been defined, the program is run by clicking the “Start
MRA Design” button. Once the optimization is completed,
the optimal results determined on the Pareto front are illustrated in the GUI, while the corresponding RTE, RTM and TT values are listed in the “Elite Solution” section. In GUI, the operator selects the desired result according to the trade-off between RTE, RTM and TT. The NSL and thicknesses of layers corresponding to the selection of the operator are given in the “Layer sequence & Thickness” section and the reflection coefficients for TE and TM polarizations are plotted depending on the angle of incidence. Thus, with the developed GUI, MRA designers can easily access the results they need. 4.2. Fair Comparison Criterias and Comparison Data
Several studies have been conducted for MRA design so far and the superiority of the proposed methods in each study have been compared with previous ones. In order to make a fair comparison, the designed MRAs should be compared based on the same parameters. These parameters can be summarized as follows. 1. When comparing the two designs, it is not fair to
consider only the maximum reflection coefficients and to ignore thicknesses. Because it is obvious in MRA design that maximum reflection coefficient decreases with increasing thickness.
2. It is also not true to compare broad-band wide-angle designs for a single type of polarization. For example, while the maximum reflection coefficient for TE polarization is minimized, TM increases. Therefore, the reflection coefficients for TE and TM polarizations need to be optimized simultaneously. 3. When making comparisons, optimizing both designs
for the same angle of incidence is another important consideration. For example, it is a not fair comparison to compare an MRA structure which is optimized between 0⁰ and 40⁰ with another design which is optimized between 0⁰ and 60⁰. Because, it is an expected result that the MRA optimized for 60⁰ has worse RTE, RTM and TT values than the MRA optimized for 40⁰.
4. Finally, when presenting the performances of the designs, it is not a consistent method to give the average values of the reflection coefficients relative to the all frequency band and angle of incidence. Because, if the design has a very low reflection coefficient at any angle or frequency, it significantly reduces the average value and affects the general information about other values.
Therefore, these issues should be taken into consideration in order to make a rational assessment. For example, the designs optimized between 0-40⁰ in (Toktas et al., 2019) were compared to those given in
141 references(Ranjan et al., 2018; Roy et al., 2015). However, since the designs given in (Roy et al., 2015) were optimized only for normal incidence, their performances at 40⁰ are inherently worse than the (Toktas et al., 2019). It is also unfair to compare the designs in (Toktas et al., 2019) with the designs in (Ranjan et al., 2018) , as the MRAs in (Ranjan et al., 2018) were optimized to operate between 0⁰ and 60⁰.
Based on these 4 criteria, in this study, the designs optimized with 16 virtual materials are compared to those in (Ranjan et al., 2018). Since the formulation (2)&(3) was verified with computer simulation technology (CST) in the previous study(Yigit and Duysak, 2019a), the CST results are not given in this study. 4.3. Designed Fully Optimized MRAs with 16 Virtual Materials
To show the success and practice usage of the TO-ABC, virtual materials listed in (Michielssen et al., 1993) are selected as the material list in the GUI. Three types of MRAs effective in the frequency ranges of 2-8 (Des1), 12-18 (Des2) and 2-12-18 GHz (Des3) are optimized. The angles of incidence are changed between 0⁰ and 60⁰. These are compared with those in(Ranjan et al., 2018). All design parameters except the frequency band are selected as shown in Fig. 4. While plotting the reflection coefficients, to obtain high-resolution graphics, the resolutions of frequency and angle are determined as 0.1 GHz and 1⁰, respectively. As seen in Table 1, at the end of the TO-ABC algorithm, different MRA structures having different NL and sequences are optimized. As shown in Fig. 4, although the number of ES are identified as 50, a total of 19 possible solutions are found and 7 of them are given in Table 1. It should be noted that the RTE and RTM values given in all Tables are the maximum values between all angles of incidence (𝜽 ∈ [𝟎°, 𝟔𝟎°]) and frequencies. The 3D plots of RTE and RTM according to angle of incidence and the frequency are illustrated in Fig. 4. When these solutions are compared with the results given in the (Ranjan et al., 2018), it is seen that the highlighted solution 12 in Table 1 is similar to the design in the (Ranjan et al., 2018).
However, although there is a difference of 0.02 dB in RTE, RTM and TT values are lower than those found in [13]. When the other values in Table 1 are examined, it is seen that there are much thinner designs with much lower RTM values than the solution 12. However, it should be noted that RTE values of the other solutions are higher than solution 12.When the solution 13 of Des2 is compared with the respective MRA(Ranjan et al., 2018)
in Table 2, it can be seen that both TT, RTE and RTM of the MRA are lower than the(Ranjan et al., 2018). This result clearly demonstrates the success of the proposed method. Furthermore, due to the nature of the MO approach, lower reflection coefficients can be obtained by sacrificing thickness or much finer MRAs can be chosen from Table 2 by compromising from reflection coefficient. Considering Table 3, where the results of Des3 are listed, it can be seen that all the ES consist of 4 layers and most of them have same sequence except from third layer. Furthermore, when the solution 16 in Table 3 is compared with (Ranjan et al., 2018), it is seen that although they have the same sequence, both the RTE, RTM and TT values of the solution 16 are much better than the (Ranjan et al., 2018). This result is a clear indication of the necessity of the triple objective approach in MRA design.
Start Freq. 2.0 Stop Freq. 8.0 Number of Freq. 32 Frequency Parameters Start Angle Stop Angle Number of Angle 10
Angle of Incidence Parameters
GHz GHz 0 60 Deg. Deg. Maximum Number of Layers 7 Maximum thickness of layers MRA parameters 5 mm Minimum thickness of layers 0 mm Optimization Parameters TO-ABC Number of population 80 Abandonment limit 100 3000 Maximum iteration 50 Number of Elite solutions Material List Browse 16 materials.xlsx
Start MRA Design Processing 50 %
Elite solutions RTE (dB) RTM (dB) TT (mm) 10 11 12 -8.4501-7.7714 -8.8433-9.0410 2.24752.439 -8.0691 -9.3918 2.0834 -7.4009 -7.8441 1.7387 Layer sequence [16-2-13-12] Layer thickness [0.681-0.621-0.734-0.4038]mm
Pareto front points MRA Design 0 0.5 1 0 1.5 2 2.5 3 3.5 -10 0 -2 -20-10 -8 -6 -4 TT (mm ) R ef le ct io n c o ef fi ci en t (dB ) TE polarization R ef le ct io n c o ef fi ci en t (dB ) TM polarization 9
Figure 4. The GUI for fully optimized MRA design Table 1. The results corresponding to some of the pareto points obtained by TO-ABC algorithm for Des1 (2-8 ghz)
Layer sequence d1 d2 d3 d4 RTE RTM TT
6 [16-1-9] 0.569 0.332 0.838 -7.401 -7.844 1.739 7 [16-2-10-11] 0.572 0.302 0.415 0.560 -7.554 -9.541 1.849 8 [16-2-10-9] 0.650 0.300 0.373 0.581 -7.768 -9.045 1.903 9 [16-11-2-15] 0.486 0.345 0.877 0.300 -8.056 -7.834 2.008 10 [16-2-9-11] 0.656 0.447 0.417 0.563 -8.069 -9.392 2.083 11 [14-2-13] 0.629 1.006 0.612 -7.771 -9.041 2.248 12 [16-2-13-12] 0.681 0.621 0.734 0.404 -8.450 -8.843 2.440
Data from (Ranjan et al., 2018)
142
Table 2. The results corresponding to some of the pareto points obtained by TO-ABC algorithm for Des2 (8-12 GHz)
Layer sequence d1 d2 d3 d4 RTE RTM TT
8 [16-2] 0.364 0.286 -6.668 -12.685 0.650 9 [16-8] 0.376 0.370 -7.050 -12.879 0.746 10 [16-2-5-6] 0.376 0.276 0.040 0.124 -7.742 -9.050 0.817 11 [16-8-6] 0.376 0.308 0.250 -7.776 -10.878 0.935 12 [16-8-16] 0.259 0.651 0.136 -8.021 -11.531 1.046 13 [16-8-12-6] 0.376 0.560 0.014 0.162 -8.543 -10.484 1.113 14 [16-8-6] 0.373 0.634 0.250 -9.302 -9.622 1.256
Data from (Ranjan et al., 2018)
Layer sequence d1 d2 d3 d4 RTE RTM TT
[16-7-3-8] 0.358 0.414 0.130 0.293 -8.510 -9.940 1.195
Table 3. The results corresponding to some of the pareto points obtained by TO-ABC algorithm for Des3 (2-18 GHz)
Layer sequence d1 d2 d3 d4 RTE RTM TT
12 [16-7-3-14] 0.340 1.227 0.379 0.501 -6.714 -7.277 2.447 13 [16-7-3-14] 0.340 1.036 0.731 0.385 -6.768 -7.854 2.492 14 [16-7-3-14] 0.340 1.183 0.631 0.425 -6.899 -7.782 2.579 15 [16-7-4-14] 0.340 1.300 0.568 0.445 -6.972 -8.448 2.653 16 [16-7-5-14] 0.349 1.245 1.000 0.319 -7.444 -8.466 2.912 17 [16-6-3-14] 0.340 1.232 1.063 0.367 -7.333 -8.183 3.002 18 [16-7-3-15] 0.340 1.264 1.094 0.367 -7.150 -8.658 3.065
Data from (Ranjan et al., 2018)
Layer sequence d1 d2 d3 d4 RTE RTM TT
[16-7-5-14] 0.348 1.246 1.002 0.326 -7.400 -8.300 2.920
4.4. Designed MRAS with Real Materials
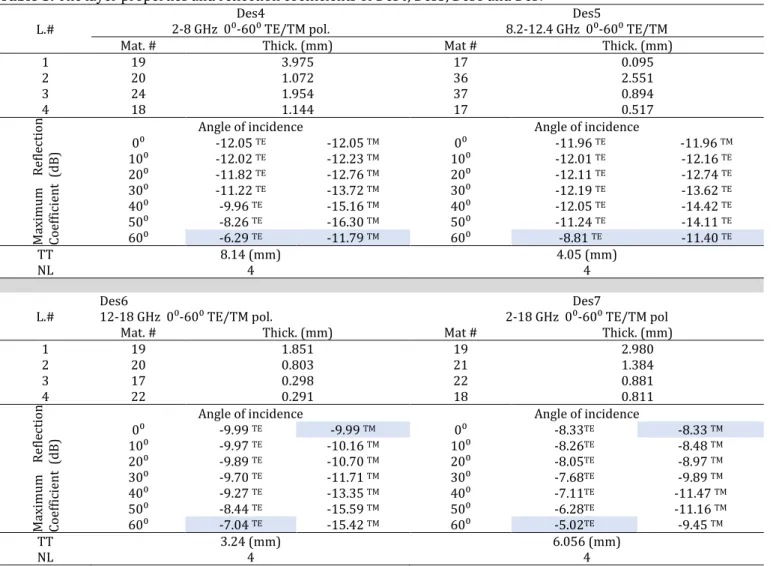
After the importance of TO-ABC approach in the fully optimized MRA design has been proved by the use of predefined virtual materials, real MRA structures have been designed with much more limited real materials. For this purpose, a new material pool of 21 fabricated materials presented in the literature(Yigit and Duysak, 2019a) are used. The compositions of the materials and measured operating frequencies are given in Table 4. The frequency dependent complex permeabilities 𝝁𝒊 and permittivities 𝜺𝒊 of these 21 up-to-date materials can be downloaded from (Yigit and Duysak, 2019a, 2019b). 4 types of MRA structures labeled as Des4 (2-8 GHz), Des5 (8.2-12.4GHz), Des6 (12-18GHz) and Des7 (2-18 GHz) are optimized at wide-angle (0⁰-60⁰). The layer properties and labels of the selected designs are listed in Table 5. In GUI software, the control parameters of the optimization process such as maximum number of layers, abandonment limit, maximum iteration number, population number and maximum number of elite solution are selected as 10, 100, 3000, 100 and 100, respectively. The maximum and minimum layer thicknesses are defined as 4 mm and 0 mm, respectively. Thus, at the end of the optimization, the layers having a thickness of 0 mm is removed from the structure. In these designs, since the used real materials are limited, TT is ignored when choosing between the ES and the solutions with minimum reflection coefficient are presented. Des4, Des5, Des6 and Des7 are selected by considering both
RTE and RTM values. While some designs have lower RTM values, these designs have higher RTE values than other designs.
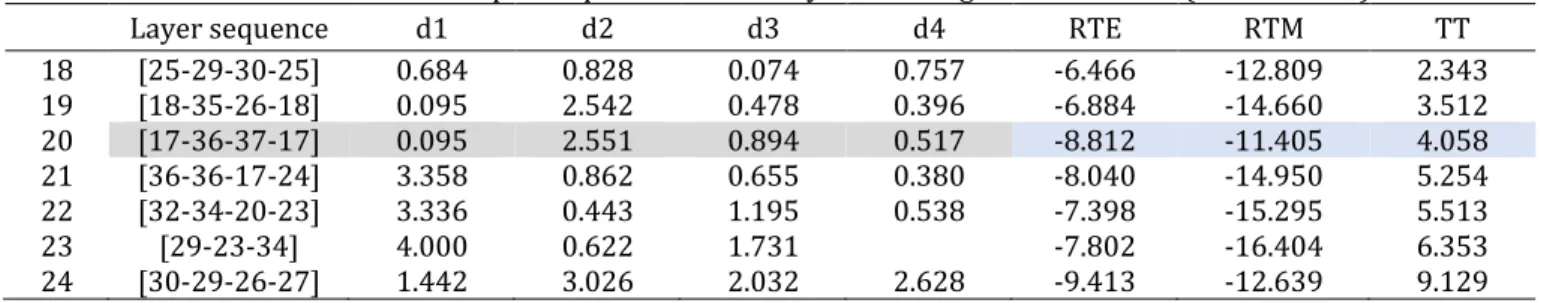
Although the reflection coefficients of the designed MRAs can be simply obtained by using (2, 3), for an easier assessment, RTE and RTM corresponding to the each 10⁰ angle of incidences are presented in Table 5. As seen in Table 6, 7, 8 and 9, 7 design are given in each table. As shown in Table 6, the RTE and RTM of solution 33 of Des5 are -6.29 and -11.79 dB for whole angles of incidence and the frequencies. In the initial parameters of the TO-ABC algorithm, this value can be selected larger, so that thicker, but better MRA structures can be designed. Since the all materials given in Table 4 can be used in Des5, much more successful MRA structures are designed than the Des4. As shown in Table 7, the TT of solution 20 is 4.058 mm, although it has an absorption capability of 87% for all frequencies and all angles of incident between 0⁰-60⁰. When the solution 24 given in Table 7 is observed, it is realized that the TT increases but the maximum reflection coefficients considerably decreases. In Des6, 8 materials given in the Table 4 are used. The ES obtained after TO-ABC are given in Table 8. Although all solutions have the same layer sequence, they have different thickness and reflection coefficient values. Among these solutions, the solution 15 with the lowest RTE value is selected and the RTE and RTM values are seen in Table 5.
143
Table 4. Up-to-date materials listed in literature (Yigit and Duysak, 2019a, 2019b)
Material number Fabricated Materials Measured Frequency range (GHz)
17 of powder is 50% Dispersed Alinco (Fe49.7Co24Ni14Al8Cu3Nb1Ti0.3) powder in paraffin wax. Fraction 2-18
18 Dispersed Alinco powder in paraffin wax. Fraction of powder is 60% 2-18
19 Ba0.85Sm0.15Co2Fe16O27 hexaferrite 2-18
20 Pure porous carbon, obtained through the pyrolysis of pure ZIF-67 2-18
21 The Ferrit/Co/porous carbon materials obtained through the pyrolysis of Ba
0.85Sm0.15Co2Fe16O27 @ZIF-67 template at 500⁰C 2-18
22 … Ba0.85Sm0.15Co2Fe16O27 @ZIF-67 template at 550⁰C 2-18
23 …Ba0.85Sm0.15Co2Fe16O27 @ZIF-67 template at 650⁰C 2-18
24 Carbon coated nickel nanocapsule 2-18
25 U-type hexaferrite Ba
4(Co1-3xCrx)2Fe36O60) for different values of x 8.2 - 12.4
26 U-type hexaferrite Ba
4(Co1-3xCrx)2Fe36O60) for different values of x 8.2 - 12.4
27 U-type hexaferrite Ba
4(Co1-3xCrx)2Fe36O60) for different values of x 8.2 - 12.4
28 U-type hexaferrite Ba
4(Co1-3xCrx)2Fe36O60) for different values of x 8.2 - 12.4
Polyaniline (PA)/expanded graphite (EG) composites mixed at different weight percentages (wt. %) with novolac phenolic resin (NPR) (PA/EGx – NPR) 29 x=0.15, 10 wt.% 8.2 - 12.4 30 x=0.15, 20 wt.% 31 x=0.15, 30 wt.% 32 x=0.25, 10 wt.% 33 x=0.25, 20 wt.% 34 x=0.25, 30 wt.% 35 x=0.00, 10 wt.% 36 x=0.00, 20 wt.% 37 x=0.00, 30 wt.%
Table 5. The layer properties and reflection coefficients of Des4, Des5, Des6 and Des7
L.# 2-8 GHz 0⁰-60⁰ TE/TM pol. Des4 8.2-12.4 GHz 0⁰-60⁰ TE/TM Des5
Mat. # Thick. (mm) Mat # Thick. (mm)
1 19 3.975 17 0.095 2 20 1.072 36 2.551 3 24 1.954 37 0.894 4 18 1.144 17 0.517 Ma xim um Ref lecti on Coeff ici ent (dB)
Angle of incidence Angle of incidence
0⁰ -12.05 TE -12.05 TM 0⁰ -11.96 TE -11.96 TM 10⁰ -12.02 TE -12.23 TM 10⁰ -12.01 TE -12.16 TE 20⁰ -11.82 TE -12.76 TM 20⁰ -12.11 TE -12.74 TE 30⁰ -11.22 TE -13.72 TM 30⁰ -12.19 TE -13.62 TE 40⁰ -9.96 TE -15.16 TM 40⁰ -12.05 TE -14.42 TE 50⁰ -8.26 TE -16.30 TM 50⁰ -11.24 TE -14.11 TE 60⁰ -6.29 TE -11.79 TM 60⁰ -8.81 TE -11.40 TE TT 8.14 (mm) 4.05 (mm) NL 4 4
L.# Des6 12-18 GHz 0⁰-60⁰ TE/TM pol. 2-18 GHz 0⁰-60⁰ TE/TM pol Des7
Mat. # Thick. (mm) Mat # Thick. (mm)
1 19 1.851 19 2.980 2 20 0.803 21 1.384 3 17 0.298 22 0.881 4 22 0.291 18 0.811 Ma xim um Ref lecti on Coeff ici ent (dB)
Angle of incidence Angle of incidence
0⁰ -9.99 TE -9.99 TM 0⁰ -8.33TE -8.33 TM 10⁰ -9.97 TE -10.16 TM 10⁰ -8.26TE -8.48 TM 20⁰ -9.89 TE -10.70 TM 20⁰ -8.05TE -8.97 TM 30⁰ -9.70 TE -11.71 TM 30⁰ -7.68TE -9.89 TM 40⁰ -9.27 TE -13.35 TM 40⁰ -7.11TE -11.47 TM 50⁰ -8.44 TE -15.59 TM 50⁰ -6.28TE -11.16 TM 60⁰ -7.04 TE -15.42 TM 60⁰ -5.02TE -9.45 TM TT 3.24 (mm) 6.056 (mm) NL 4 4
144
Table 6. The results selected from 50 pareto points obtained by TO-ABC algorithm for Des4 (2-8 GHz)
Layer sequence d1 d2 d3 d4 RTE RTM TT
28 [19-21-20-18] 3.535 0.780 0.299 1.232 -5.051 -10.600 5.845 29 [19-21-20-18] 3.118 1.481 0.458 1.082 -4.928 -10.794 6.138 30 [19-21-20-18] 4.000 0.770 0.012 1.422 -5.171 -11.162 6.204 31 [19-20-18] 4.000 1.082 1.461 -5.238 -11.749 6.543 32 [19-20-18] 4.000 1.159 1.422 -5.268 -11.827 6.581 33 [19-20-24-18] 3.975 1.072 1.954 1.144 -6.290 -11.790 8.140 34 [19-24-17] 4.000 3.802 1.508 -6.048 -12.813 9.310
Table 7. The results selected from 38 pareto points obtained by TO-ABC algorithm for Des5 (8.2-12.4 GHz)
Layer sequence d1 d2 d3 d4 RTE RTM TT
18 [25-29-30-25] 0.684 0.828 0.074 0.757 -6.466 -12.809 2.343 19 [18-35-26-18] 0.095 2.542 0.478 0.396 -6.884 -14.660 3.512 20 [17-36-37-17] 0.095 2.551 0.894 0.517 -8.812 -11.405 4.058 21 [36-36-17-24] 3.358 0.862 0.655 0.380 -8.040 -14.950 5.254 22 [32-34-20-23] 3.336 0.443 1.195 0.538 -7.398 -15.295 5.513 23 [29-23-34] 4.000 0.622 1.731 -7.802 -16.404 6.353 24 [30-29-26-27] 1.442 3.026 2.032 2.628 -9.413 -12.639 9.129
Table 8. The results selected from 40 pareto points obtained by TO-ABC algorithm for Des6 (12-18 GHz)
Layer sequence d1 d2 d3 d4 RTE RTM TT
9 [19-20-17-22] 1.061 1.006 0.297 0.185 -5.379 -12.993 2.549 10 [19-20-17-22] 1.279 0.837 0.243 0.289 -5.547 -13.839 2.648 11 [19-20-17-22] 1.362 0.791 0.250 0.312 -5.743 -14.561 2.715 12 [19-20-17-22] 1.486 0.761 0.298 0.283 -5.793 -14.516 2.827 13 [19-20-17-22] 1.461 0.801 0.298 0.291 -5.846 -14.192 2.851 14 [19-20-17-22] 1.560 0.814 0.298 0.291 -6.199 -12.922 2.963 15 [19-20-17-22] 1.851 0.803 0.298 0.291 -7.036 -9.994 3.243
Table 9. The results selected from 19 pareto points obtained by TO-ABC algorithm for Des7 (2-18 GHz)
Layer sequence d1 d2 d3 d4 RTE RTM TT
11 [19-24-21-18] 2.894 0.093 1.925 0.837 -4.960 -8.763 5.749 12 [19-21-22-18] 2.781 1.387 0.742 0.866 -4.811 -9.647 5.775 13 [19-24-21-18] 2.894 0.232 1.866 0.849 -4.897 -8.960 5.842 14 [19-24-21-18] 2.894 0.353 1.783 0.897 -4.872 -9.152 5.928 15 [19-21-22-18] 2.980 1.384 0.881 0.811 -5.026 -8.330 6.056 16 [19-21-22-18] 2.885 1.598 0.898 0.771 -5.000 -9.247 6.153 17 [19-24-20-18] 2.796 1.334 1.526 1.098 -4.911 -9.158 6.754
As listed in the Table 5, both RTE and RTM of Des7 are below -7 dB for the all angles of incidence between 0⁰-40⁰. Although the all designs in this section are optimized using limited number materials, the obtained satisfactory results clearly demonstrate the superiority of the TO-ABC method.
As shown in Table 5, reflection coefficients of the Des6 is below -9.27 dB for entire frequency band and angles of incident between 0⁰- 40⁰. Since the Des7 is optimized to operate at broad-band (2-18 GHz), as shown in Table 9, the maximum reflection coefficient is found about -5 dB for whole angles of incidence.
4. CONCLUSION
In the last 25 years, optimization based many studies have been carried out for MRA design. While the majority of these studies were performed with single-objective optimization, some of them were performed with double-objective approaches. However, in order to
fully optimize an MRA structure, RTE, RTM and TT must be simultaneously optimized. Thanks to the proposed TO-ABC algorithm, RTE, RTM and TT are simultaneously optimized for the first time and the ES of the objective functions are successfully obtained. Three MRA structures designed with virtual materials are compared with the latest MRAs in the literature and the performance of the proposed method is demonstrated. In addition, thanks to the developed GUI, a practical and easy user interface for MRA design is also provided.
Furthermore, four different broad-band wide-angle MRAs operating in the frequency ranges of 2-18 GHz are designed using 21 real-materials presented in recent years. Thanks to developed TO-ABC algorithm, despite the limited number of materials, all possible solutions providing the specified parameters are achieved and successful MRA structures are designed. With the help of proposed GUI, MRA designs can be practically realized without the need for complex computer scripts. Since the results obtained in this study provide a new perspective
145 for MRA design, triple-objective approach can be developed for different optimization techniques in further studies.
REFERENCES
Asi M & Dib N I (2010). Design of multilayer microwave broadband absorbers using central force optimization. Progress in Electromagnetic Research, 26, 101–113.
Deb K, Pratap A, Agarwal S & Meyarivan T (2002). A fast and elitist multiobjective genetic algorithm: NSGA-II. IEEE Trans. Evol. Comput. 6, 182–197. https://doi.org/10.1109/4235.996017
Goudos S K (2009). Design of microwave broadband absorbers using a self‐adaptive differential evolution algorithm. International Journal of RF and Microwave Computer‐Aided Engineering, 19(3), 364–372. Goudos S K & Sahalos J N (2006a). Design of Broadband
Radar Absorbing Materials using Particle Swarm Optimization, Proceedings of EMC Europe, 1111– 1116.
Goudos S K & Sahalos J N (2006b). Microwave absorber optimal design using multi‐objective particle swarm optimization. Microwave and Optical Technology Letters, 48, 1553–1558.
Huo Y, Zhuang Y, Gu J & Ni S (2015). Elite-guided multi-objective artificial bee colony algorithm. Applied Soft
Computing 32, 199–210.
https://doi.org/https://doi.org/10.1016/j.asoc.201 5.03.040
Jiang L, Cui J, Shi L & Li X (2009). Pareto optimal design of multilayer microwave absorbers for wide-angle incidence using genetic algorithms. IET microwaves, antennas & Propagation, 3(4), 572–579.
Karaboga D & Basturk B (2007). A powerful and efficient algorithm for numerical function optimization: artificial bee colony (ABC) algorithm. Journal of Global Optimization, 39(3), 459–471.
Kern D J & Werner D H (2003). A genetic algorithm approach to the design of ultra-thin electromagnetic bandgap absorbers. Microwave and Optical
Technology Letters, 38, 61–64.
https://doi.org/10.1002/mop.10971
Michielssen E, Sajer J-M, Ranjithan S & Mittra R (1993). Design of lightweight, broad-band microwave absorbers using genetic algorithms. IEEE
Transactions on Microwave Theory and Technology, 41(6), 1024–1031.
Ranjan P, Choubey A & Mahto S K (2018). A novel approach for optimal design of multilayer wideband microwave absorber using wind driven optimization technique. AEU-International Journal of Electronics and Communications, 83, 81–87.
Roy S, Mahanti A, Roy S D & Mahanti G K (2016). Comparison of Evolutionary Algorithms for Optimal Design of Broadband Multilayer Microwave Absorber for Normal and Oblique Incidence. Applied Computational Electromagnics Society Journal, 31(1). Roy S, Roy S D, Tewary J, Mahanti A & Mahanti G K (2015). Particle swarm optimization for optimal design of broadband multilayer microwave absorber for wide angle of incidence. Progress in Electromagnics Research, 62, 121–135.
Toktas A, Ustun D & Tekbas M (2019). Multi-Objective Design of Multi-Layer Radar Absorber Using Surrogate-Based Optimization. IEEE Transations on Microwave Theory and Technology, 67, 3318–3329. https://doi.org/10.1109/TMTT.2019.2922600 Toktas A, Ustun D, Yigit E, Sabanci K & Tekbas M (2018).
Optimally Synthesizing Multilayer Radar Absorbing Material (RAM) Using Artificial Bee Colony Algorithm. Proceedings of International Seminar/Workshop on Direct and Inverse Problems of Electromagnetic and Acoustic Wave Theory, DIPED. IEEE, 237–241. https://doi.org/10.1109/DIPED.2018.8543261 Weile D S, Michielssen E & Goldberg D E (1996). Genetic
algorithm design of Pareto optimal broadband microwave absorbers. IEEE Transactions on Electromagnetic Compatibility, 38(3), 518–525. Yigit E & Duysak H (2019)a. Determination of Optimal
Layer Sequence and Thickness for Broadband Multilayer Absorber Design Using Double-Stage Artificial Bee Colony Algorithm. IEEE Transactions on Microwave Theory and Techniques, 67(8), 3306– 3317.
Yigit E & Duysak H (2019)b. electrical_properties.xlsx. IEEE Transactions on Microwave Theory and Technology
https://ieeexplore.ieee.org/abstract/document/874 4403/media#media
© Author(s) 2021.